
Analyze shipments and profit by customer and salesperson
Guide information
Requirements
This tutorial requires the installation of the following applications/modules:
Logistics Shipment Sale Integration (installed automatically with the Sales app) - owns the Shipment Profitability report used throughout this page
Freight Sale - adds the Profit by Customer and Profit by Salesperson menus, reading the same report grouped differently
Freight Sale - Consolidation Profitability Bridge (installed automatically when both Freight Sale and Freight Consolidation are active) - adds the Shipment Role column used further down this page
Logistics Routes Integration (installed automatically with Logistics Shipment and Routes) - owns the Top Routes report
These four reports read the same underlying figures as the Charges tab of a shipment (see Record charges, invoice the customer, and bill vendors), but on a different rule: Charges shows every buy and sell price you have entered, whether or not it has reached an invoice or a bill yet, while these reports count revenue from the confirmed sales order and cost only from posted bills. Reading a report number as if it followed the Charges tab’s rule is the most common way to misjudge a shipment’s real profitability.
Running scenario: Tuan (Accounting) and Duc (Operations Manager) read Nhat Long Footwear’s FCL export (SHP/26xx/000nn, Gross Profit 17,180,000 VND on its Charges tab) and the SITC LCL import master (container SITU6677887, 4 houses: Sao Mai Cosmetics, Dong Do Electronics, Thanh Cong Textile Materials, Viet Han Food Import).
Note
Only the freight Administrator access level sees these report menus: Profit Reports and are restricted to it (see Settings –> Users & Companies –> Users (ask your administrator)).
How Cost and Revenue differ from the Charges tab
Cost only counts an analytic entry that already came from a posted vendor bill or purchase receipt. A vendor bill still in Draft contributes 0 here, even when the same charge already shows a Cost Price on the Charges tab.
Revenue (Untaxed) counts a sales order line as soon as the order is confirmed - Viindoo’s standard invoicing policy puts the line at To Invoice right away, it does not wait for the customer invoice to actually be issued. A charge added on the shipment but not yet synced back to the sales order does not count here at all.
Because Revenue starts counting earlier (at SO confirmation) than Cost does (at bill posting), Profit on this page can run higher than the Gross Profit on the Charges tab early in a shipment’s life, not lower or zero as you might expect. Once every vendor bill for the shipment is posted, the two numbers converge.
Fields on every profit report
Label on screen |
What it means |
Filled by |
|---|---|---|
Cost |
Sum of posted vendor bill and purchase receipt lines on the shipment’s analytic account, always shown in company currency (VND) even when the original charge was priced in USD. |
System, once a bill is posted |
Revenue (Untaxed) |
Sum of confirmed sales order lines, converted to company currency at the order’s own exchange rate. |
System, once the sales order is confirmed |
Profit |
Revenue minus Cost, on the two gated figures above - not the same figure as Gross Profit on the Charges tab. |
System |
Profit Margin (%) |
|
System |
Currency |
Always your company’s currency (VND) - not the USD the ocean freight was actually quoted and sold in. |
System |
Shipment Role |
Direct, Master (Consol) or House LCL - only shown once Freight Sale - Consolidation Profitability Bridge is installed. A Master row and its House rows are independent lines, never summed automatically into one another here. |
System |
Open Profit by Customer and Profit by Salesperson
These two menus read the exact same report, pre-filtered with a different Group By - Profit by Customer for a commercial review, Profit by Salesperson for evaluating each Sales person’s book.
Go to . Switch to the Pivot view and add the This Year filter. For this example, search Customer for Nhat Long Footwear, then add Group By –> Shipment to separate the FCL shipment from the mixed-container shipment. A customer total combines all included shipments.

Tip
This step is done when: the SHP/2610/00001 row under Nhat Long Footwear shows Revenue (Untaxed) equal to its confirmed sales order’s untaxed total in VND, and Cost equal to its posted vendor bills - including 96,200,000 VND (USD 3,700 at 26,000) once ONE Line’s ocean freight bill is posted.
Open the same way. Change Group By from Sale Person to Sale Person + Date (month) as a cross-check.
Tip
This step is done when: the total across all salespeople for the period matches the total shown by Profit by Customer for the same period - if it does not, a filter (Date or Delivery Status) differs between the two views.
Look up one shipment with Shipment Profitability
Use this report instead of the two above when you need one specific shipment, for example to reconcile a customer dispute.
Go to . Type the shipment’s name in the search box, then switch to the Pivot view.
Note
This action only opens in Graph and Pivot - there is no List view here, even though a list layout exists in the database. Use Group By > Shipment on the Pivot view to read one row per shipment instead of looking for a list.
Tip
This step is done when: searching SHP/26xx/000nn returns exactly one pivot row, with the same Revenue (Untaxed) and Cost as the Nhat Long Footwear row above.
Split profit by Shipment Role for a consolidated shipment
An LCL master and its houses each carry their own revenue and cost - reading only the master hides what each individual customer actually earned or cost the company.
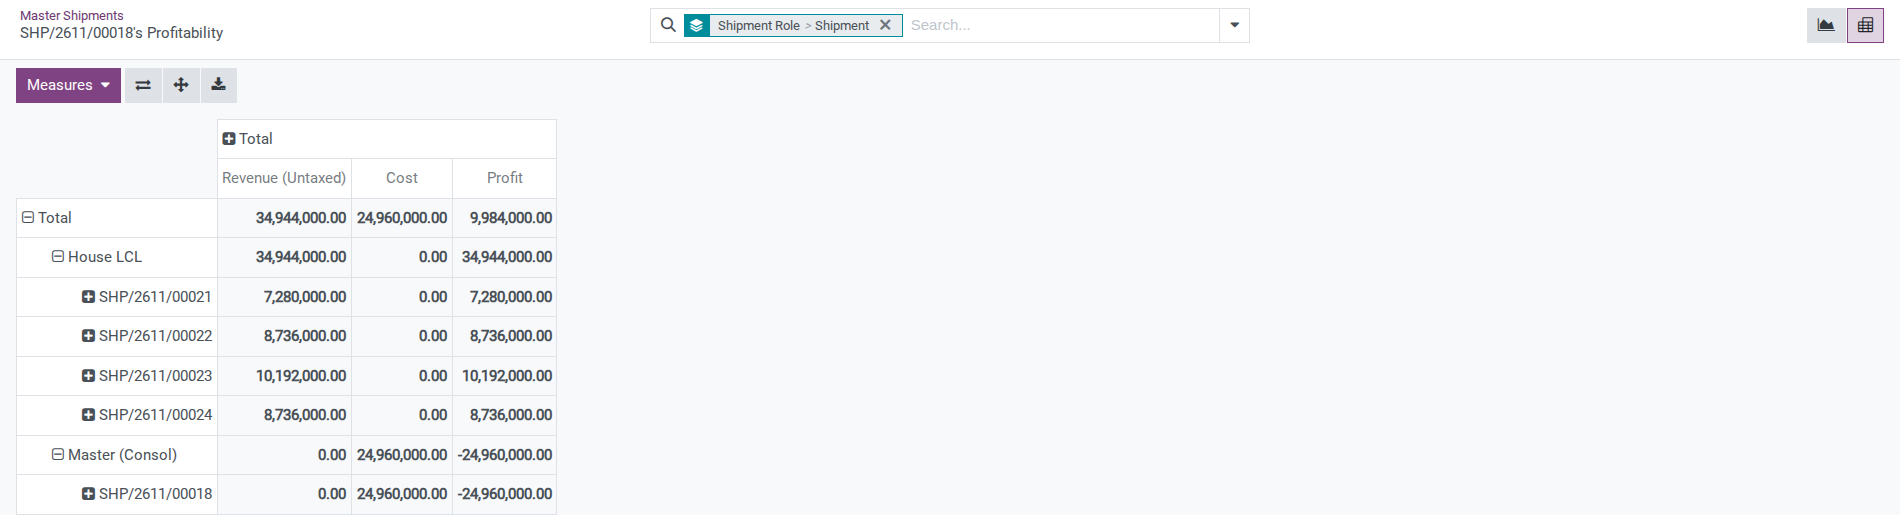
To review one master together with its houses, open and switch to Kanban. Open the menu on the master’s card and select Profitability. Switch to Pivot, then group by Shipment Role and Shipment. This action includes the selected master and its houses, so other shipments do not change the totals in your comparison.
Note
The Master (Consol) row and its 4 House LCL rows are 5 independent lines here - adding them together does not double-count anything, but this is not the same figure as the combined profitability panel on the Master’s own form (see Record charges, invoice the customer, and bill vendors), which is a different, pre-summed view.
Tip
This step is done when: grouping by Shipment Role on the import master shows exactly 1 Master (Consol) row plus 4 House LCL rows for Sao Mai, Dong Do, Thanh Cong and Viet Han - no row missing, none merged.
Read Top Routes (Shipment Routes)
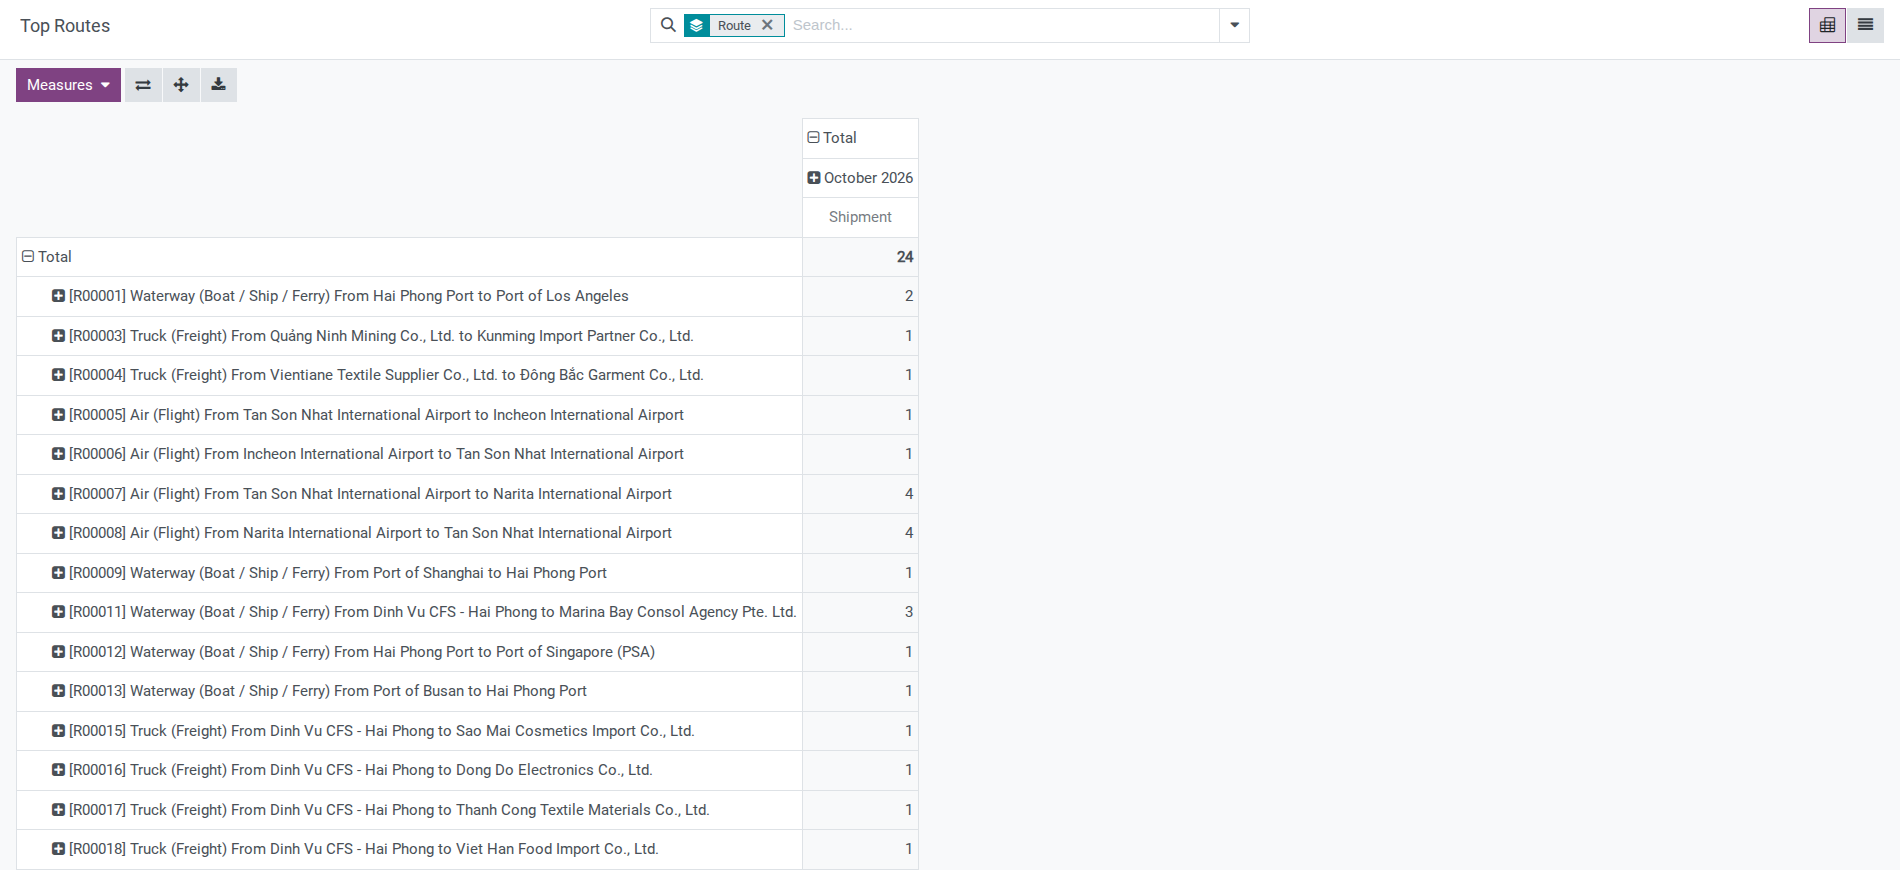
Use this report to see which route is running the most shipments, for example before negotiating a rate with a carrier - not to count containers or volume.
Go to (the action’s window title reads Top Routes).
Note
Each row here counts a leg carrying a route, not a container or a CBM figure. A route with many rows means many transport legs have used it, not that it necessarily moved the most cargo.
Tip
This step is done when: the route Hai Phong Port -> Port of Los Angeles appears with at least 1 entry, matching the Nhat Long Footwear shipment’s main carriage leg.
See also
Record charges, invoice the customer, and bill vendors - the real-time buy and sell figures.
Decide which report to open
Option |
Use when |
What changes |
|---|---|---|
Profit by Customer / Profit by Salesperson, Pivot pre-filtered |
A periodic (weekly/monthly/quarterly) commercial or management review |
Fast aggregate numbers, no per-shipment detail |
Shipment Profitability, Group By Shipment |
You need one specific shipment - reconciling a customer dispute or an internal query |
You search and group by hand; no customer filter is pre-set |
Choose Profit by Customer or Profit by Salesperson for an aggregate commercial review; use Shipment Profitability when investigating one shipment. To reconcile a difference, compare the report with that shipment’s charge lines and the related posted vendor bills, then ask Accounting to review any unresolved variance.
Known limitations
Report |
What Viindoo does today |
What you do instead |
|---|---|---|
Shipment Profitability, Profit by Customer, Profit by Salesperson |
Only Graph and Pivot views open, even though a List view exists in the database |
Use Pivot with Group By > Shipment to see one row per shipment |
All four reports |
Cost and Revenue follow accounting status (Posted bill, confirmed order), not the real-time figures on the Charges tab |
Read the Charges tab of the shipment itself for a real-time Gross Profit |
Troubleshooting
Profit on this report is higher than Gross Profit on the Charges tab
Symptom: A shipment’s Profit here is higher than its Gross Profit on the Charges tab, or Cost reads 0 despite the Charges tab already showing a Cost Price.
Cause: Revenue counts from the moment the sales order is confirmed, while Cost only counts once the related vendor bill is Posted - early in a shipment’s life, Revenue has already arrived here but Cost has not caught up yet.
Fix:
Post the shipment’s vendor bills and confirm every charge is synced to the sales order (see the order’s Logistics tab and the shipment’s route and container records).
For a number that must be correct right now, read the Charges tab instead of this report.
Total by Customer does not match total by Salesperson for the same period
Symptom: Profit by Customer and Profit by Salesperson show different totals for what looks like the same period.
Cause: The two menus only differ by their default Group By - a different Date or Delivery Status filter left active on one of them, not the other, changes the total.
Fix: open both views and align their Date filter and any status filter before comparing totals.
The Shipment Role column or filter is missing
Symptom: No Shipment Role column or filter appears on any of the four reports.
Cause: Freight Sale - Consolidation Profitability Bridge only installs automatically when both Freight Sale and Freight Consolidation are active - a forwarder that does not run LCL consolidation never installs it.
Fix:
If you do run LCL consolidation, check Apps and confirm Freight Consolidation is installed - the bridge module follows automatically.
If you do not run LCL consolidation, this is expected: every shipment is Direct and the column adds no information.
See also
Related articles
Allocate shared master costs to house shipments - how a shared master cost gets split into each house’s own Cost before it ever reaches these reports
the order’s Logistics tab and the shipment’s route and container records - keeping shipment charges and the sales order in sync, which is what feeds the Revenue side of these reports