Sales Analysis Reports
Viindoo Sales report gathers all the information recorded in the Sales app. The reports have all the data and tools to help the managers trace all the information, from overview to the most detailed. The reports can be displayed in pivot; pie, line, and bar charts in real-time, helping the manager allocate resources as well as planing the sales strategies.
Requirements
This tutorial requires the installation of the following applications/modules:
Sales Data Analysis by Sales Order
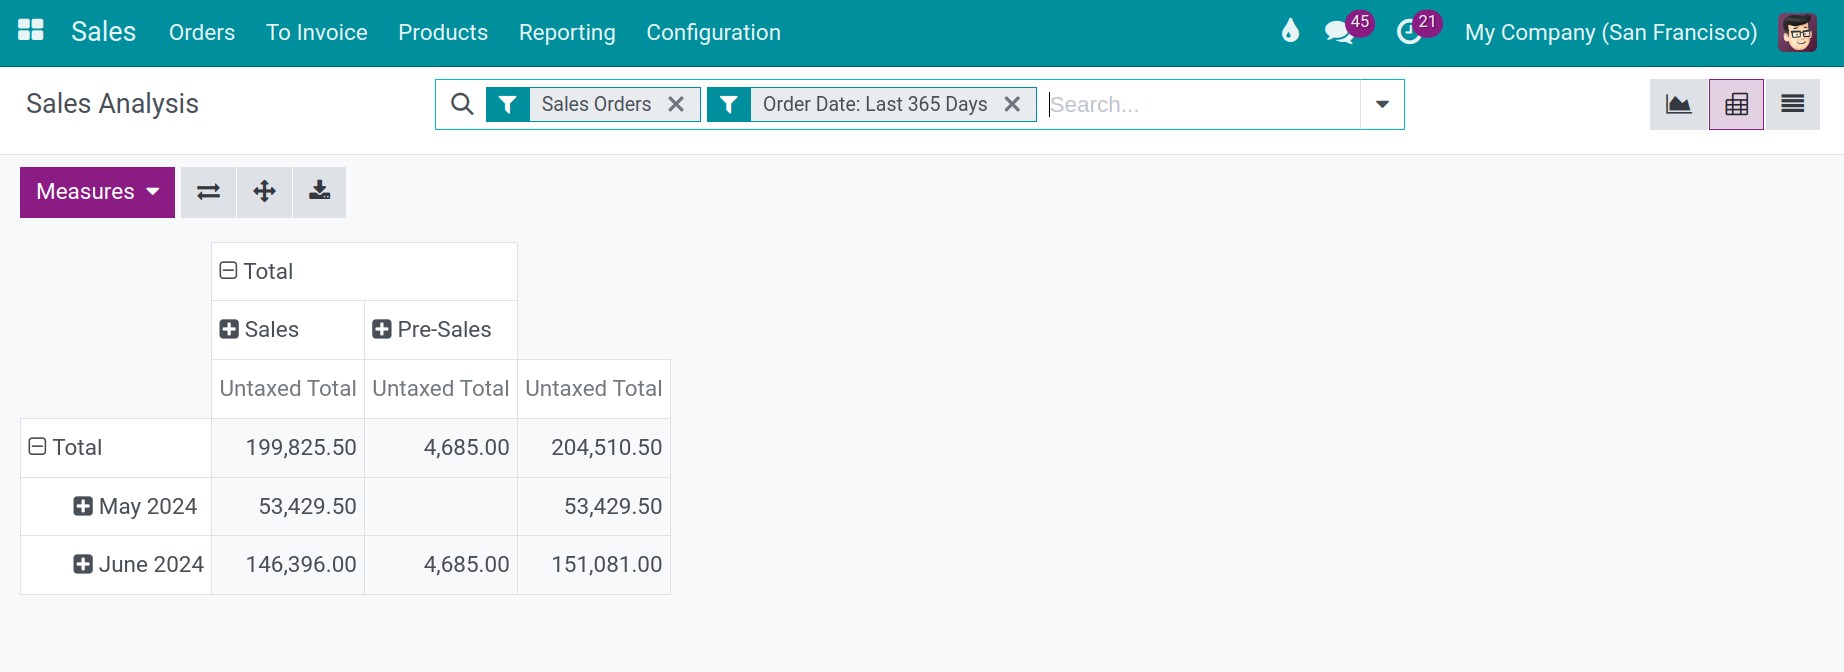
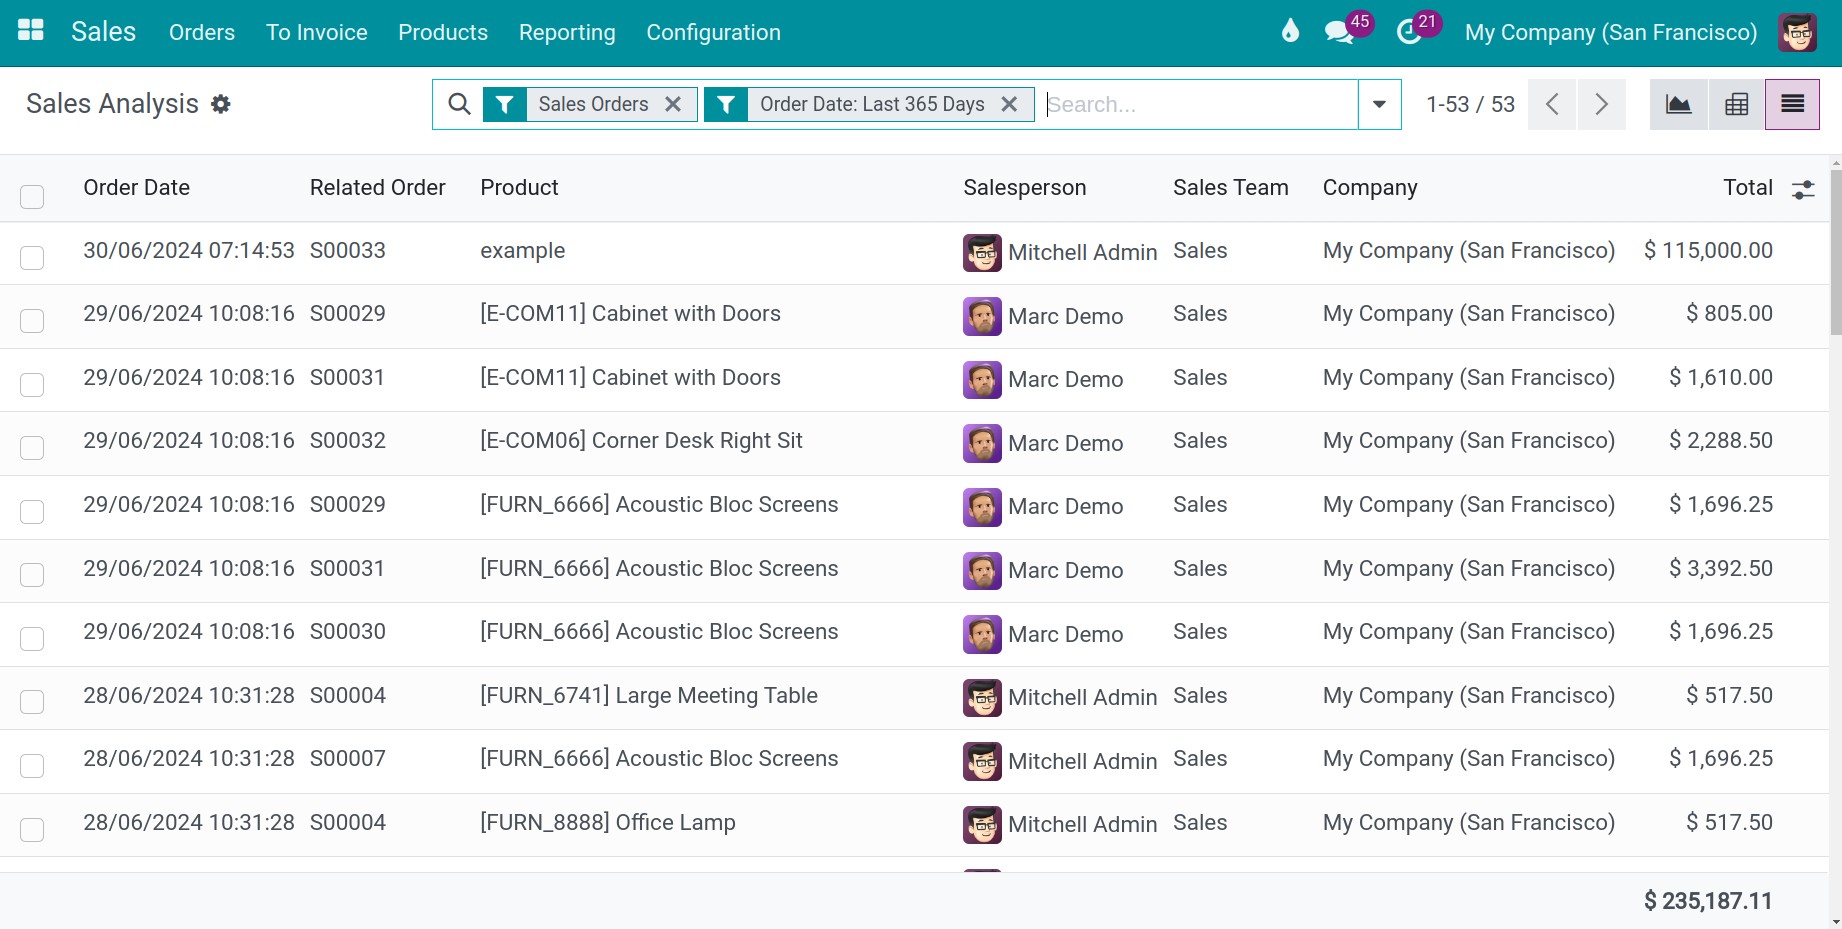
You access to Sale > Reporting > Sales. This report presents the sales order information, which is by default filtered to the last 365 days. Furthermore, you have the option to convert this data into either a pivot report or a list report.
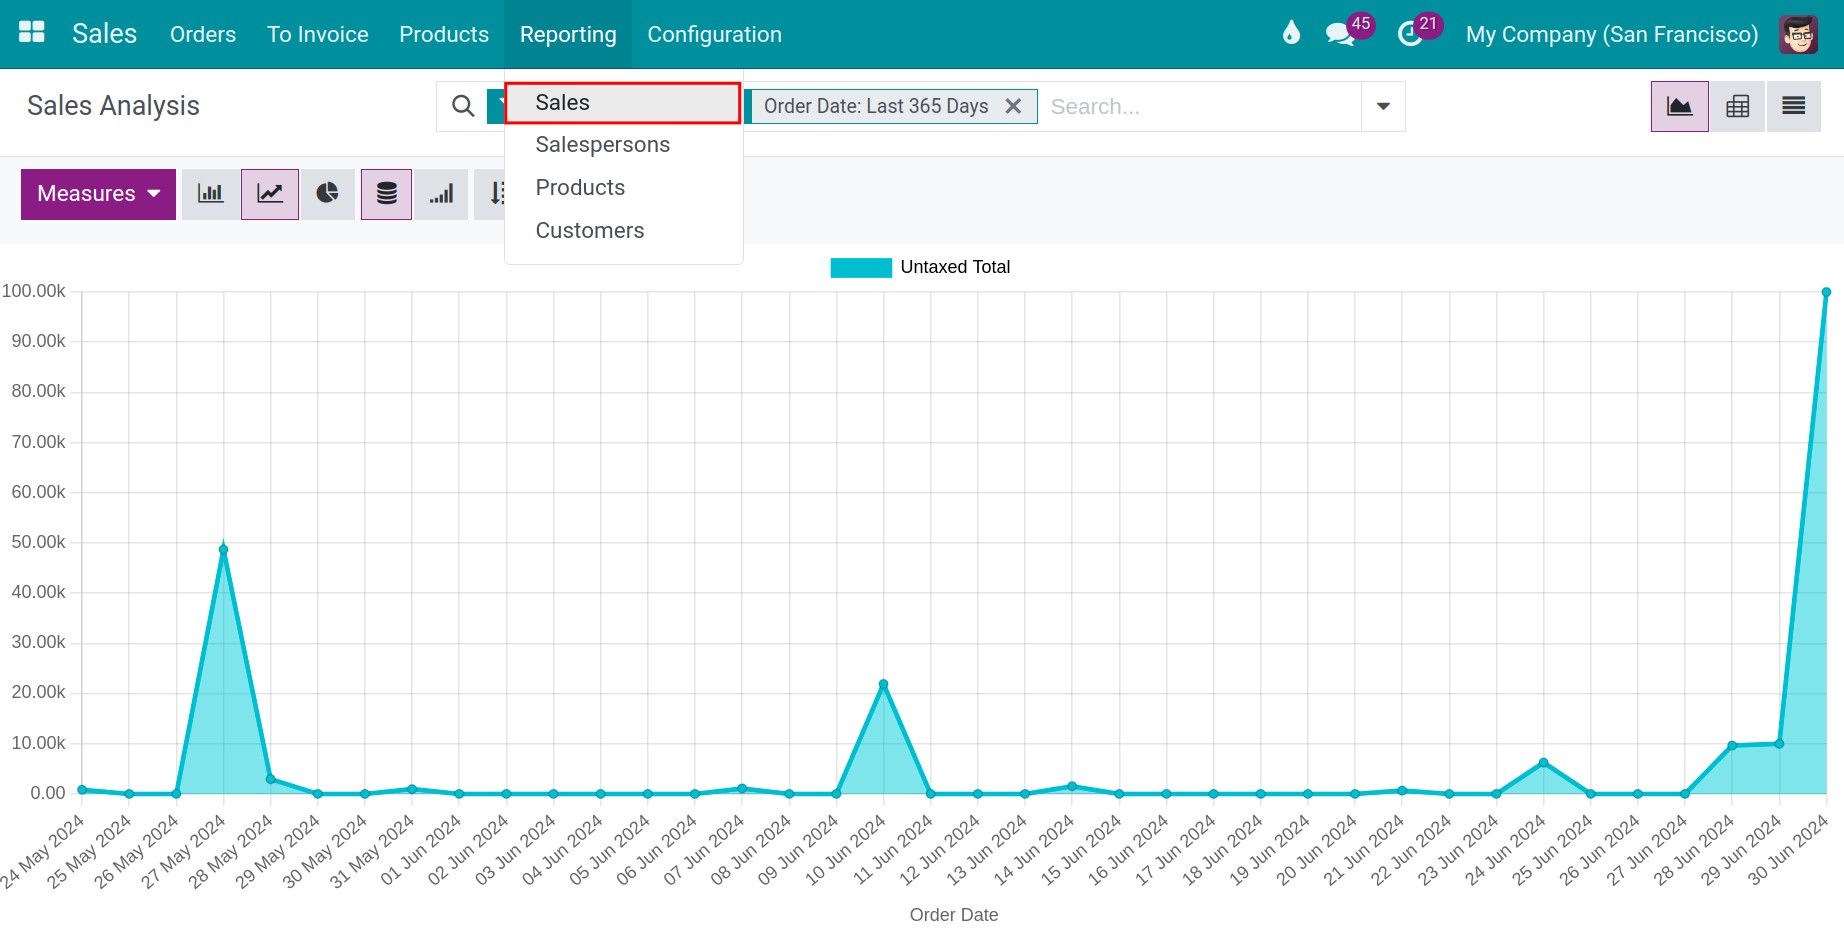
Bar, line, pie chart
You can use the features such as filter, grouping, Measures to view reports based on your desired criteria. To view the report in the form of a graph, you click on the graph icon at the top-right corner of the screen, and then click on the type of chart you want to see at the top-left corner of the screen.

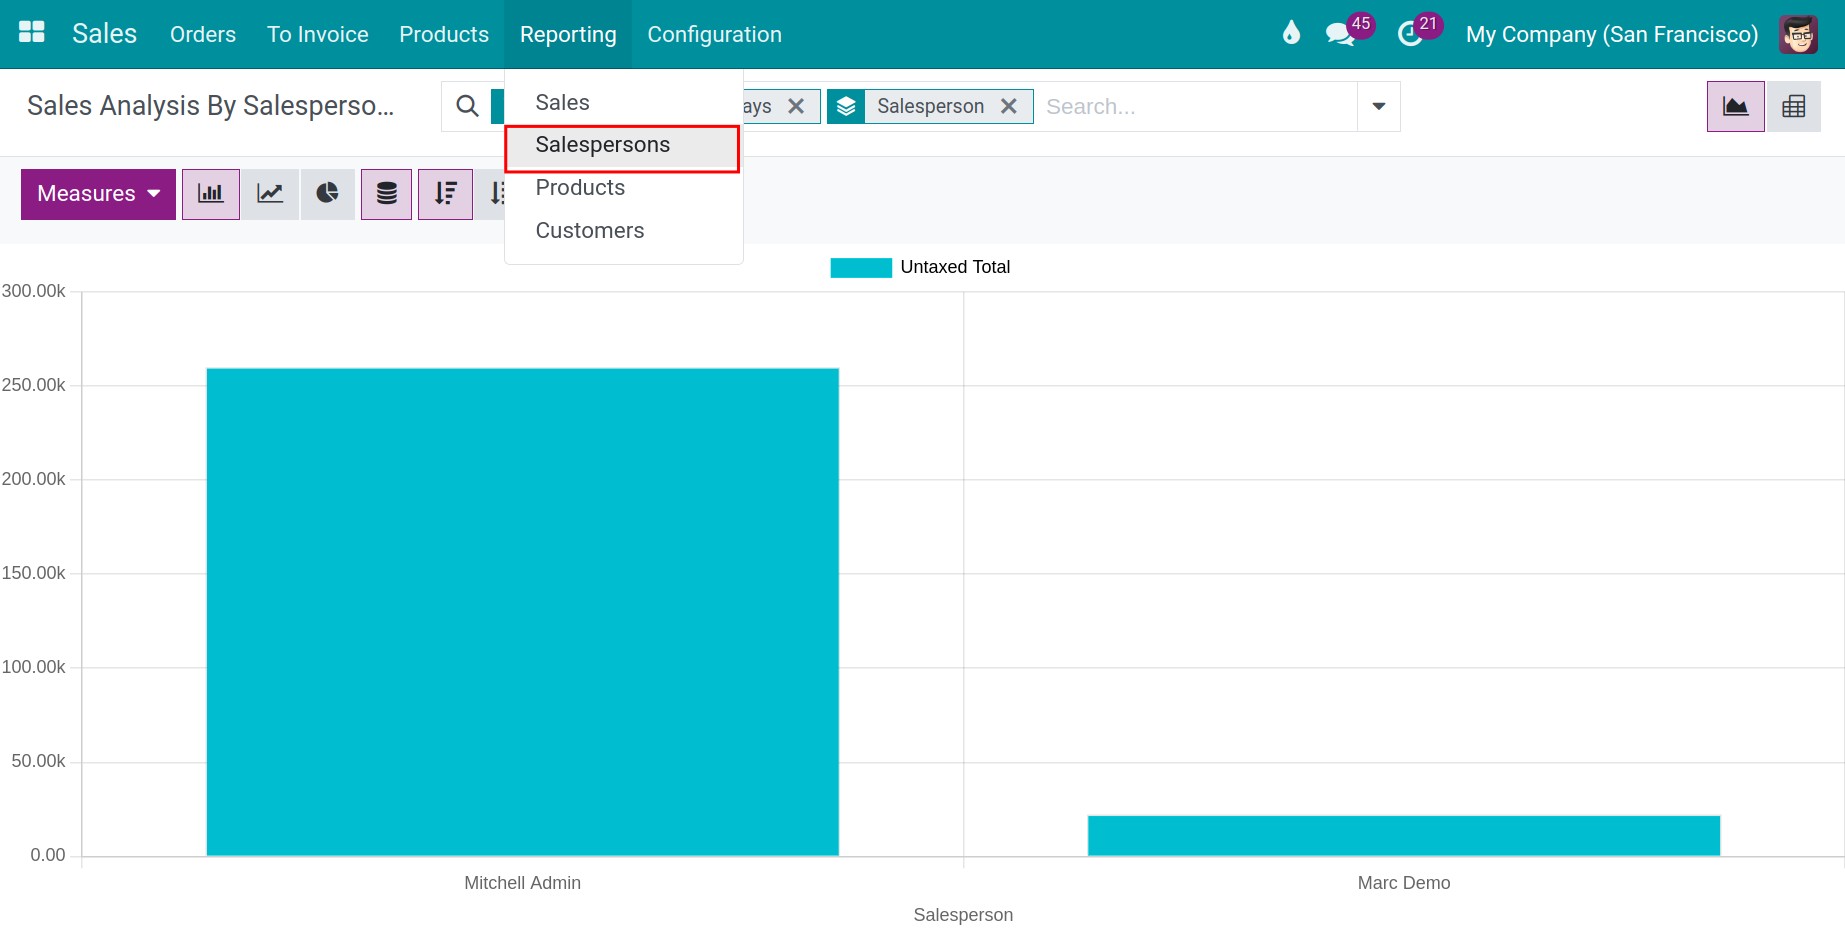
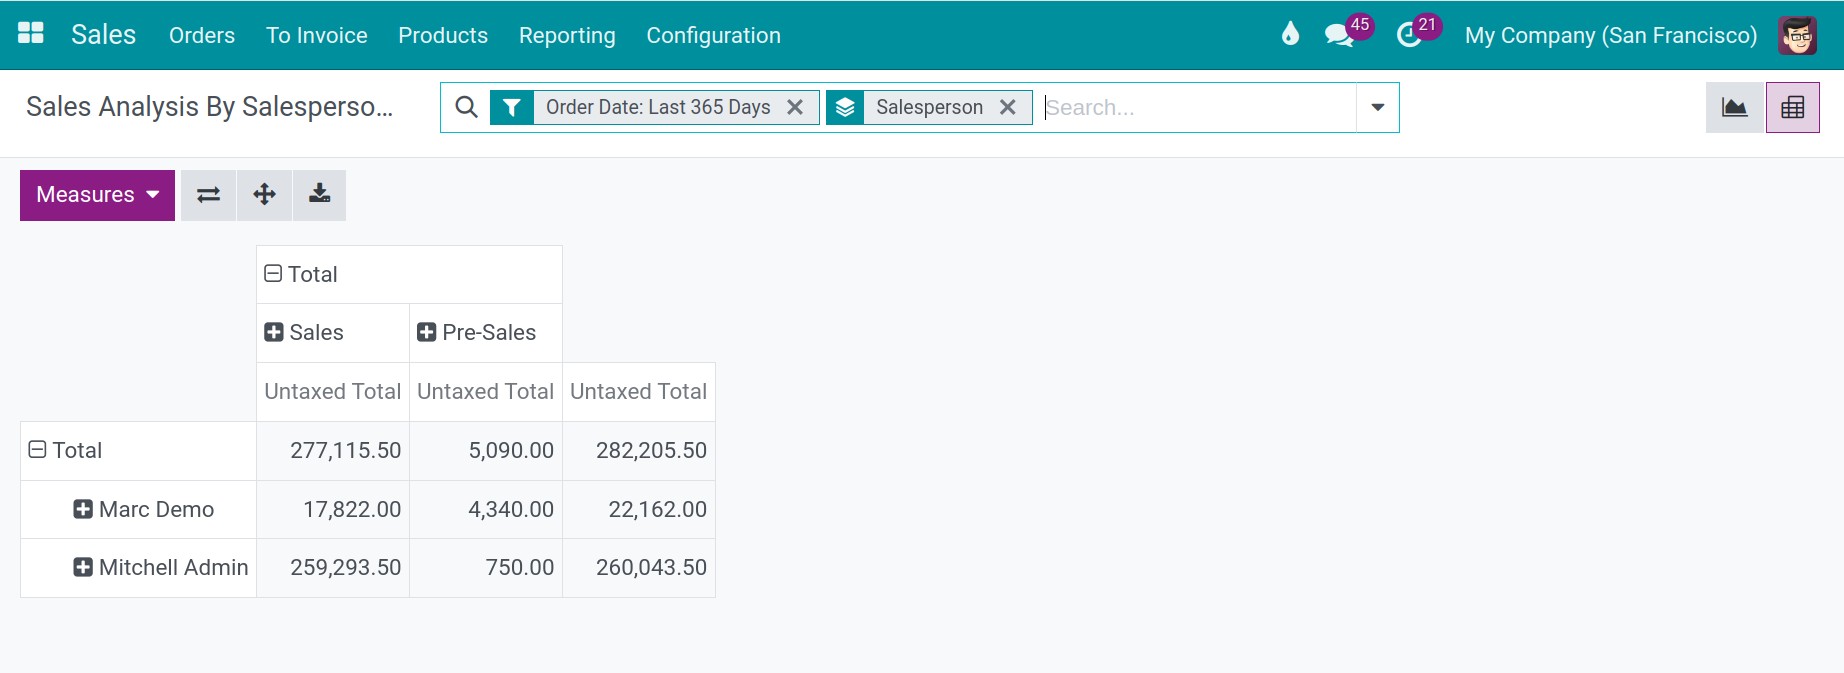
Sales Data Analysis by Sales Persons
You navigate to Sale > Reporting > Salespersons. This report provides information about your employees who are engaged in sales activities. You can filter the data by various criteria and also convert it to a pivot view.
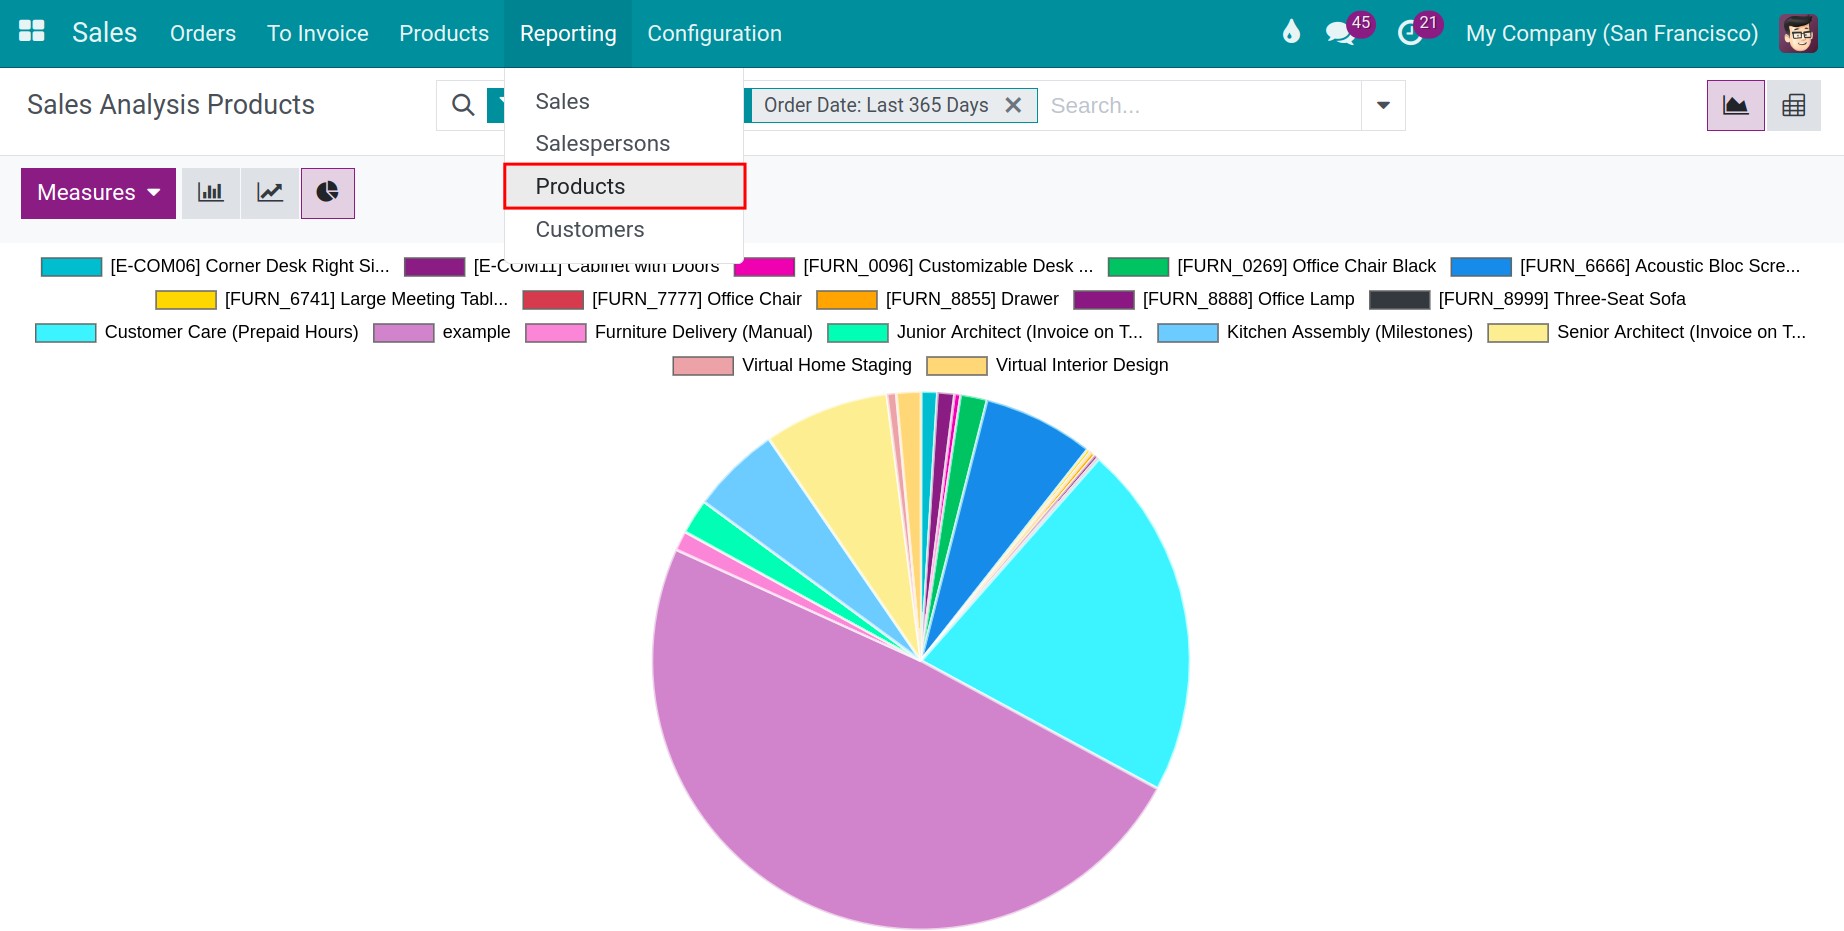
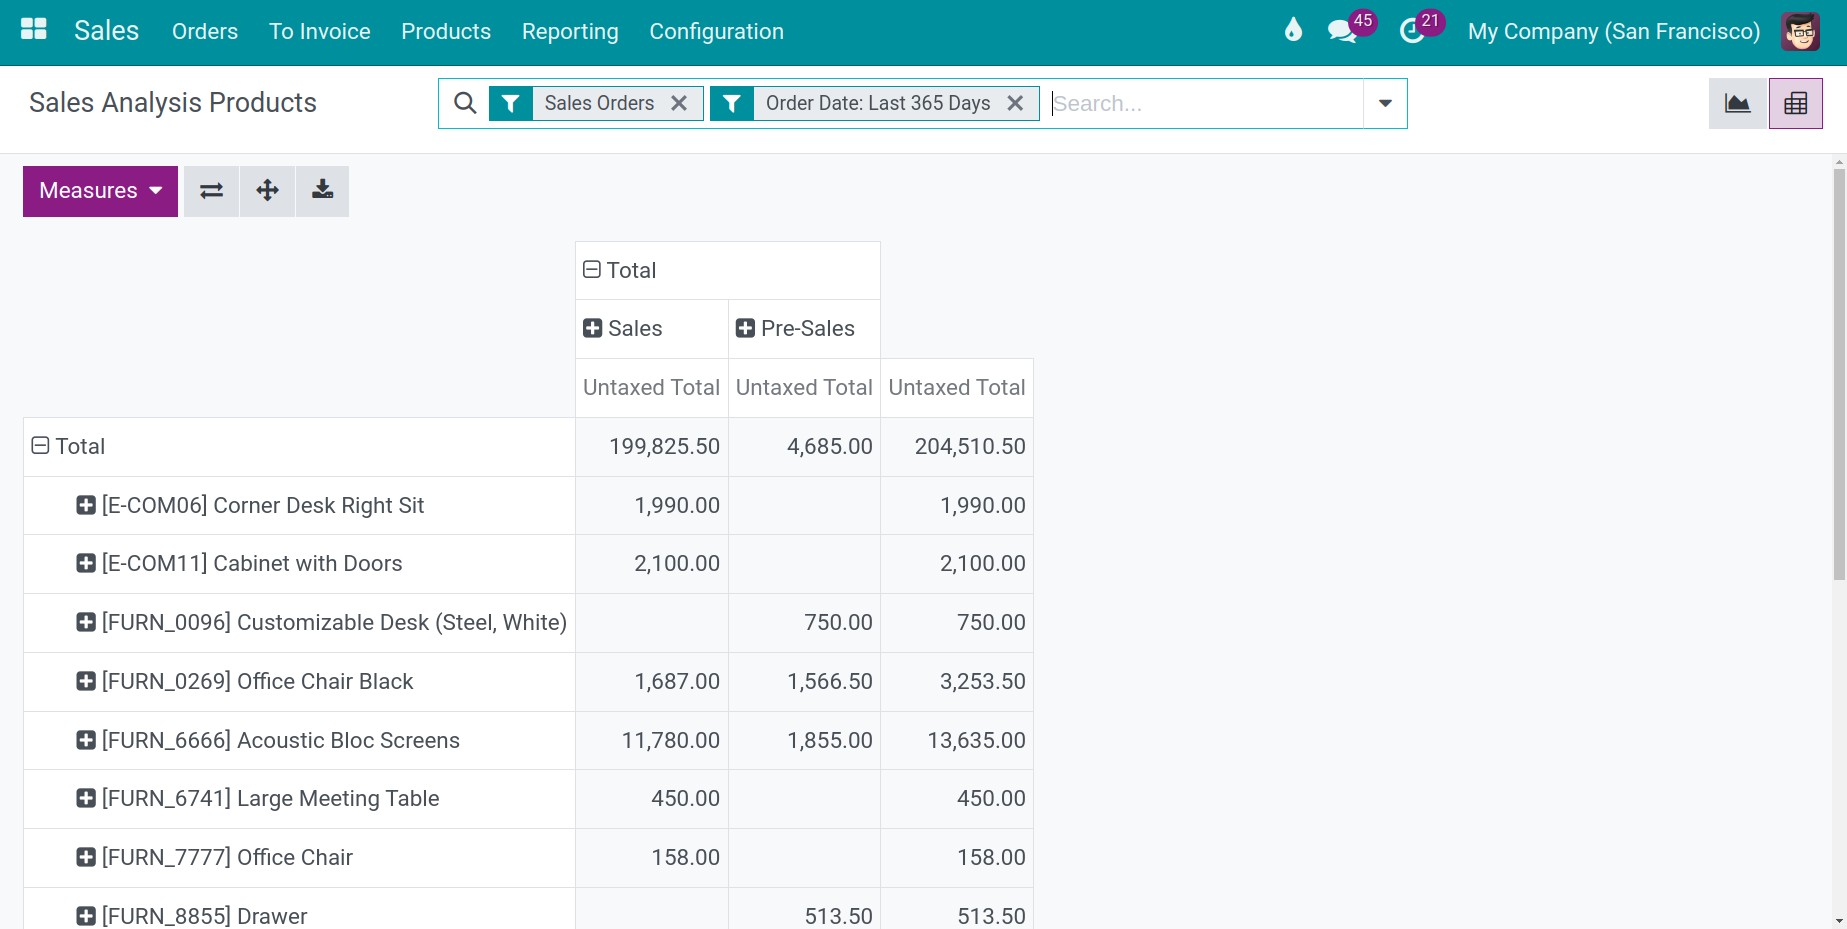
Sales Data Analysis by Products
You navigate to Sale > Reporting > Products. This report presents the number of products sold to customers. It not only helps you monitor popular products, but it also assists managers in gaining insights to grow their company.
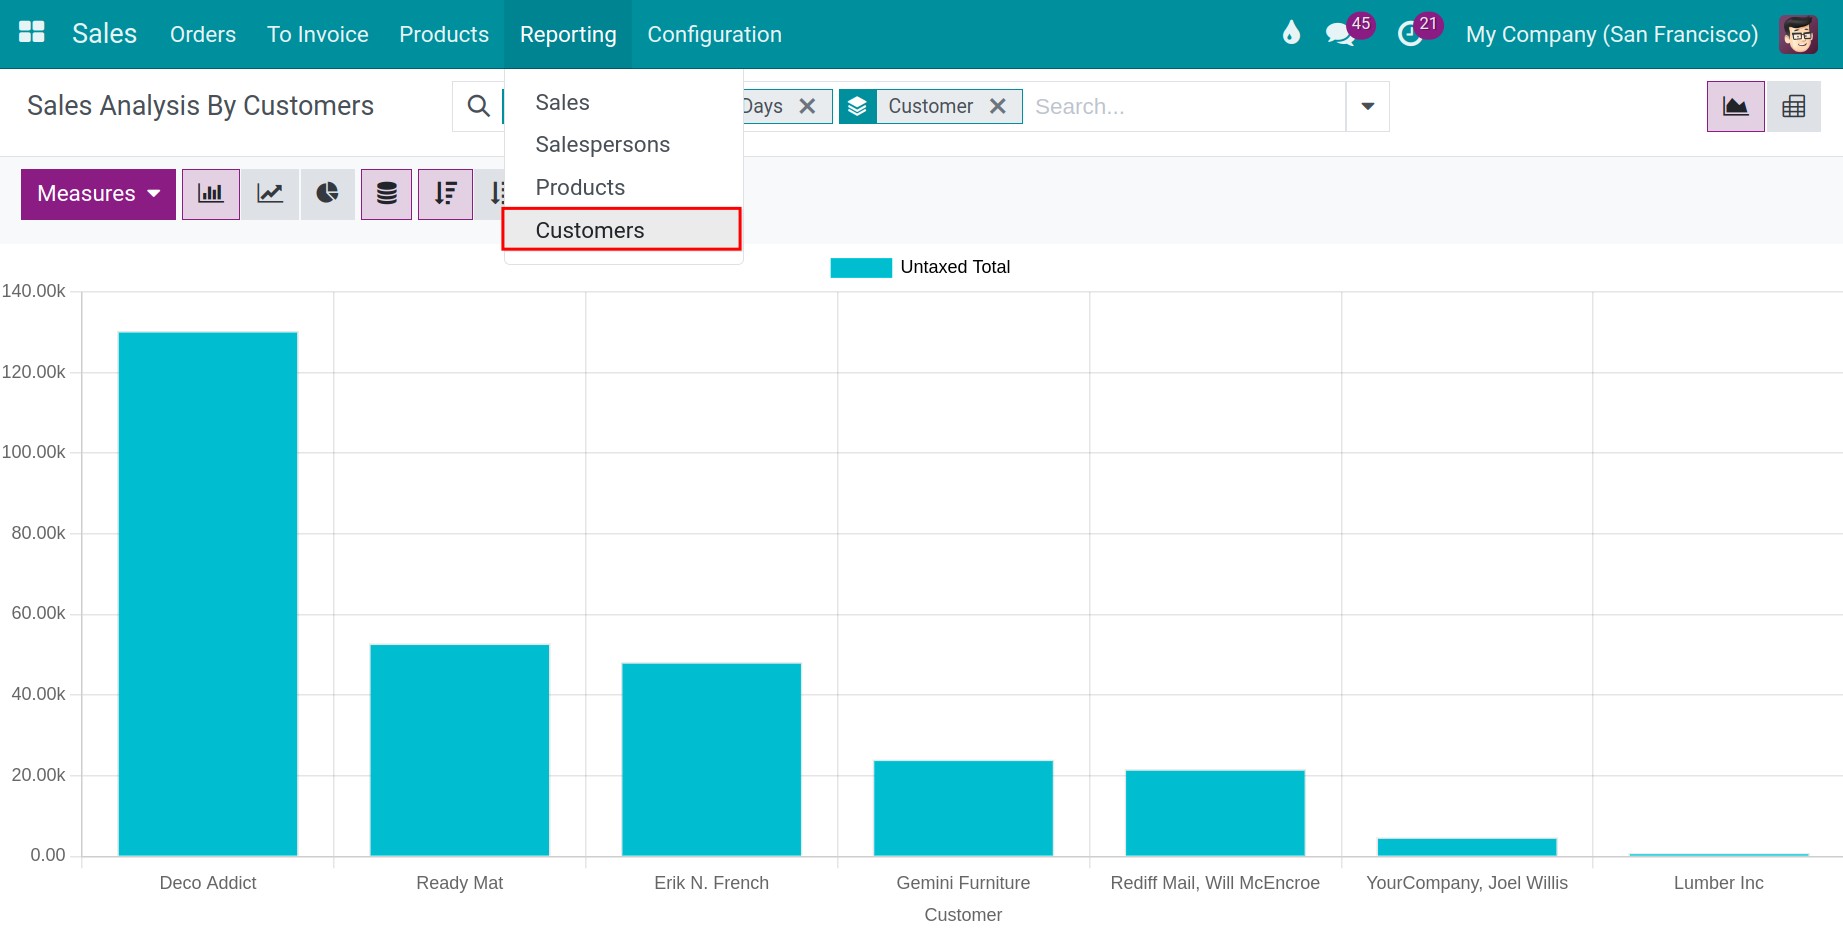
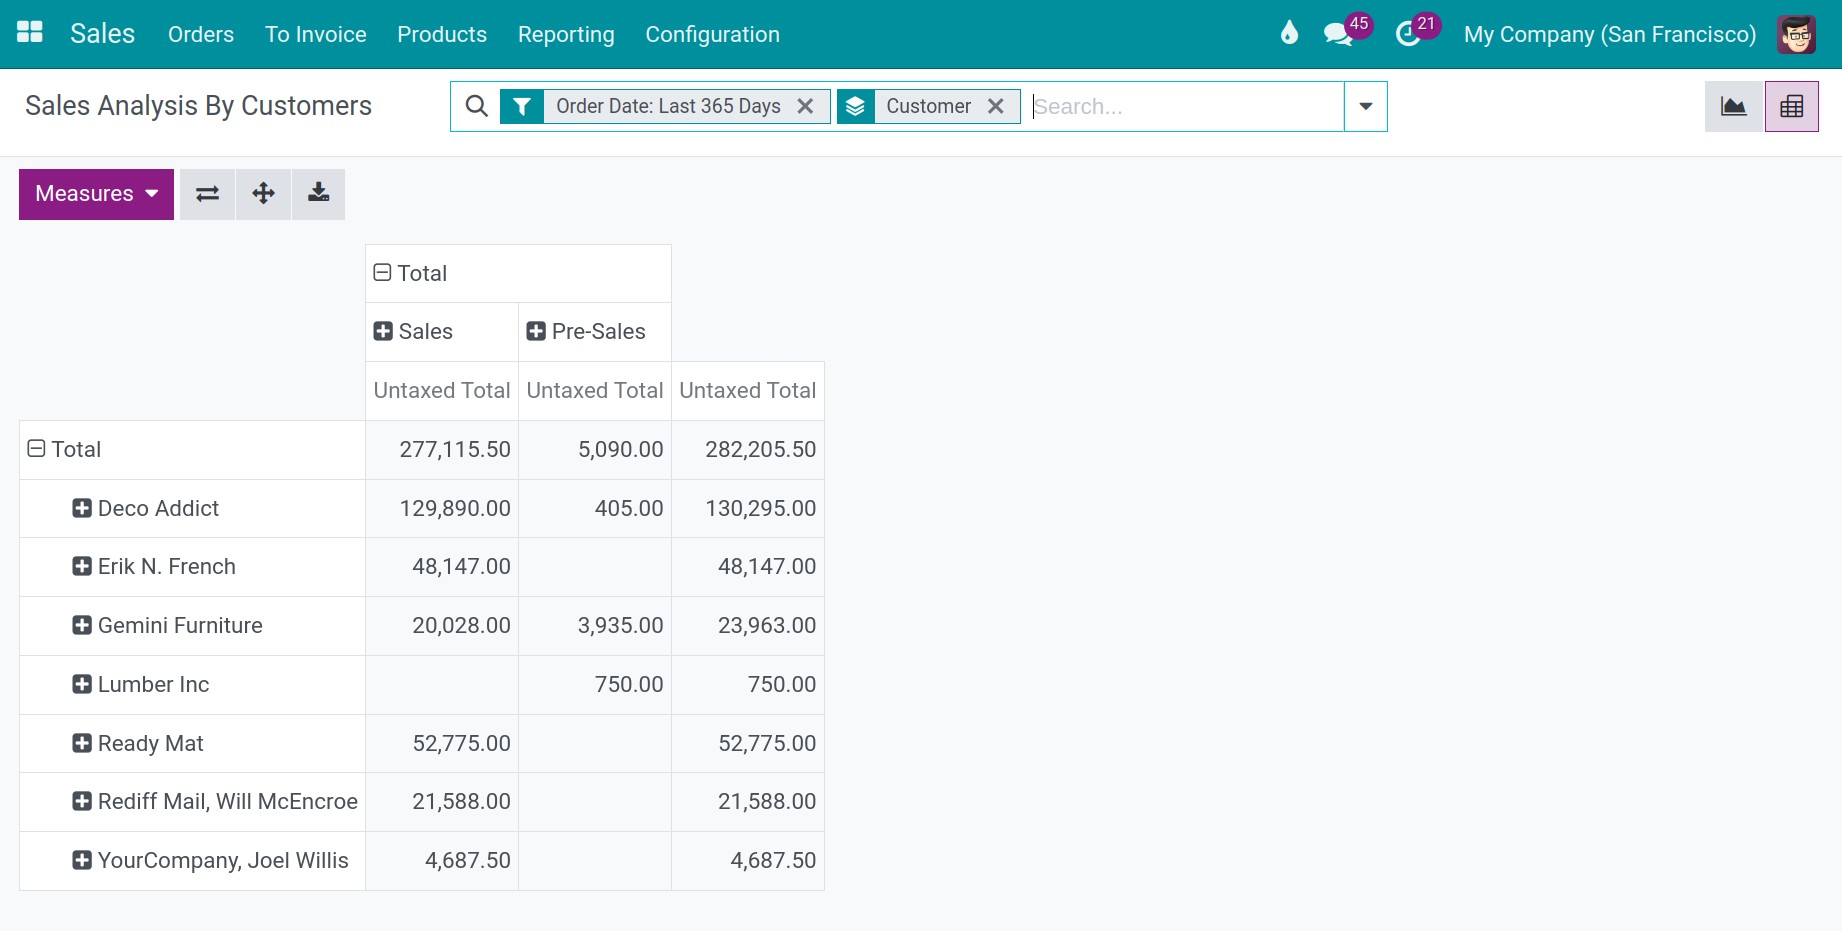
Sales Data Analysis by Customers
You navigate to Sale > Reporting > Customers. This report illustrates the number of customers who purchase your products and the total amount of money they spent. Additionally, similar to other reports, you can display this information in a pivot view.
Note
In order to use maximize features on the report interface, you can refer to How to use Filter, Groups and Search use cases and How to use Views and Reports in Viindoo. This ensure you create a high-quality report.
See also
Related article
Optional module