Recruitment Analysis Reports
To view the recruitment reportings, access to the module Recruitment, navigate to Reporting > Recruitment Analysis.
Requirements
This tutorial requires the installation of the following applications/modules:
View reports in Sankey
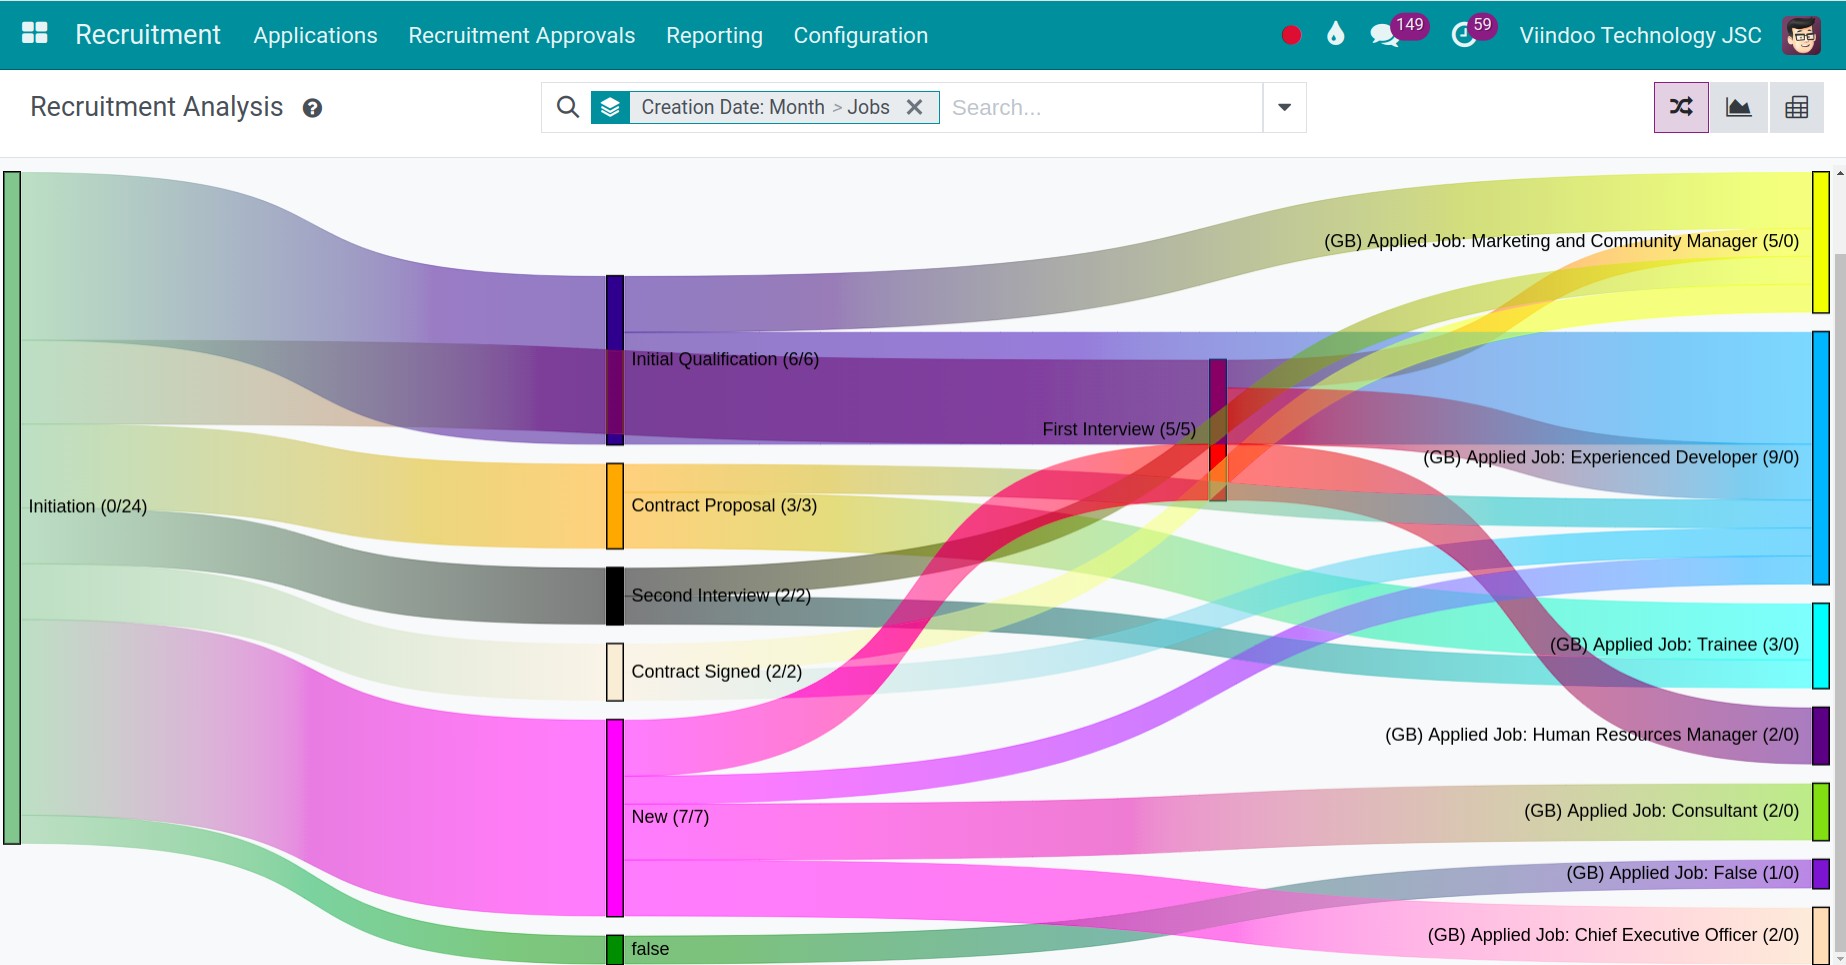
When you access the Recruitment Analysis view, the system defaults to displaying reports in Sankey mode, group by Creation Date: Month > Jobs. This display helps you get a general overview of the stages from initiation to applied jobs.
For example, we had a total of 7 candidates at the new stage. The company then successfully transitioned and hired 2 candidates for the position of Human Resources Manager, 2 candidates for the position of Consultant, 2 candidates for the position of Chief Executive Officer, and 1 candidate for the position of Experienced Developer.
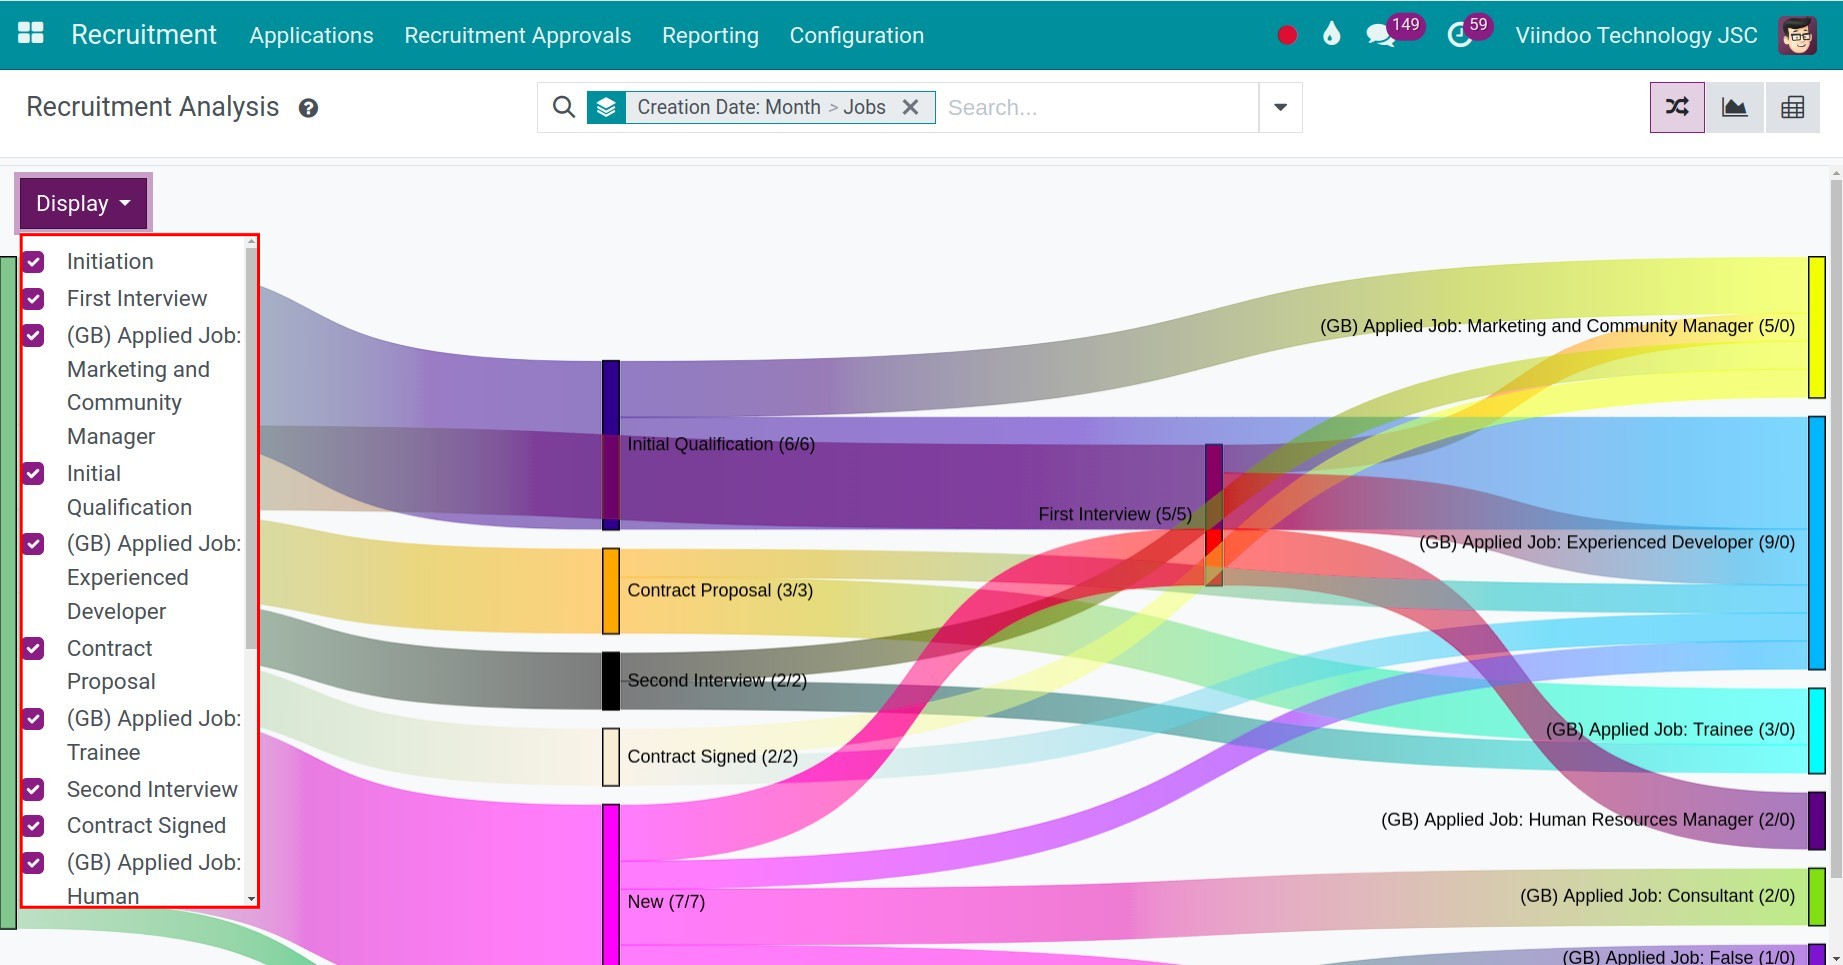
Furthermore, you can also click on the Display button to filter according to the system’s criteria.
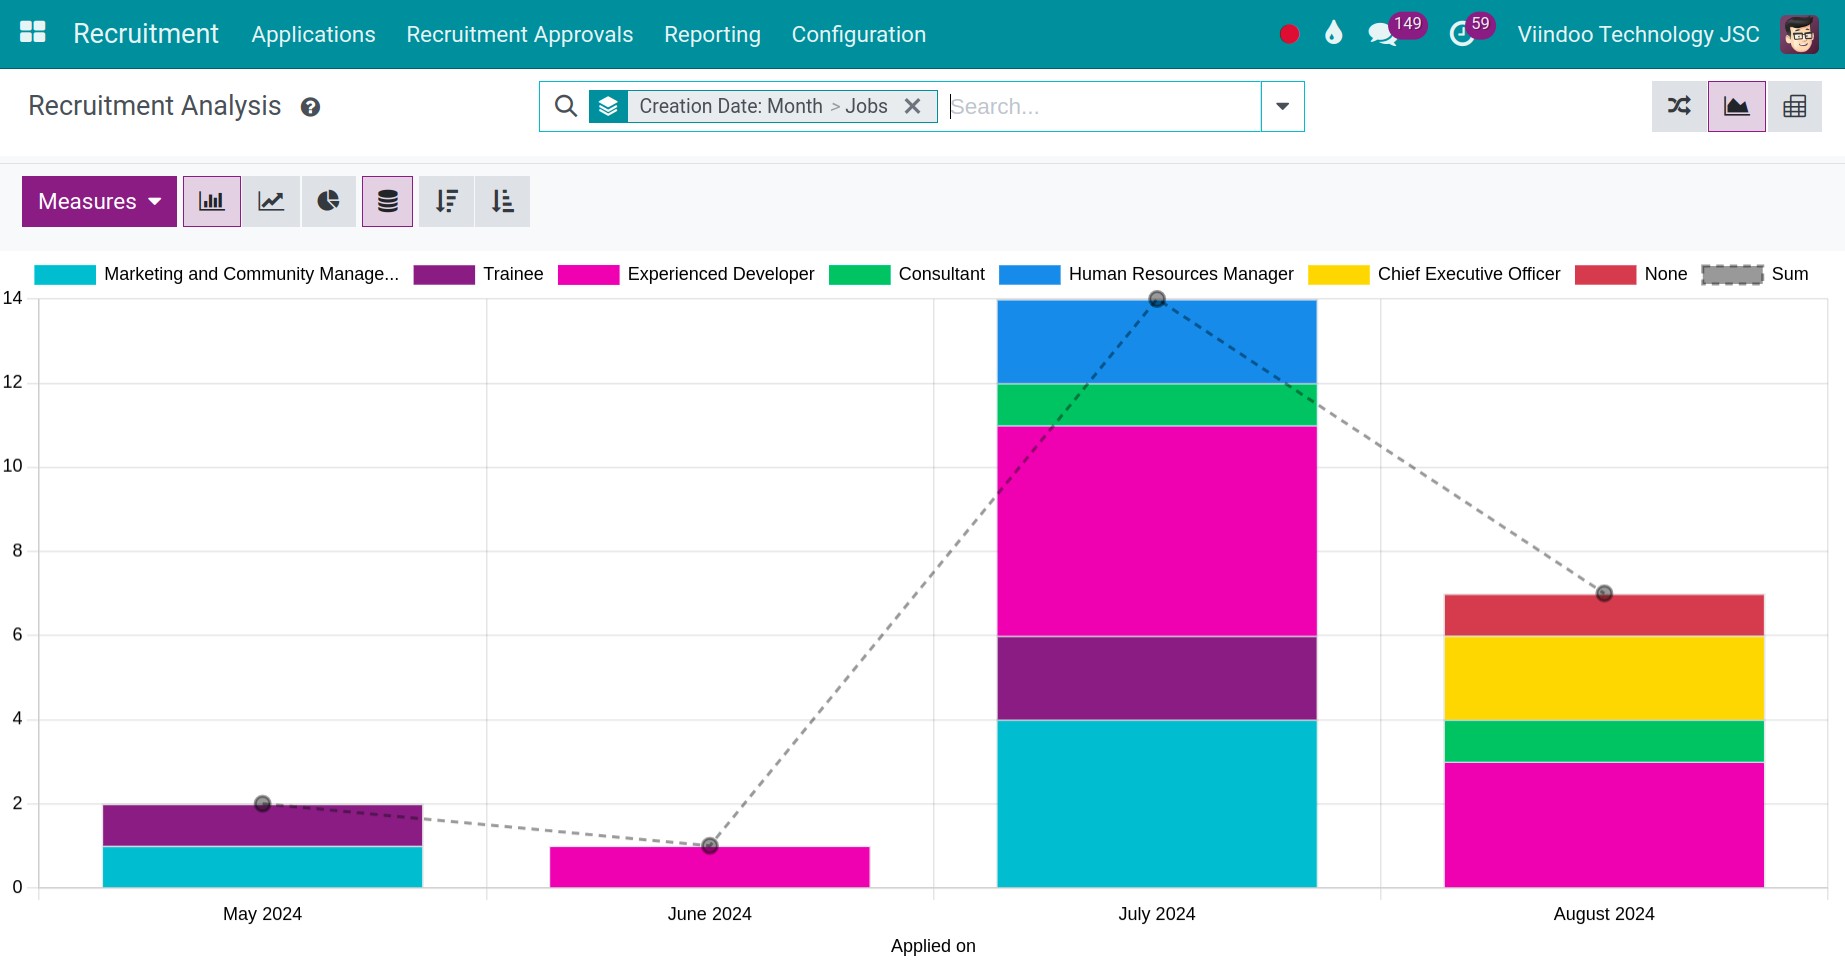
View reports in Graph
You press the Graph view icon on the right side of the interface to switch the report to Graph view. After that, you can turn off default condition to customize the report according to your needs.
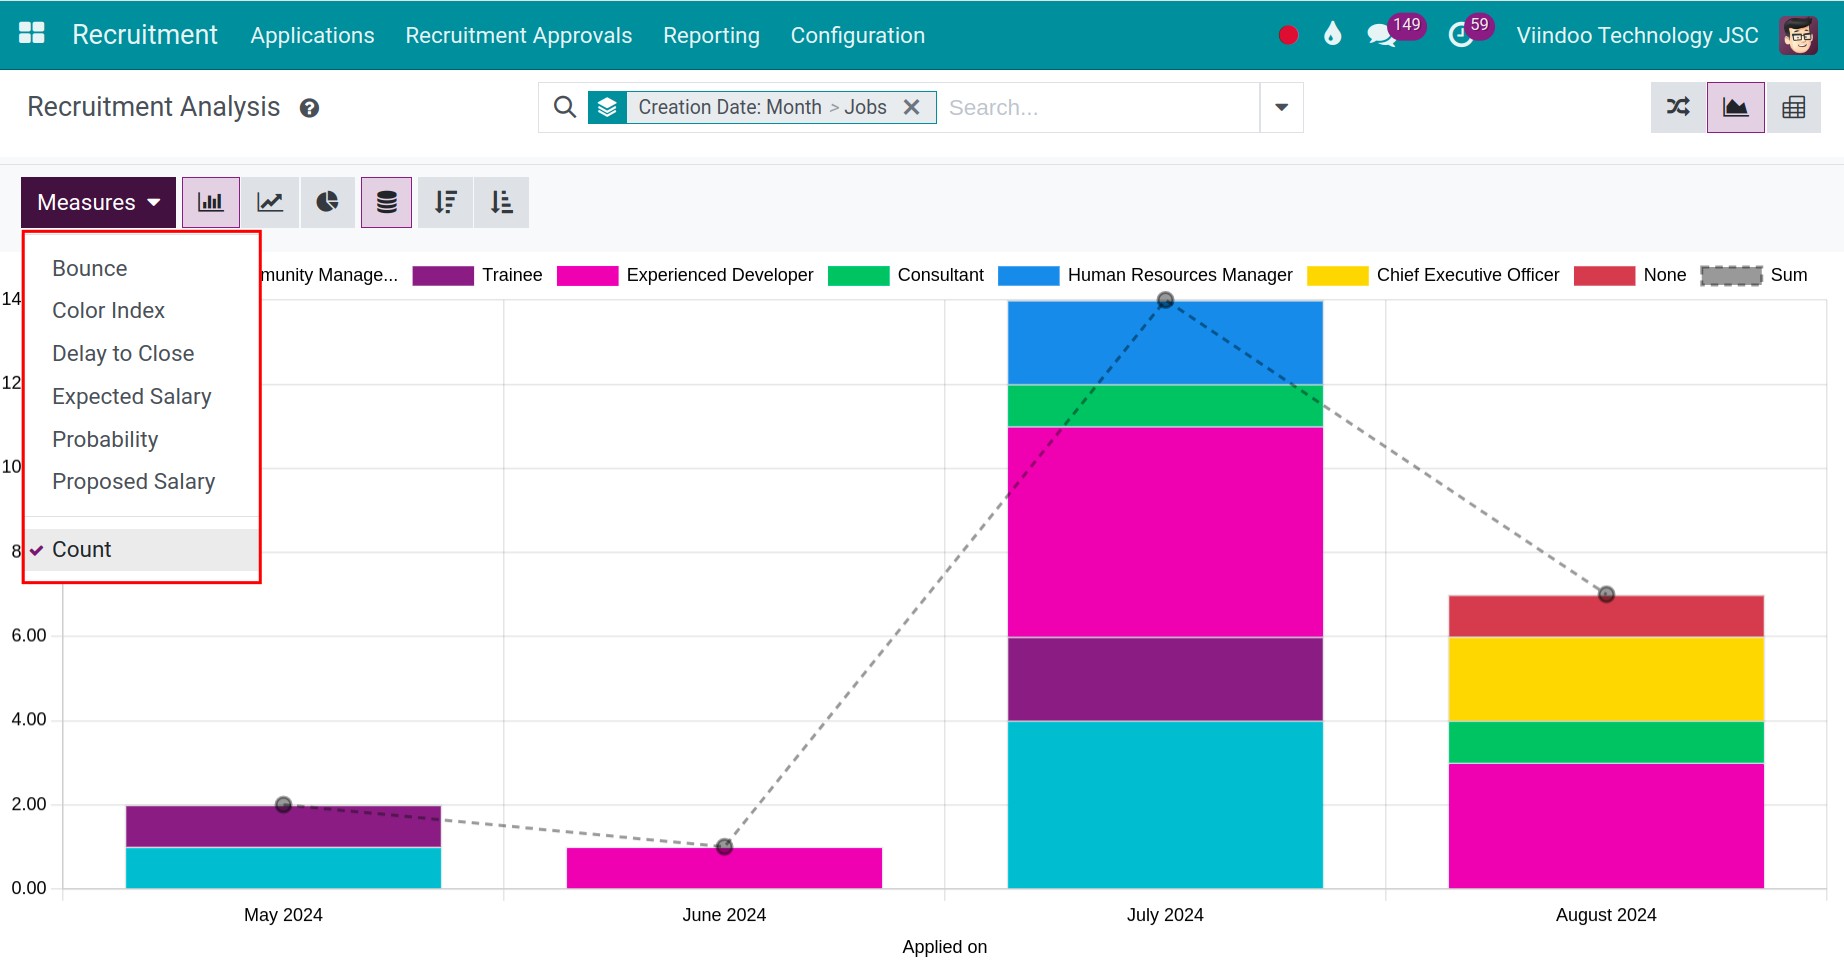
To change the value displayed on the vertical axis of the graph, use the Measures. In the list of measures, you check 1 value: Expected Salary, Proposed Salary, Count,…
To change the value displayed on the horizontal axis of the graph, you use the Filters, Group By: Department, Stage, Responsible, etc.
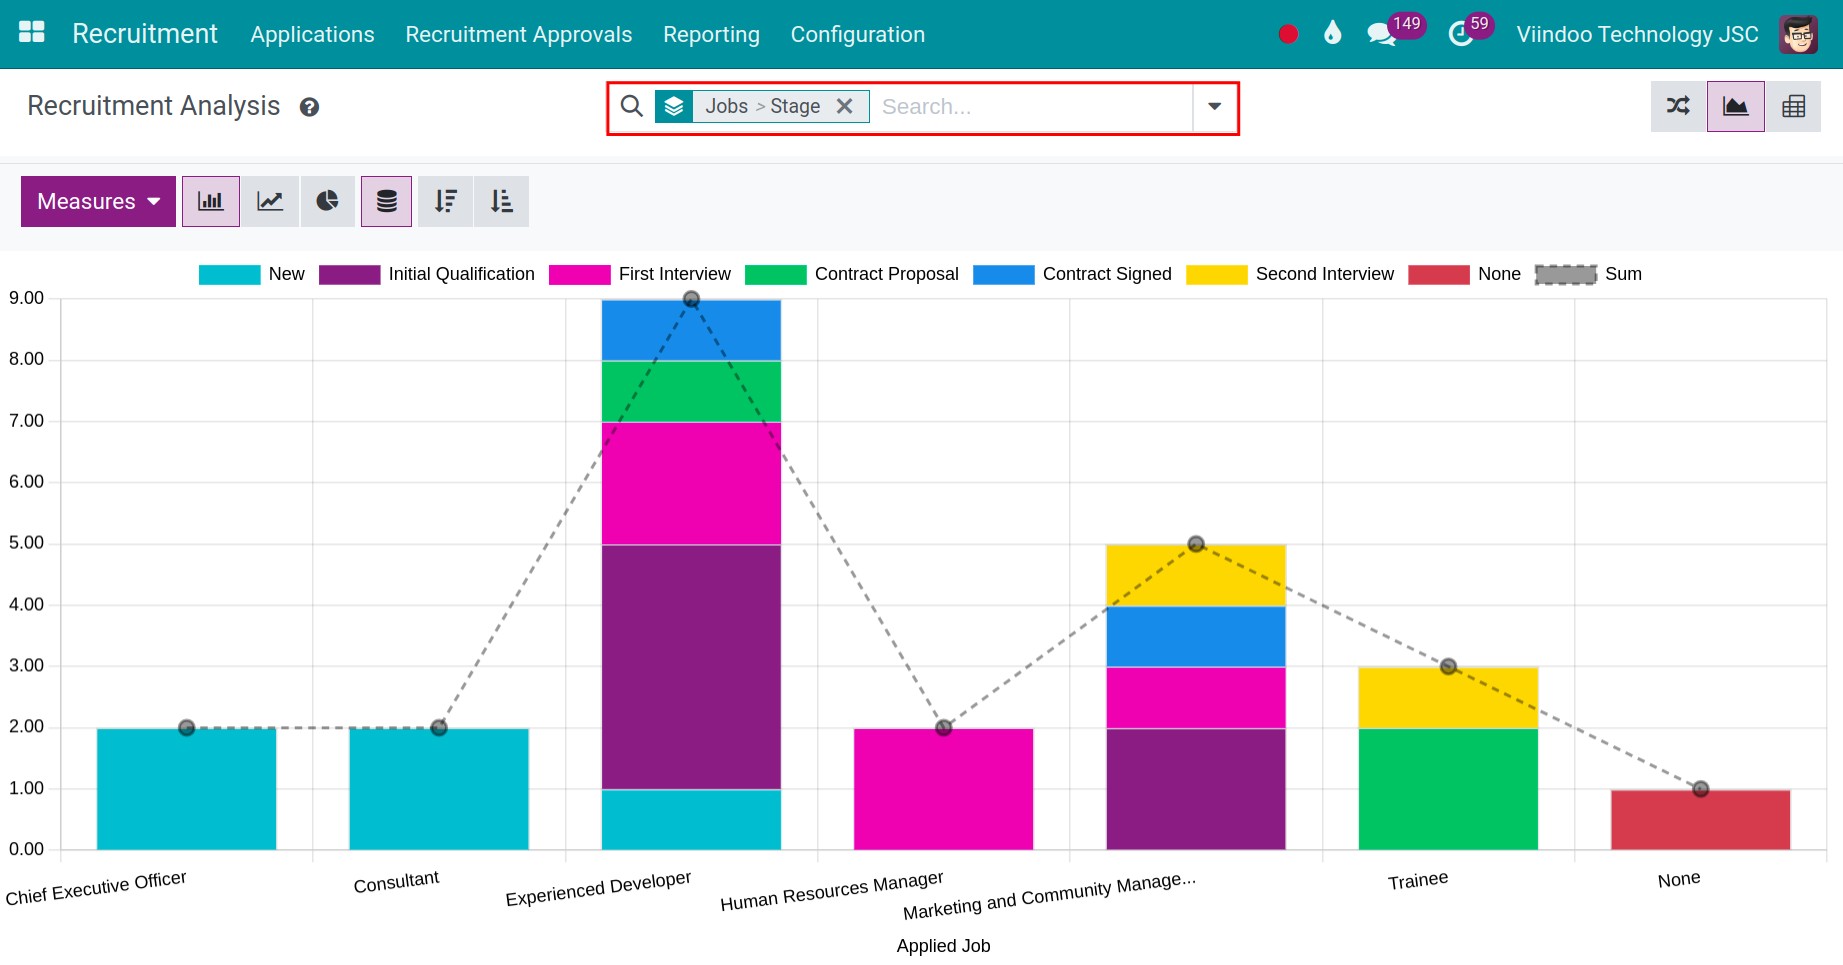
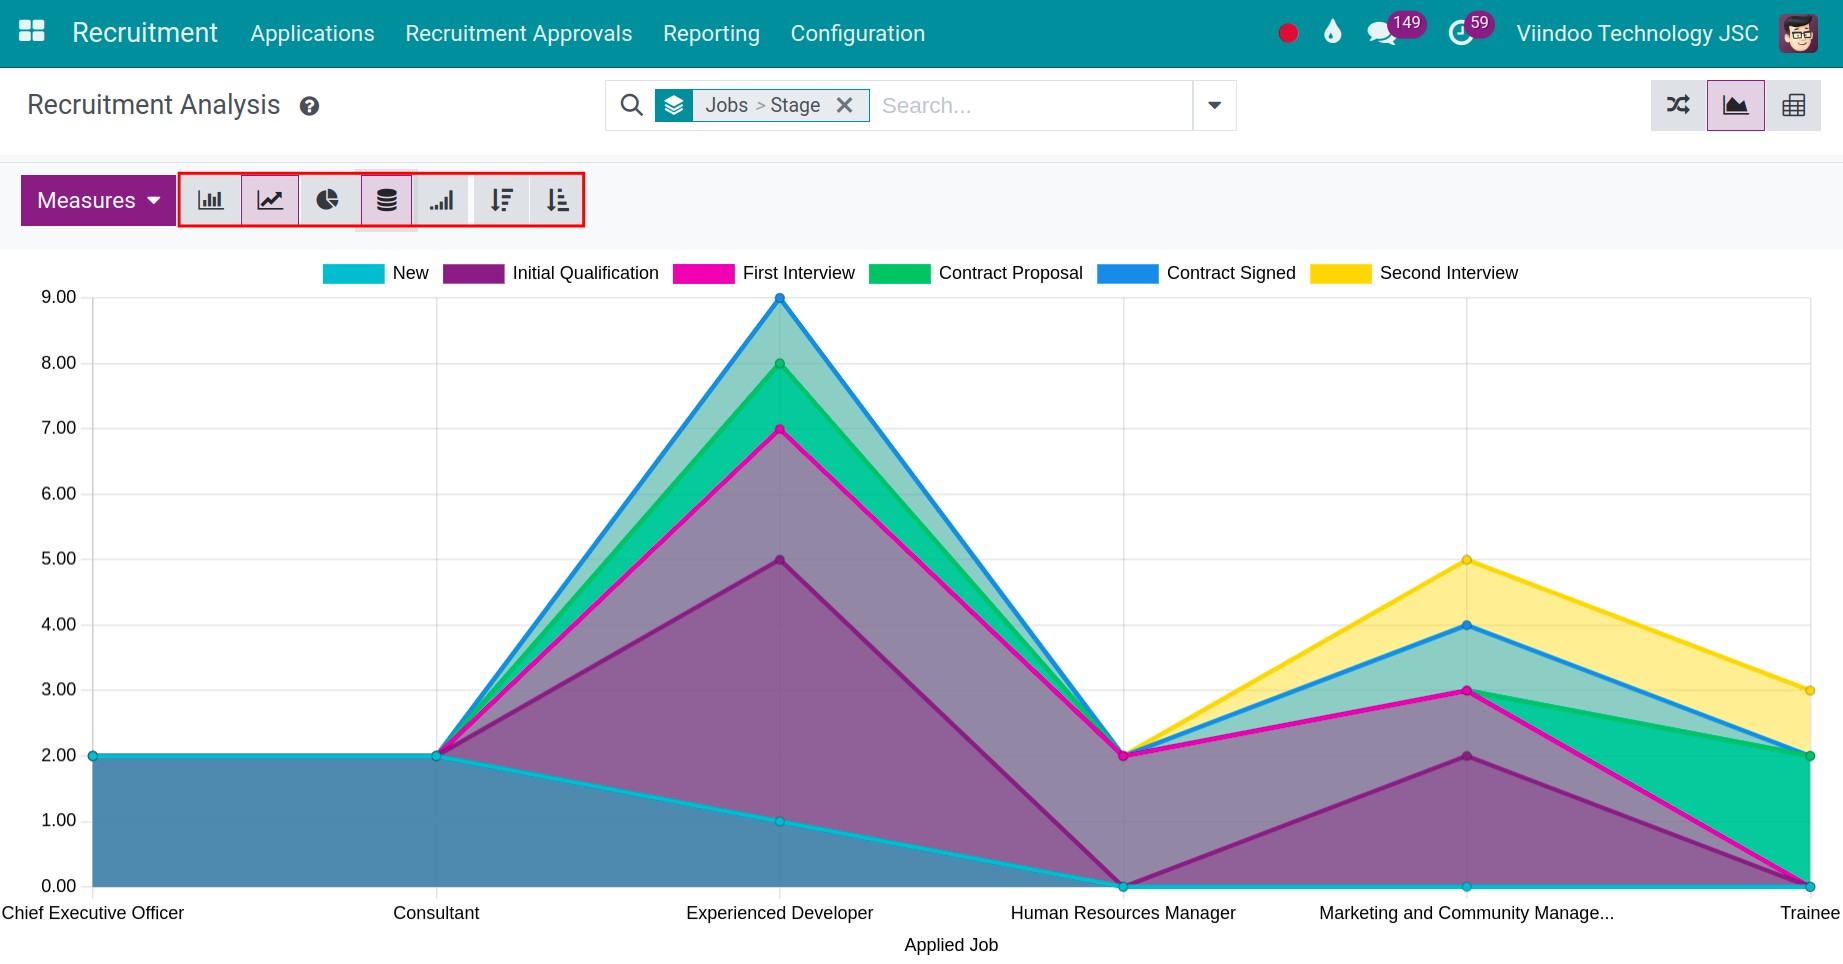
You can choose to view reports in other graph types, or by increasing/decreasing values by clicking the respective icons.
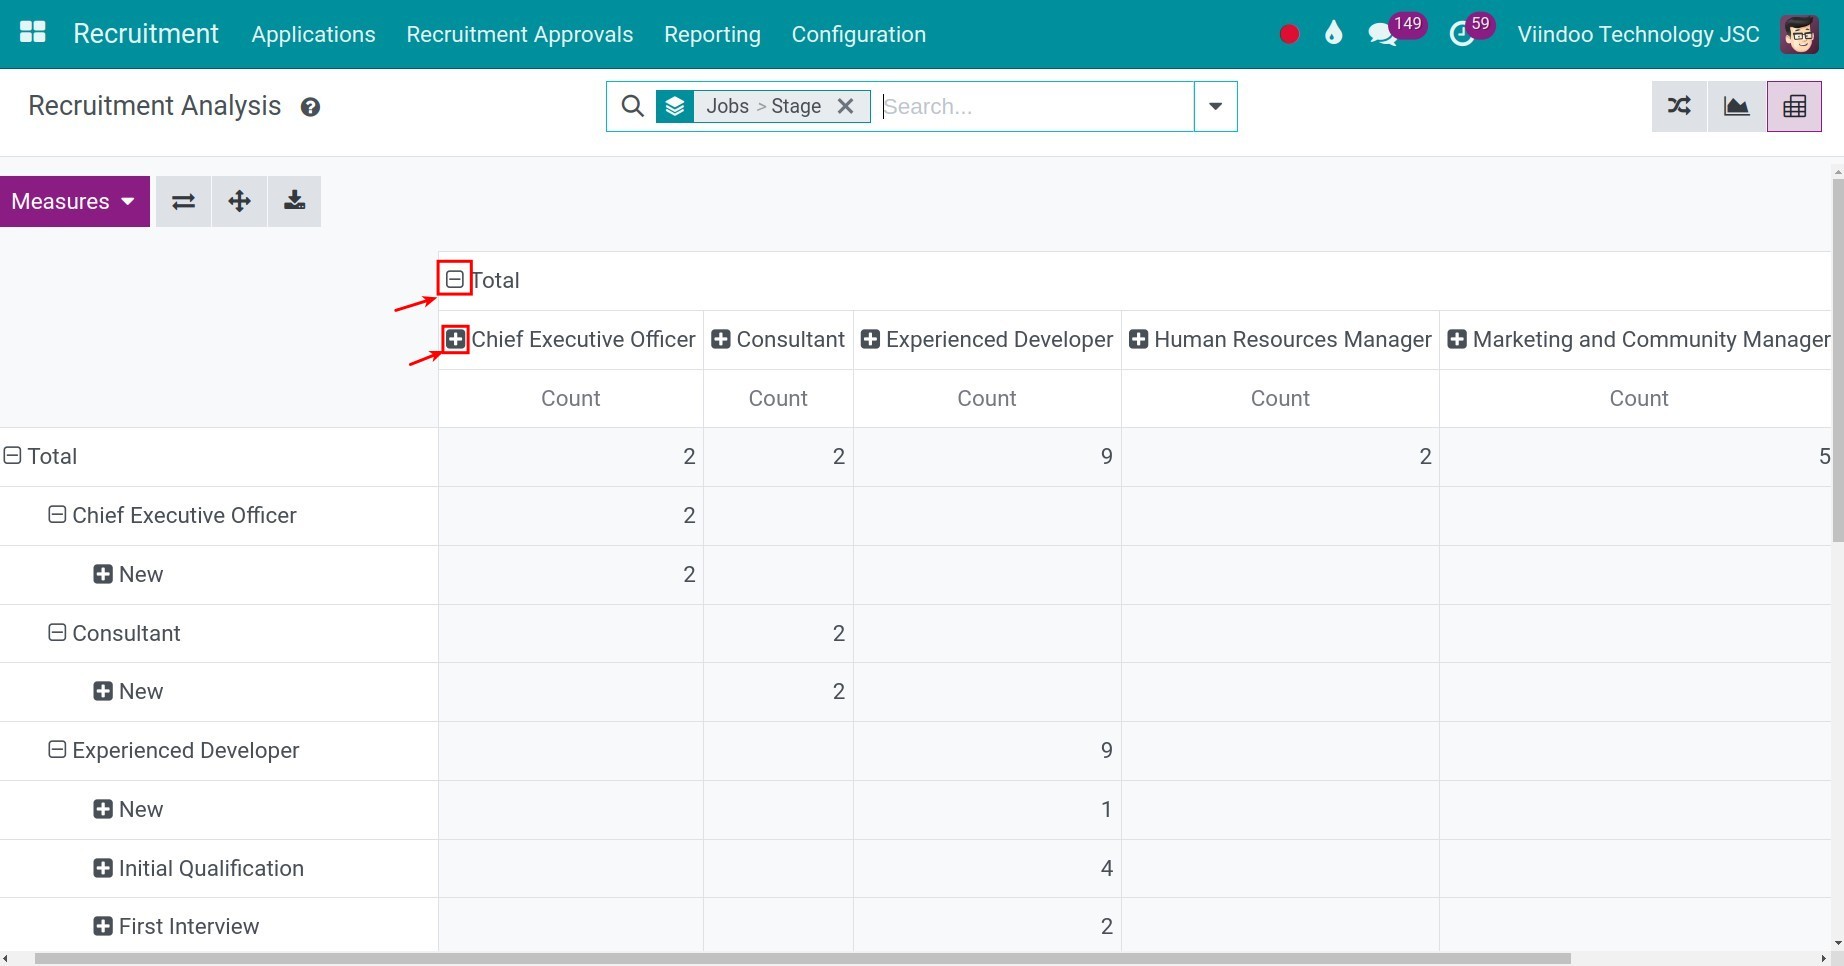
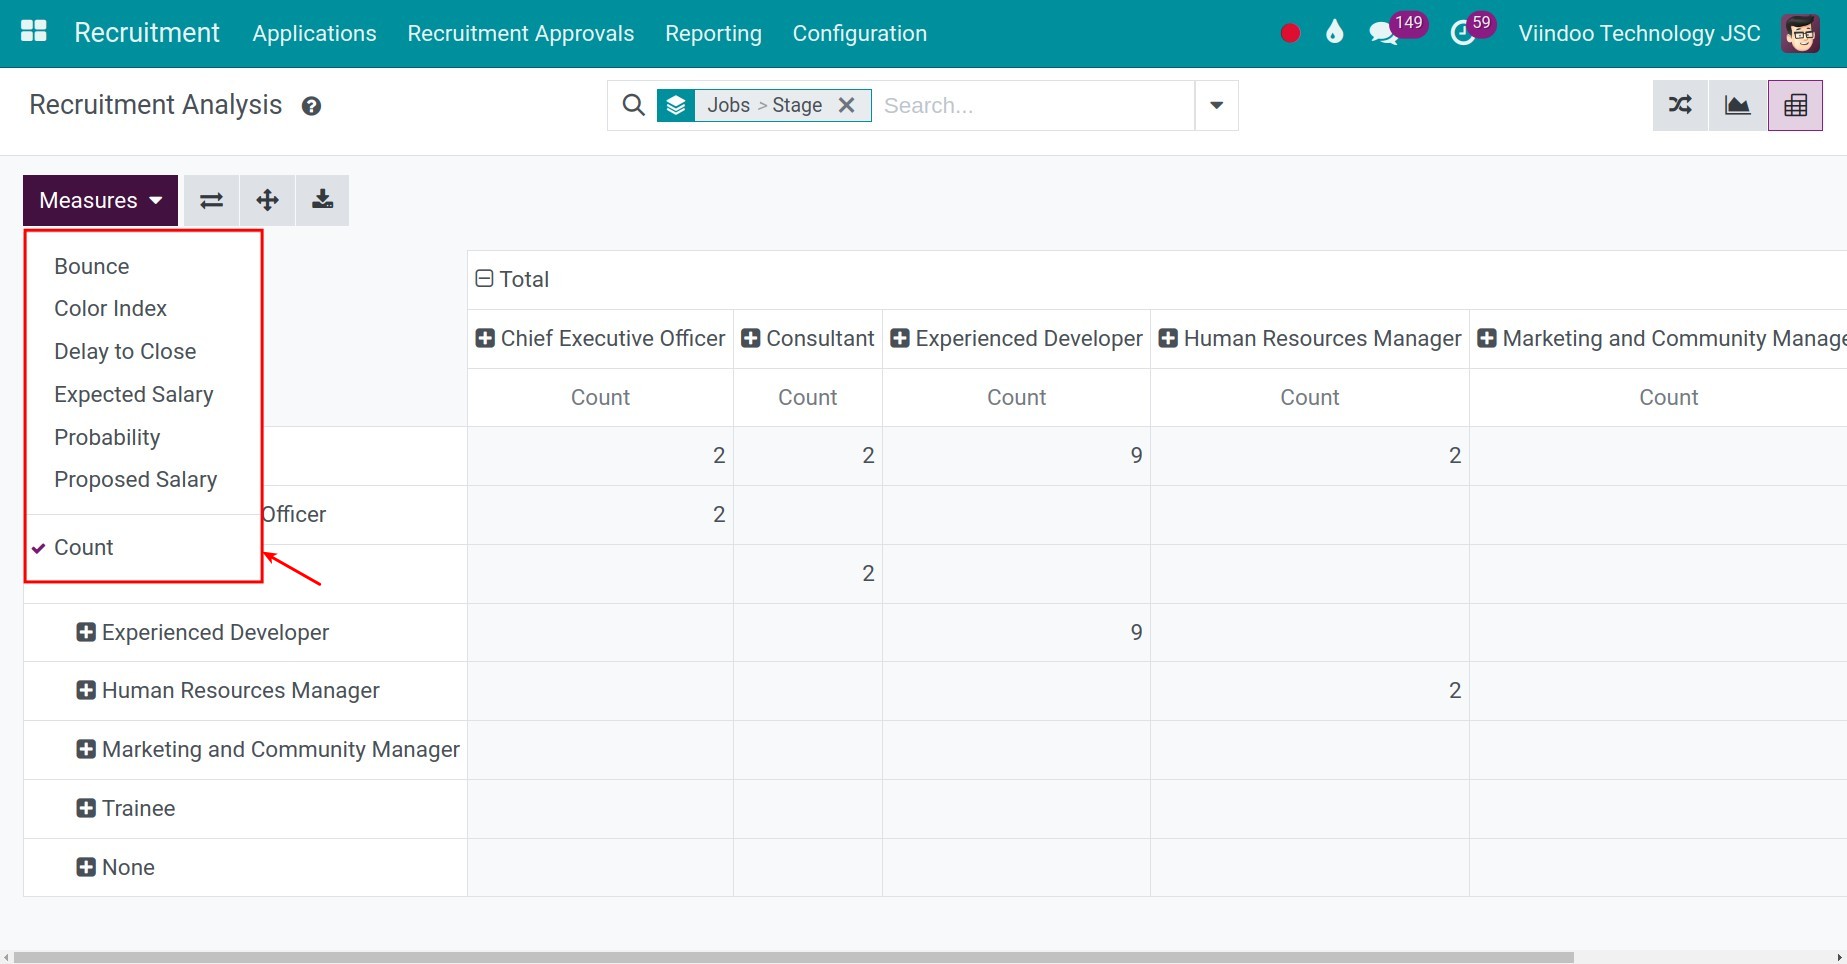
View reports in Pivot
You click the Pivot icon to view reports. You can click the “+” icon to select the criteria displayed on reports, or click the “-” icon if you want to close those criteria.
After you click on the “+” icon, the system displays a list of criteria. You click on the criteria you want to display on the report: Company, Stage, Department, Responsible, Jobs, etc.
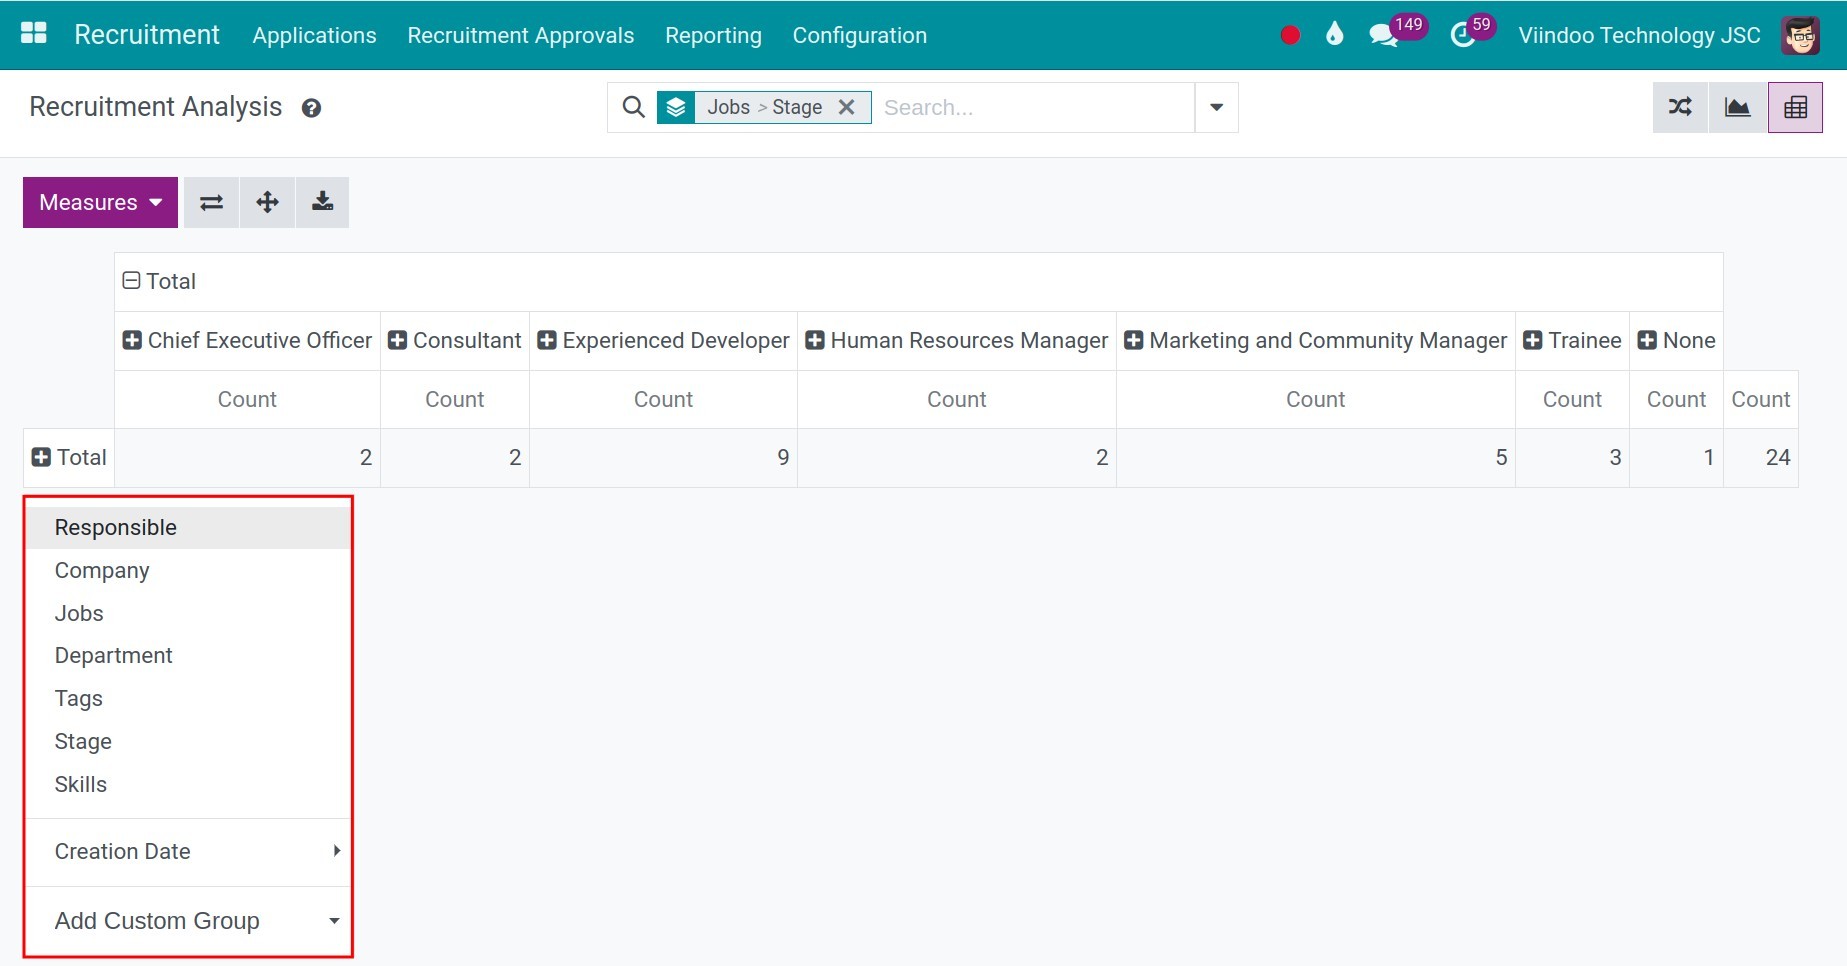
Unlike the Graph type, you can choose from multiple measures for reports. The reports will be displayed according to these measures.
See also
Related article
Optional module