Recruitment reportings
To view the recruitment reportings, access to the module Recruitment, navigate to Reporting > Recruitment Analysis.
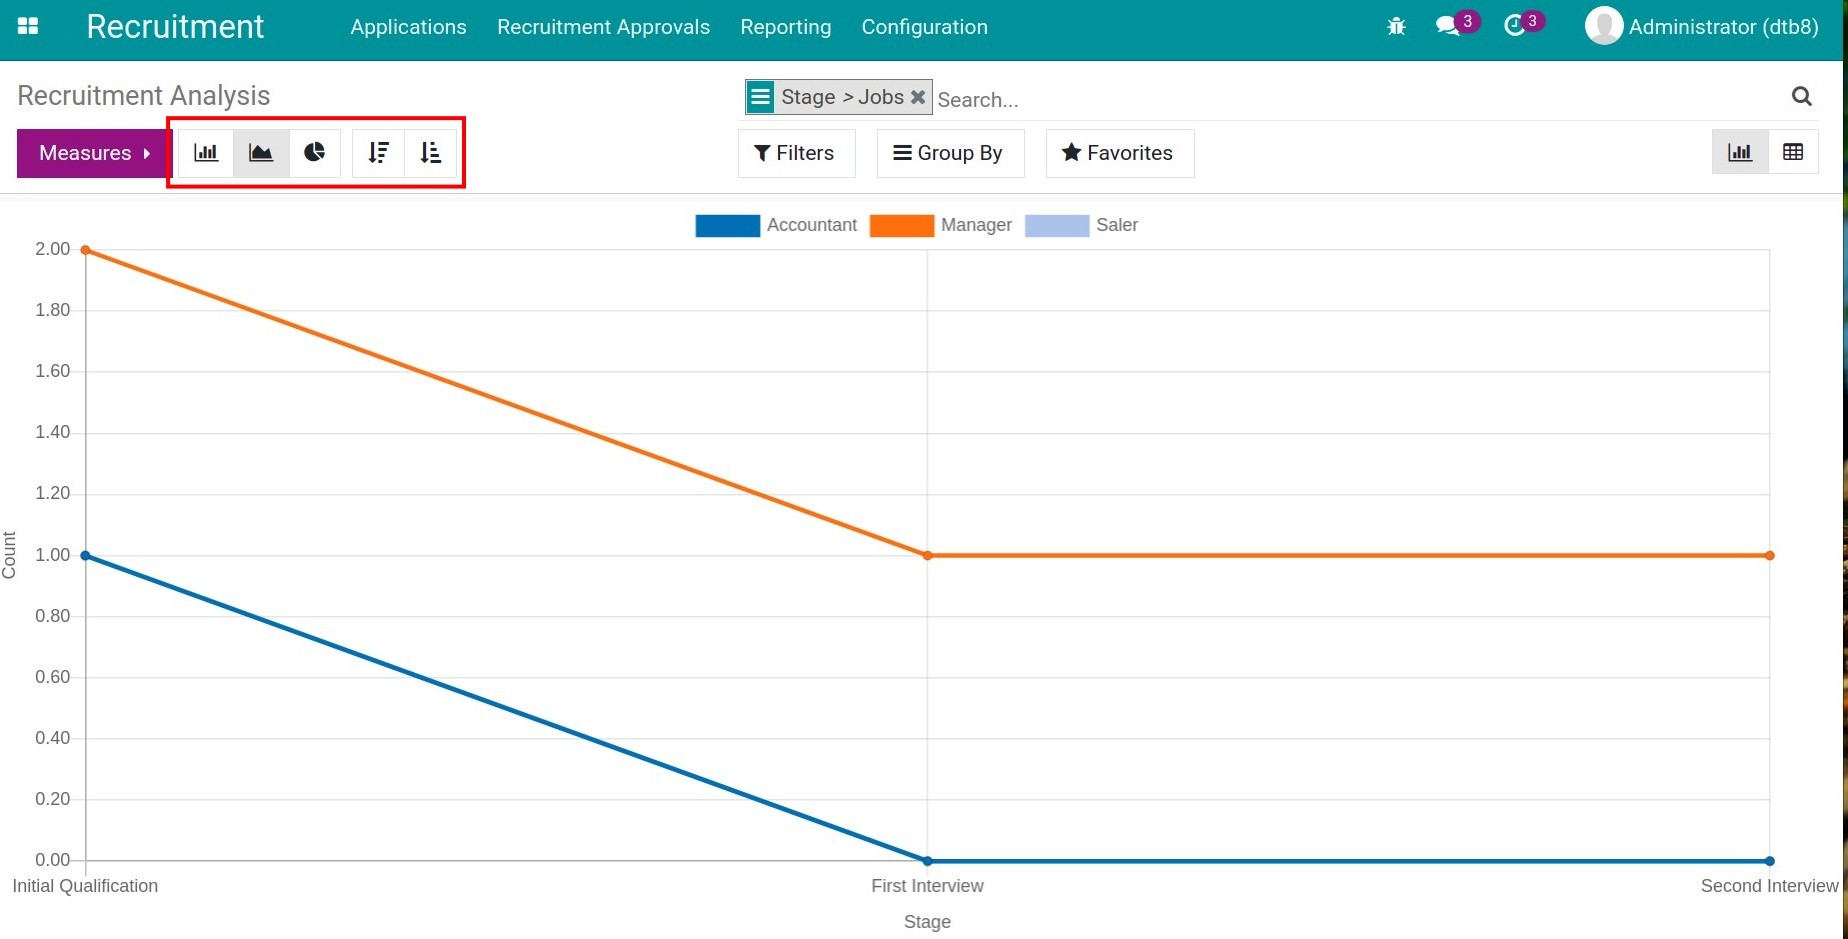
View reports in Graph
When you access the Recruitment Analysis view, the default system suggests you view reports in graph mode, group by Creation Date: Month > Jobs. You can turn off this condition to build the report you want.
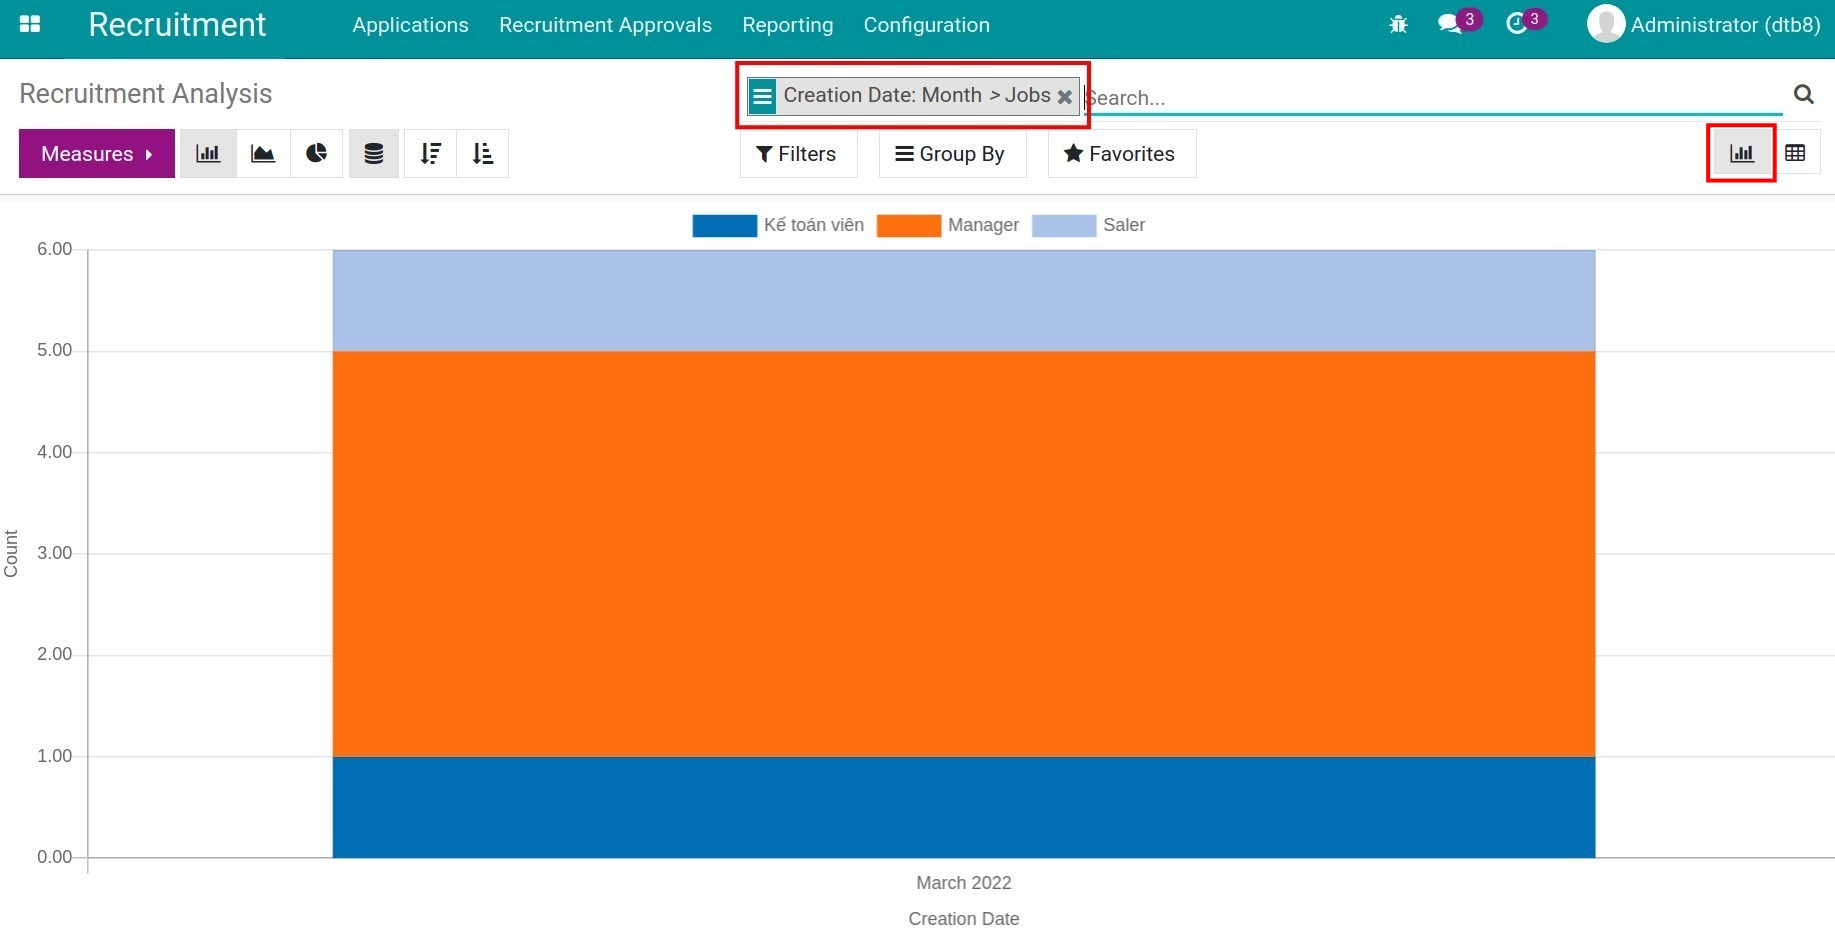
To change the value displayed on the vertical axis of the graph, use the Measures. In the list of measures, you check 1 value: Expected Salary, Proposed Salary, Count,…
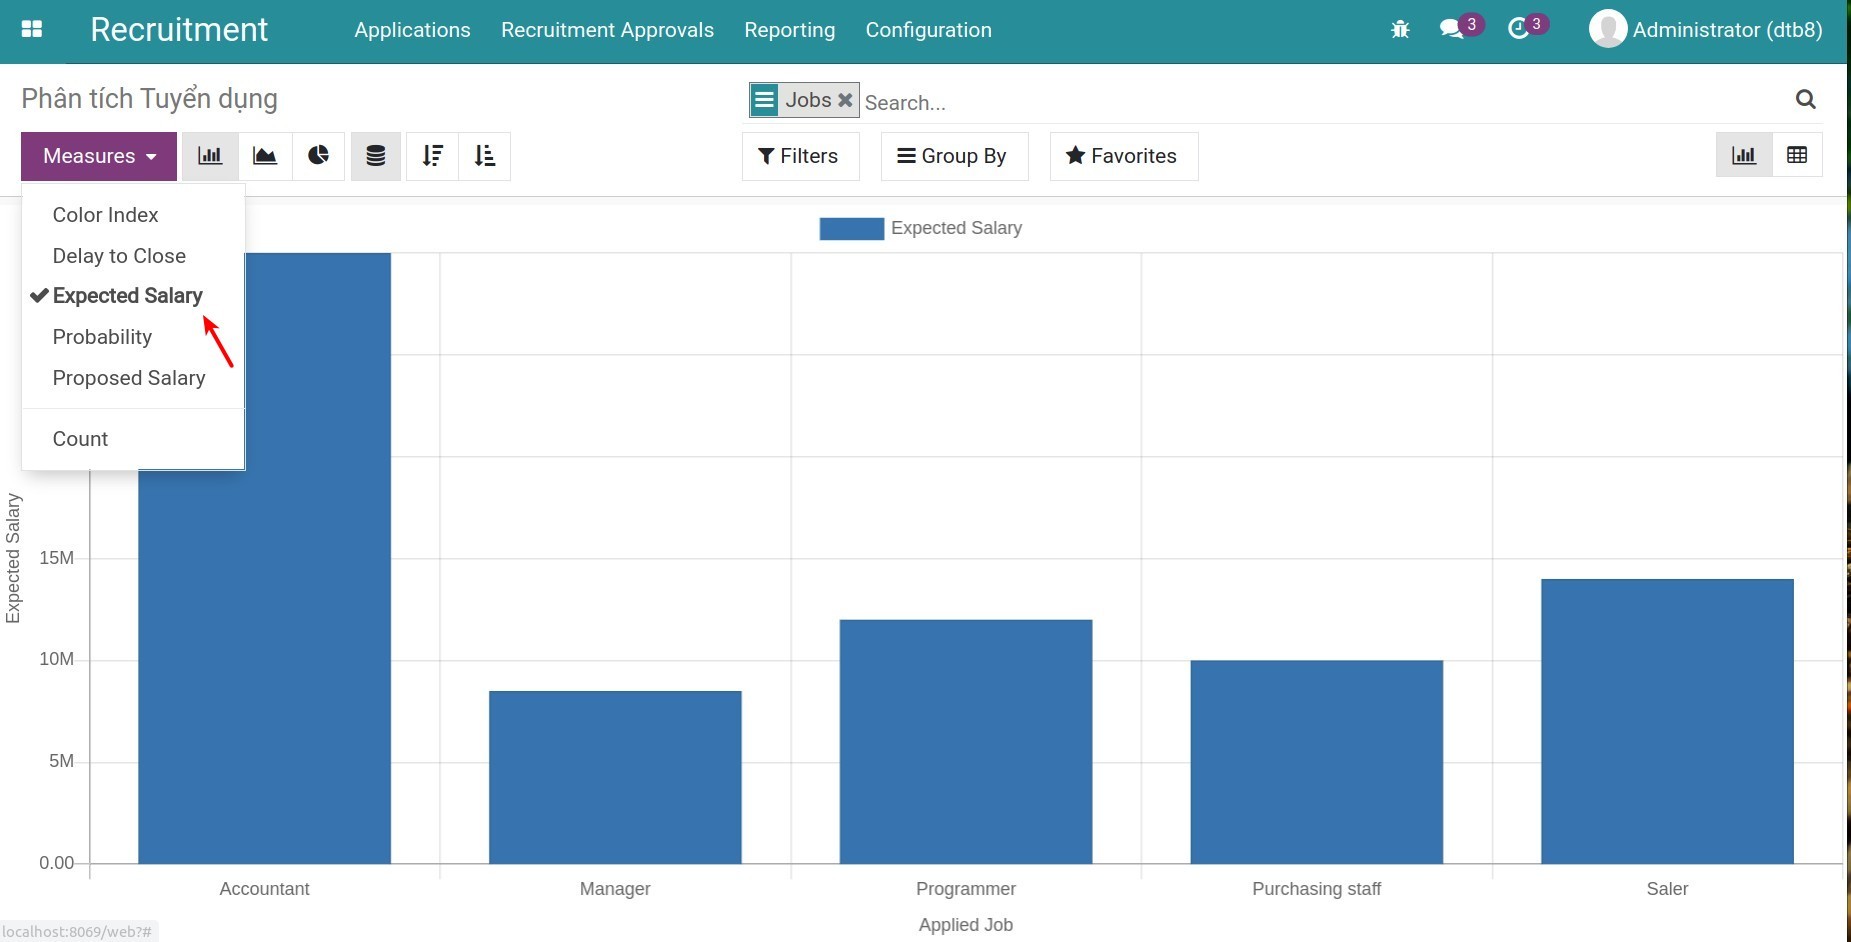
To change the value displayed on the horizontal axis of the graph, you use the Filters, Group By: Department, Stage, Responsible,…
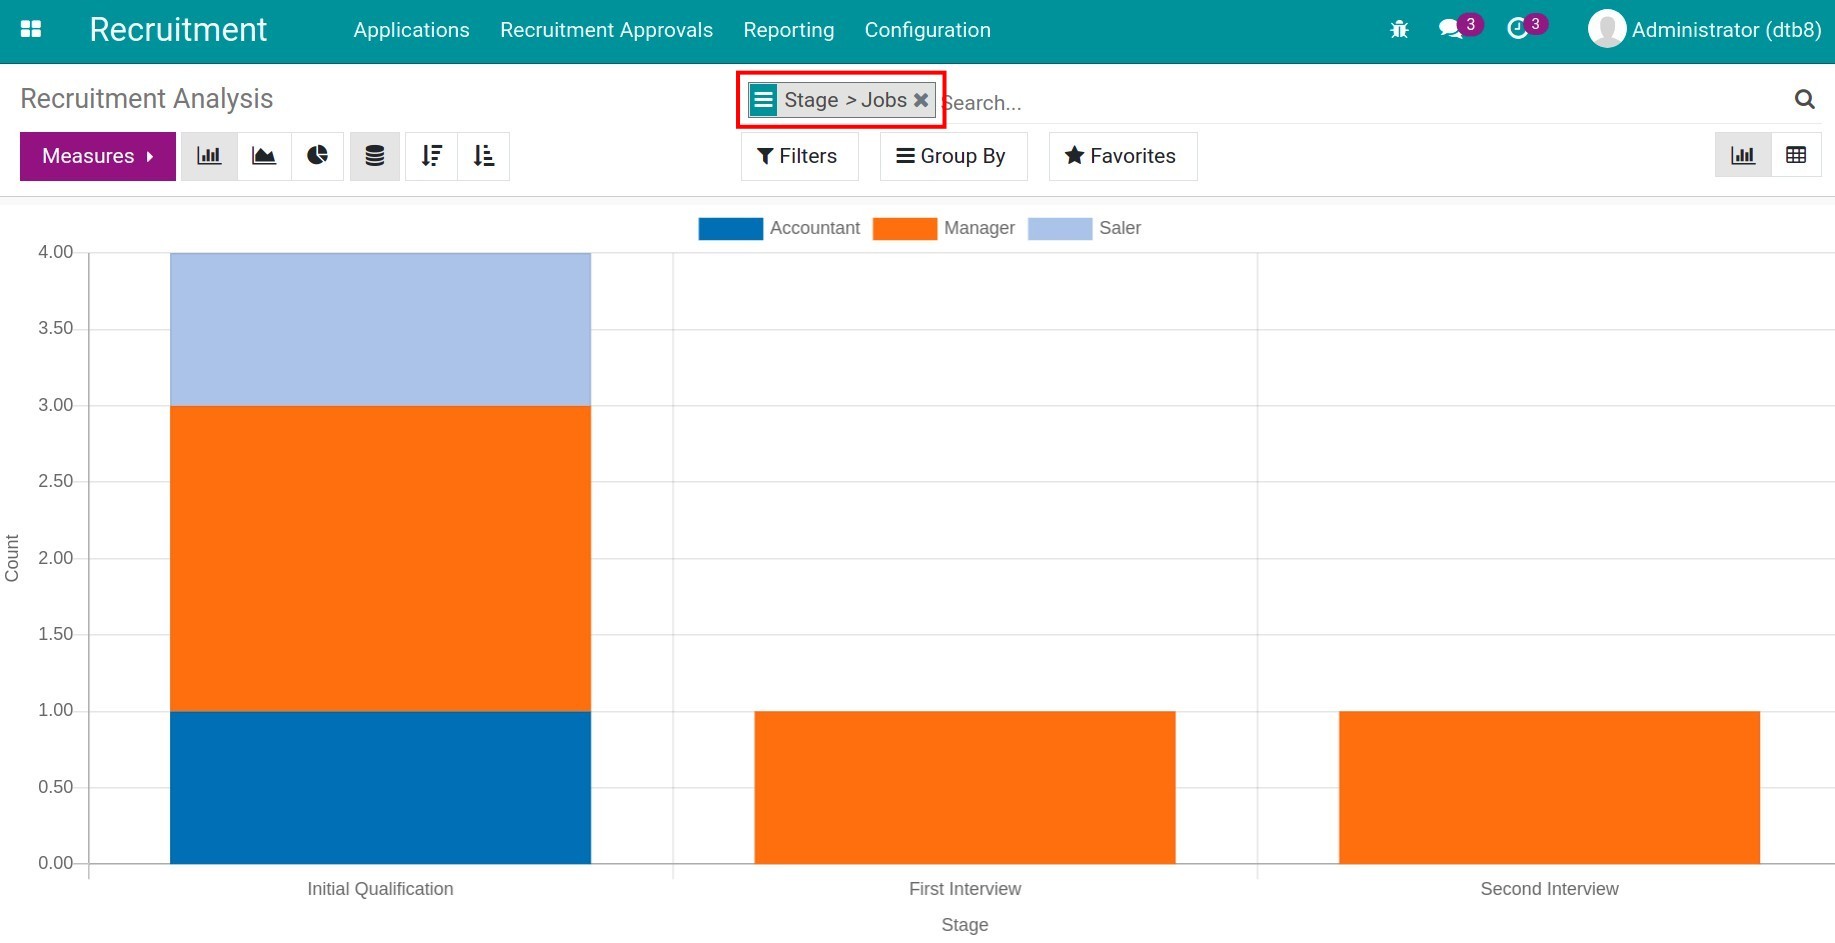
You can choose to view reports in other graph types, or by increasing/decreasing values by clicking the respective icons.
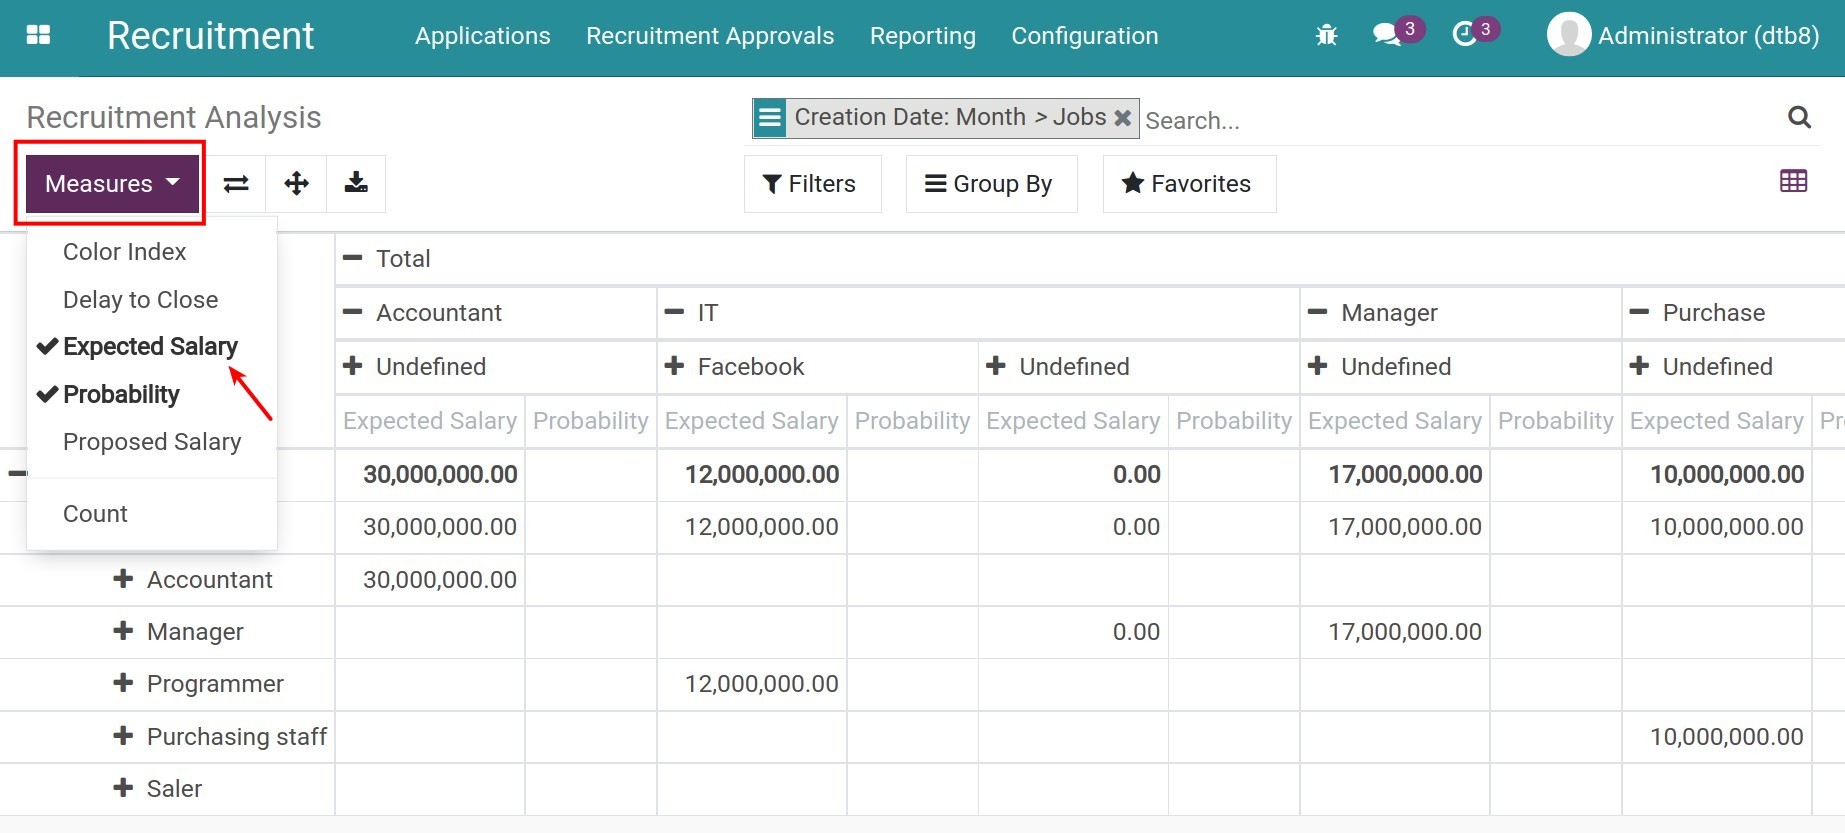
View reports in Pivot
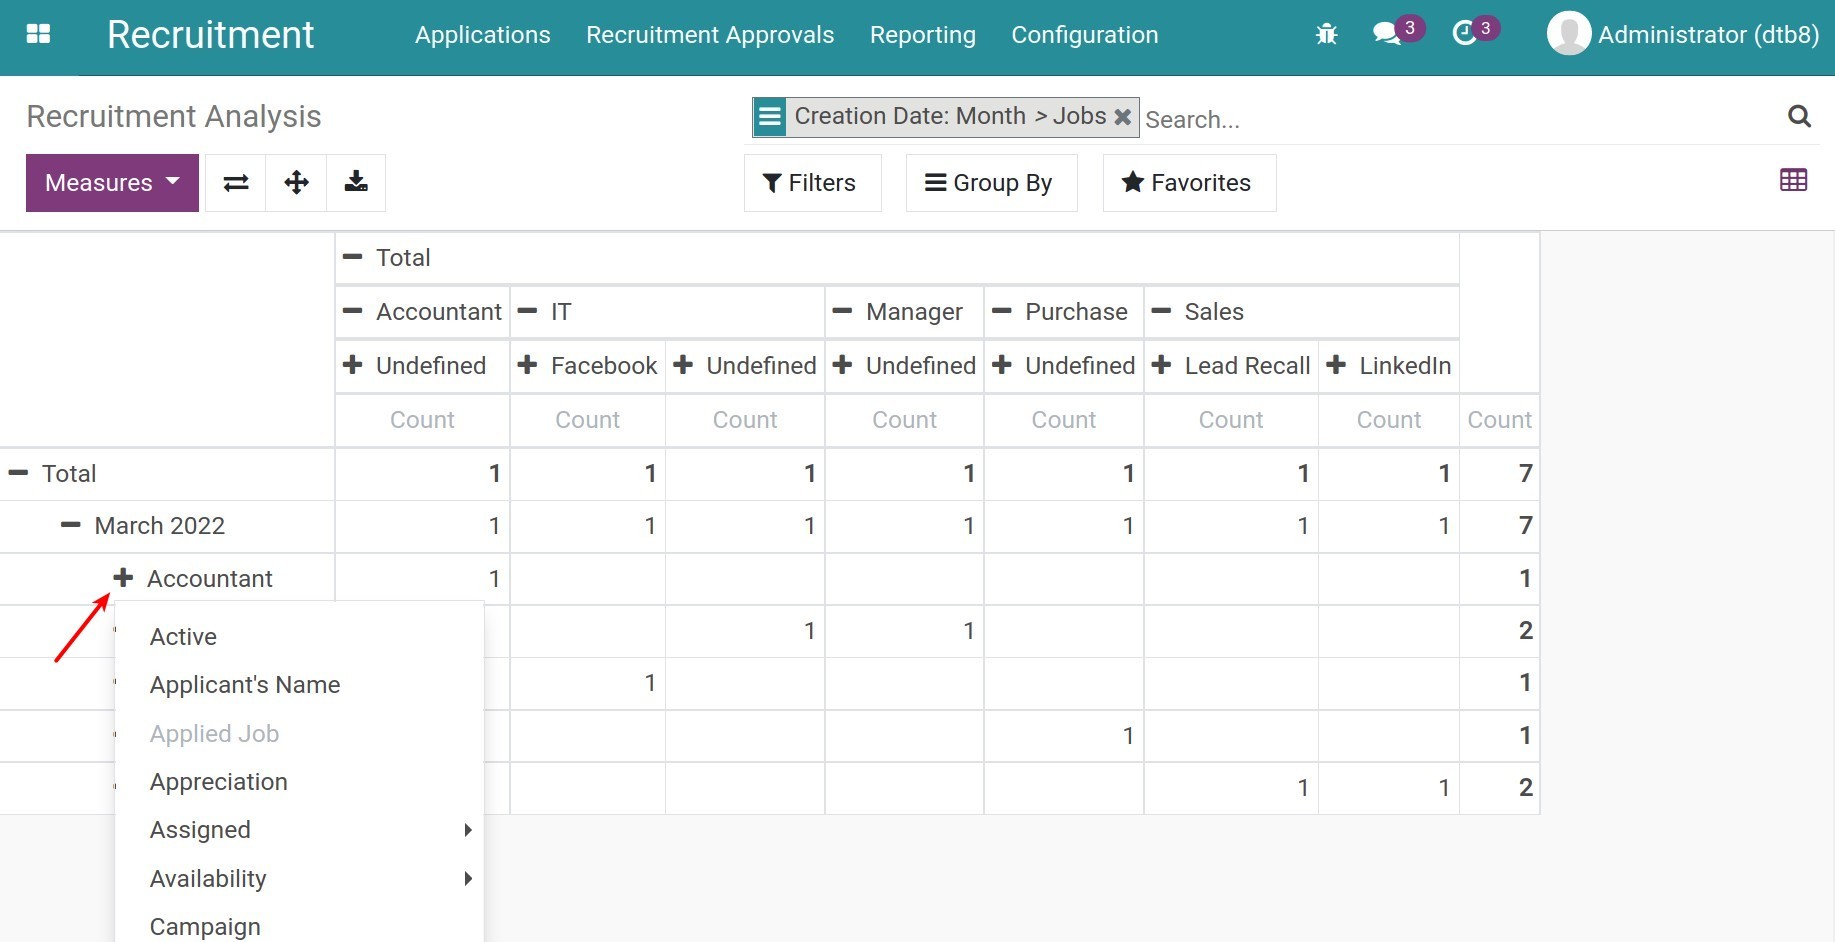
You click the Pivot icon to view reports. The default system suggests you view reports by Creation Date: Month > Jobs. You can click the “+” icon to select the criteria displayed on reports, or click the “-” icon if you want to close those criteria.
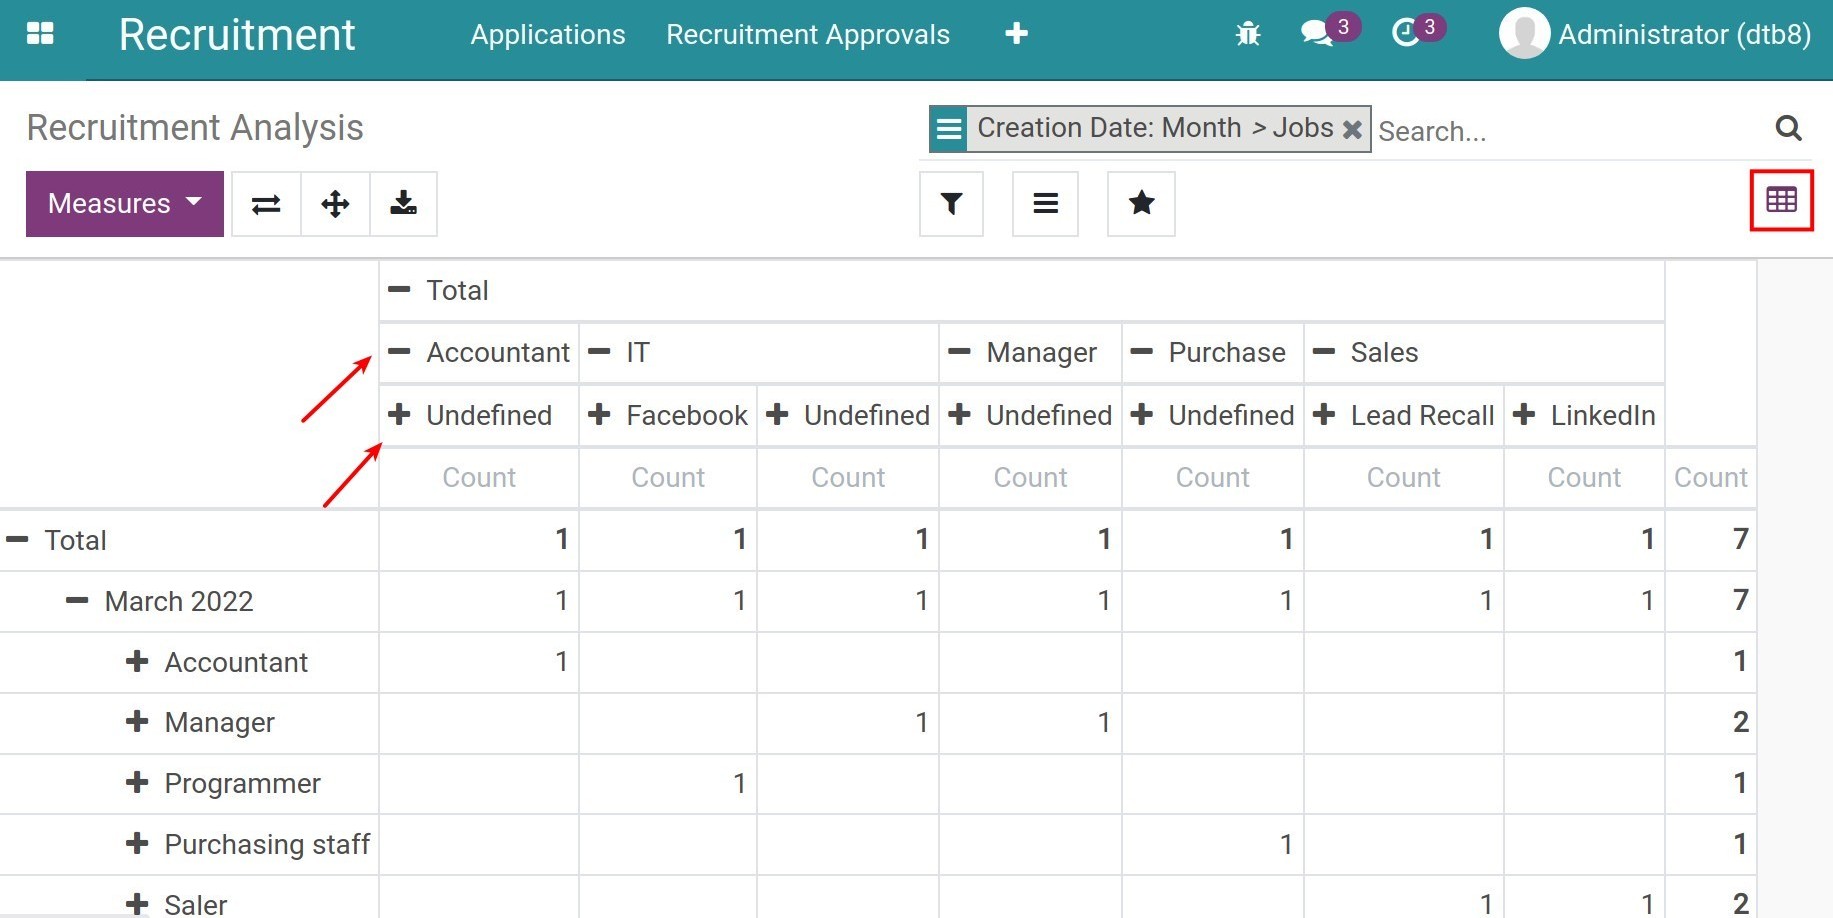
After you click on the “+” icon, the system displays a list of criteria. You click on criteria you want to display on the report: Applicant’s Name, Source, Department, Responsible, Degree,…
Unlike the Graph type, you can choose from multiple measures for reports. The reports will display according to these measures.