Personal Income Tax Analysis
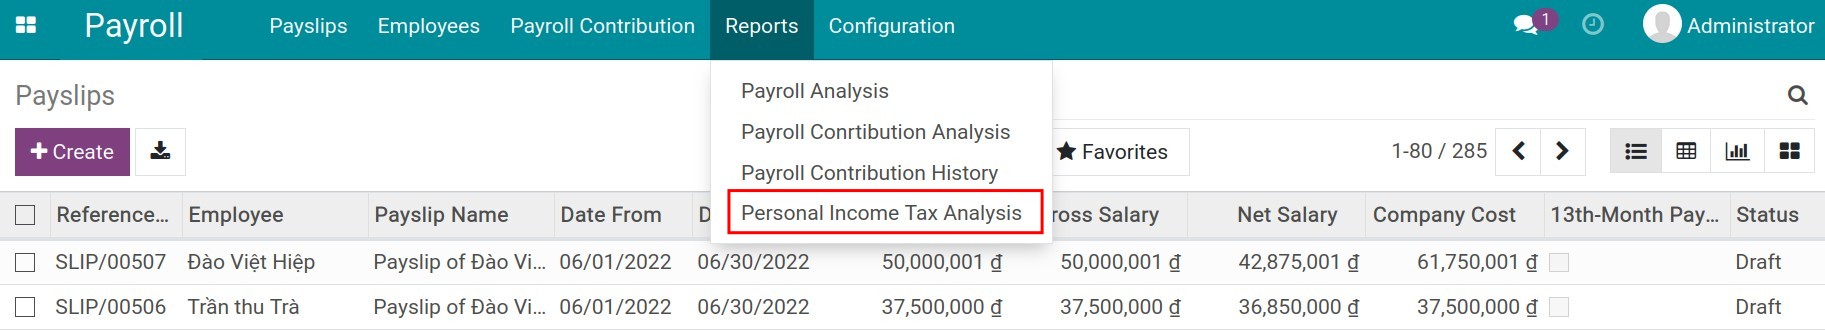
To view personal income tax analysis in Viindoo, navigate to Payroll ‣ Reports ‣ Personal Income Tax Analysis:
Personal Income Tax Analysis in the pivot table
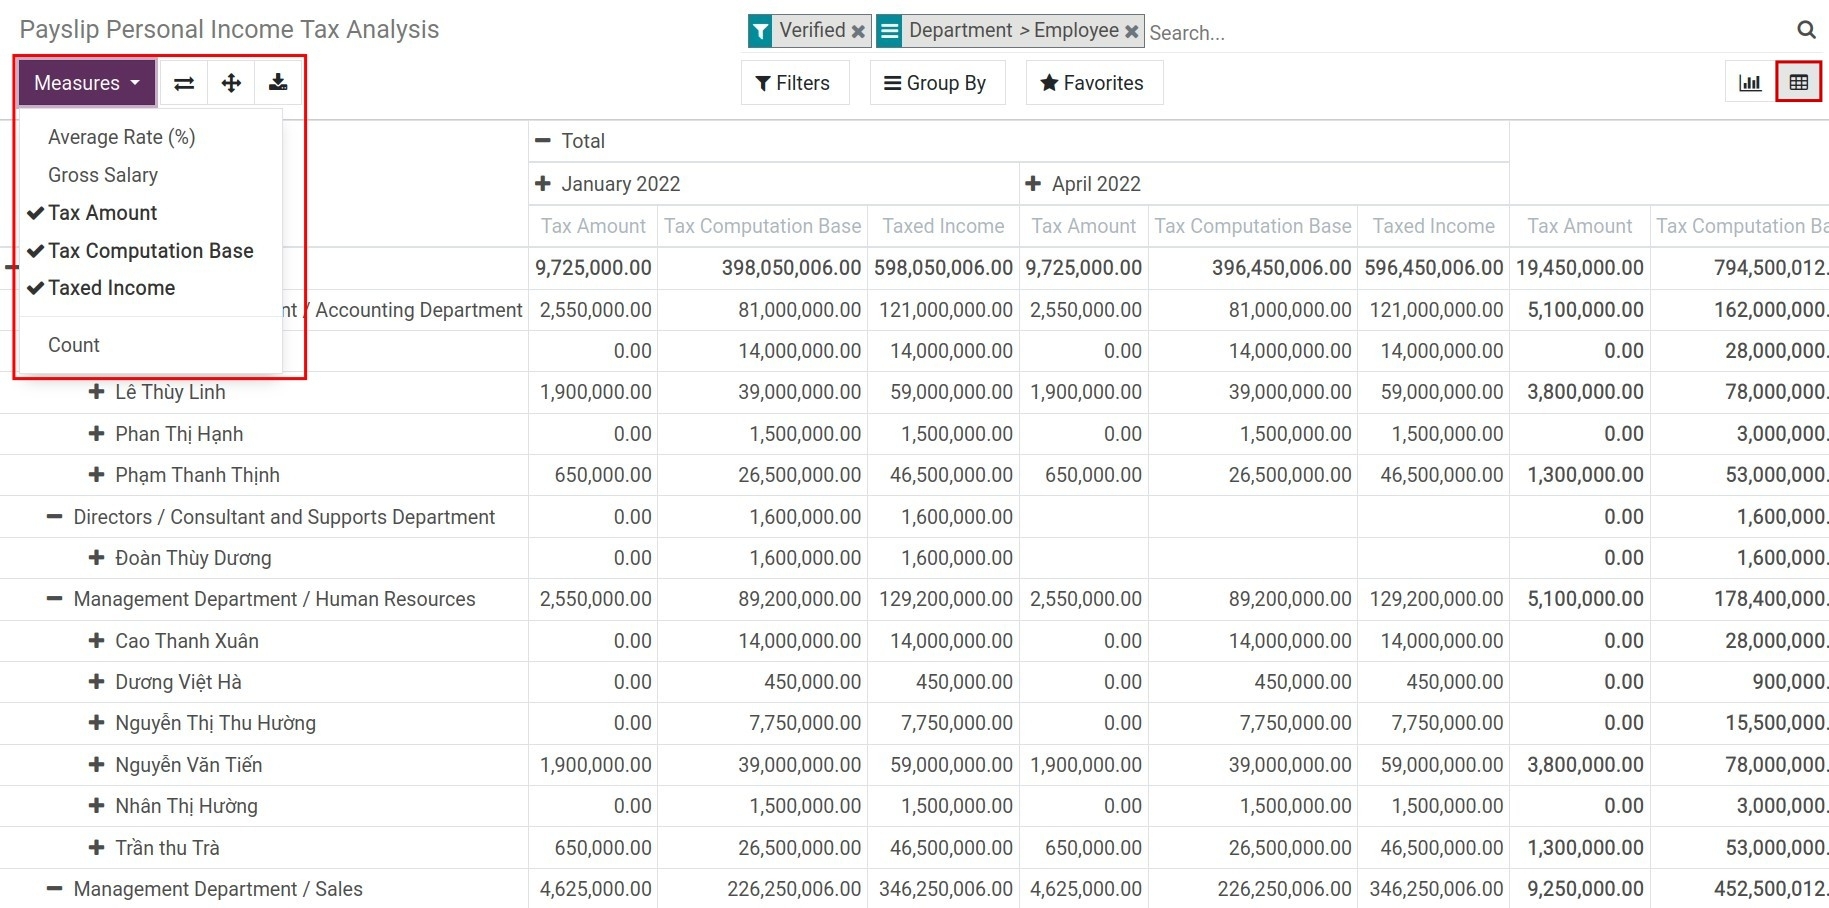
In this report, you can use the following measures:
Tax Computation Base;
Tax Amount;
Gross Salary;
Taxed Income;
Average Rate (%);
Count.
Use the filters and groups feature to perform analysis by different criteria. You can save your report in the Favorites filter to use as default or share it with all users in your instance:
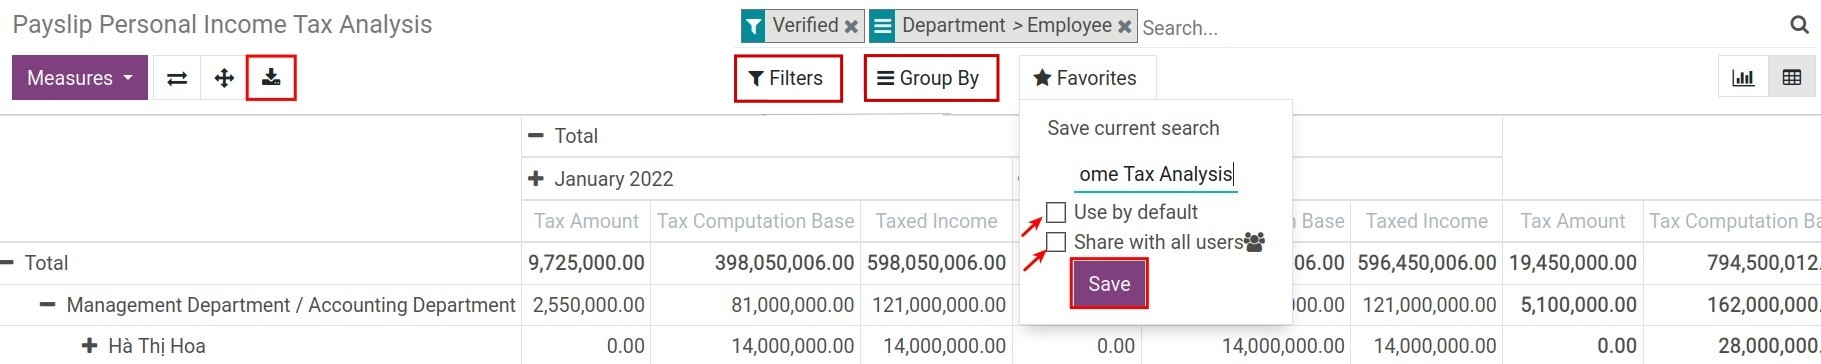
Export personal income tax analysis to an excel file to use.
Personal Income Tax Analysis in the graph
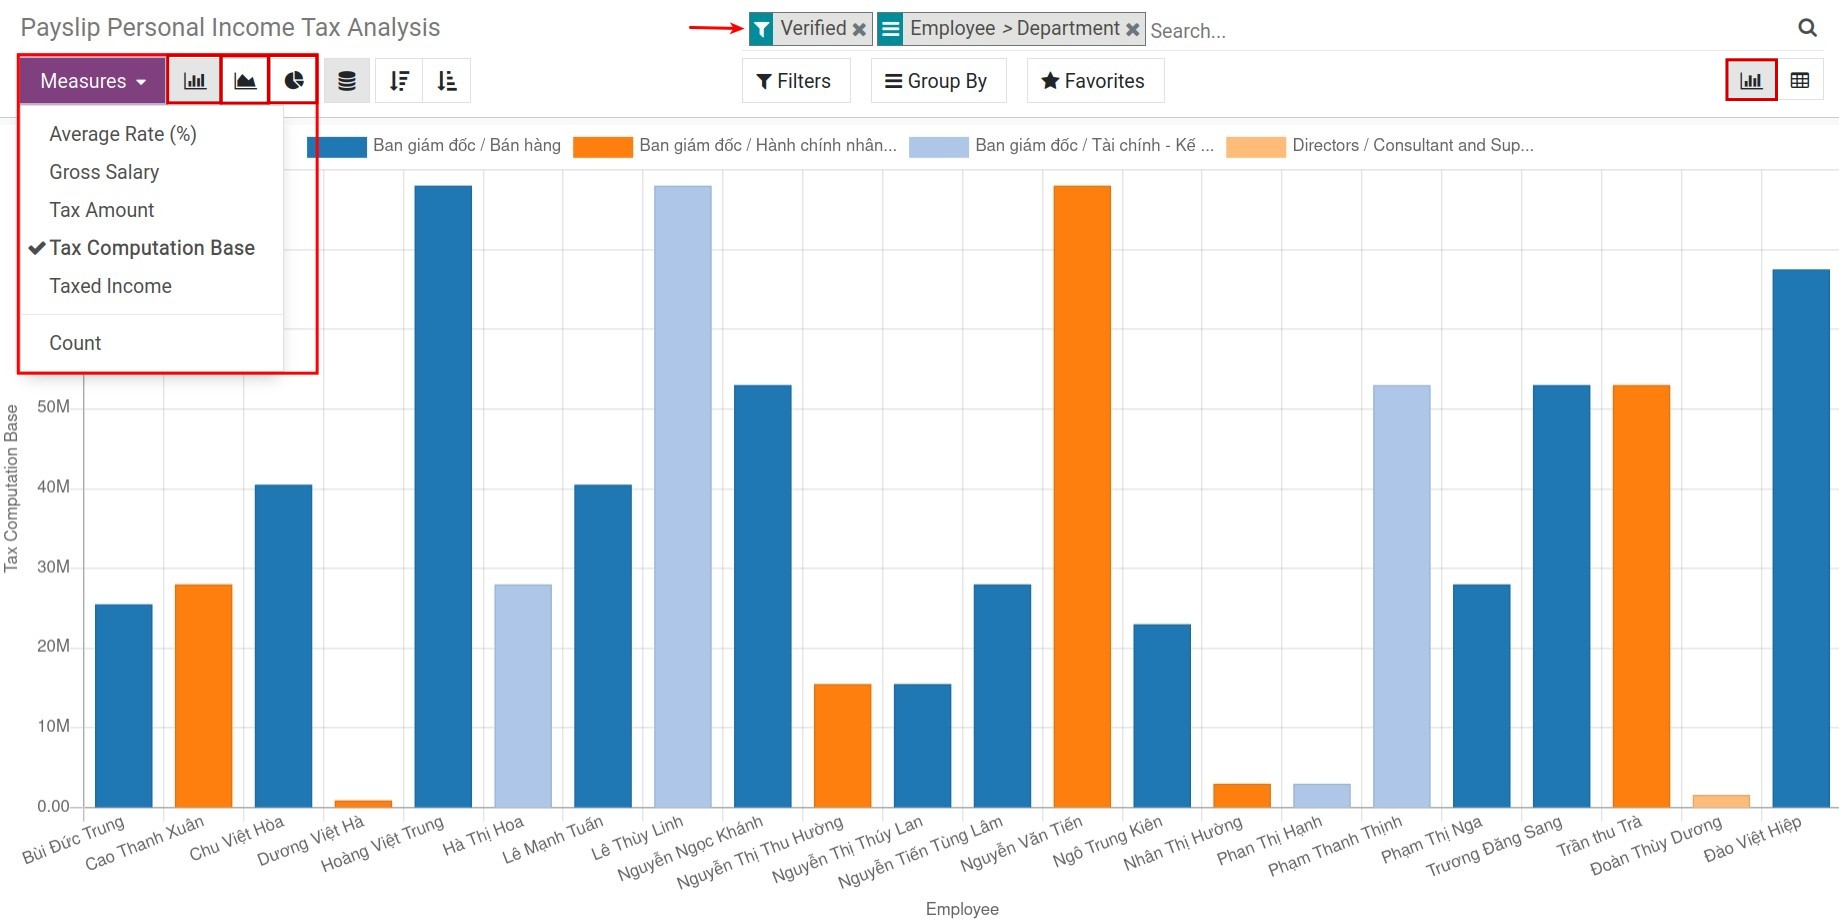
Similar to the pivot analysis, the graph supports the following features:
View your report in the graph with different measures.
Use the filters and groups feature to change the analysis criteria.
You can save your current analysis in the Favorites filter to use as default or share it with your colleagues.
In addition, this analysis has some differences as follows:
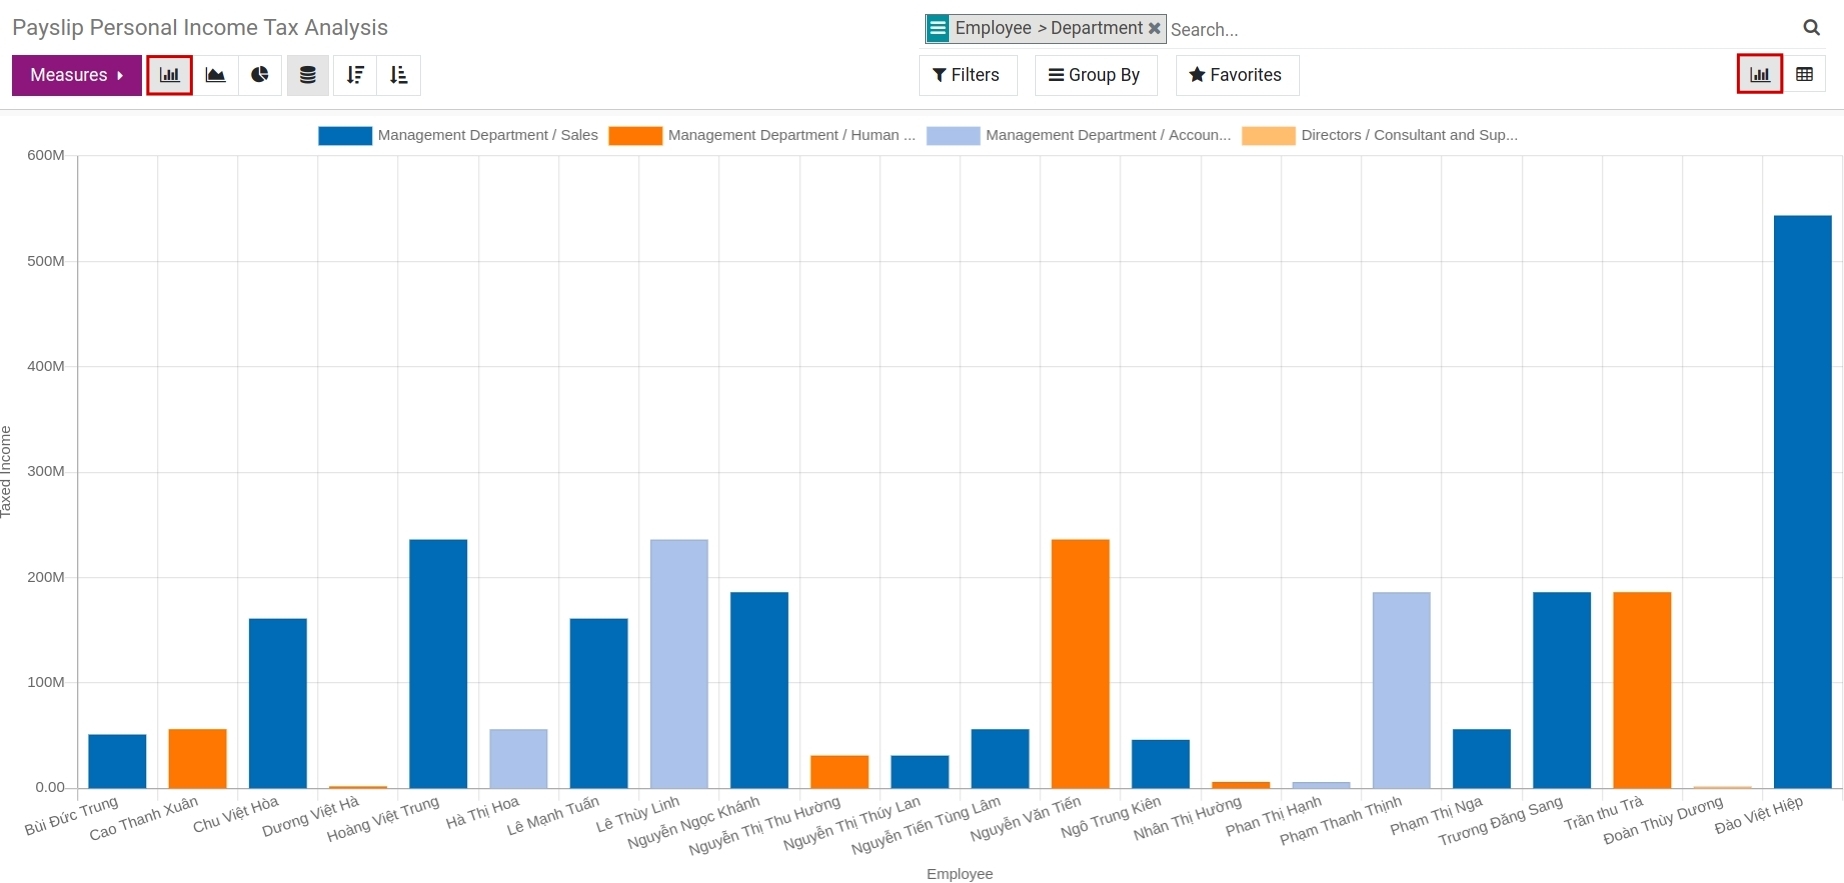
Support in other formats such as bar, line, or pie chart.
Vertical axis value is based on Measure, horizontal axis value is based on Group by.
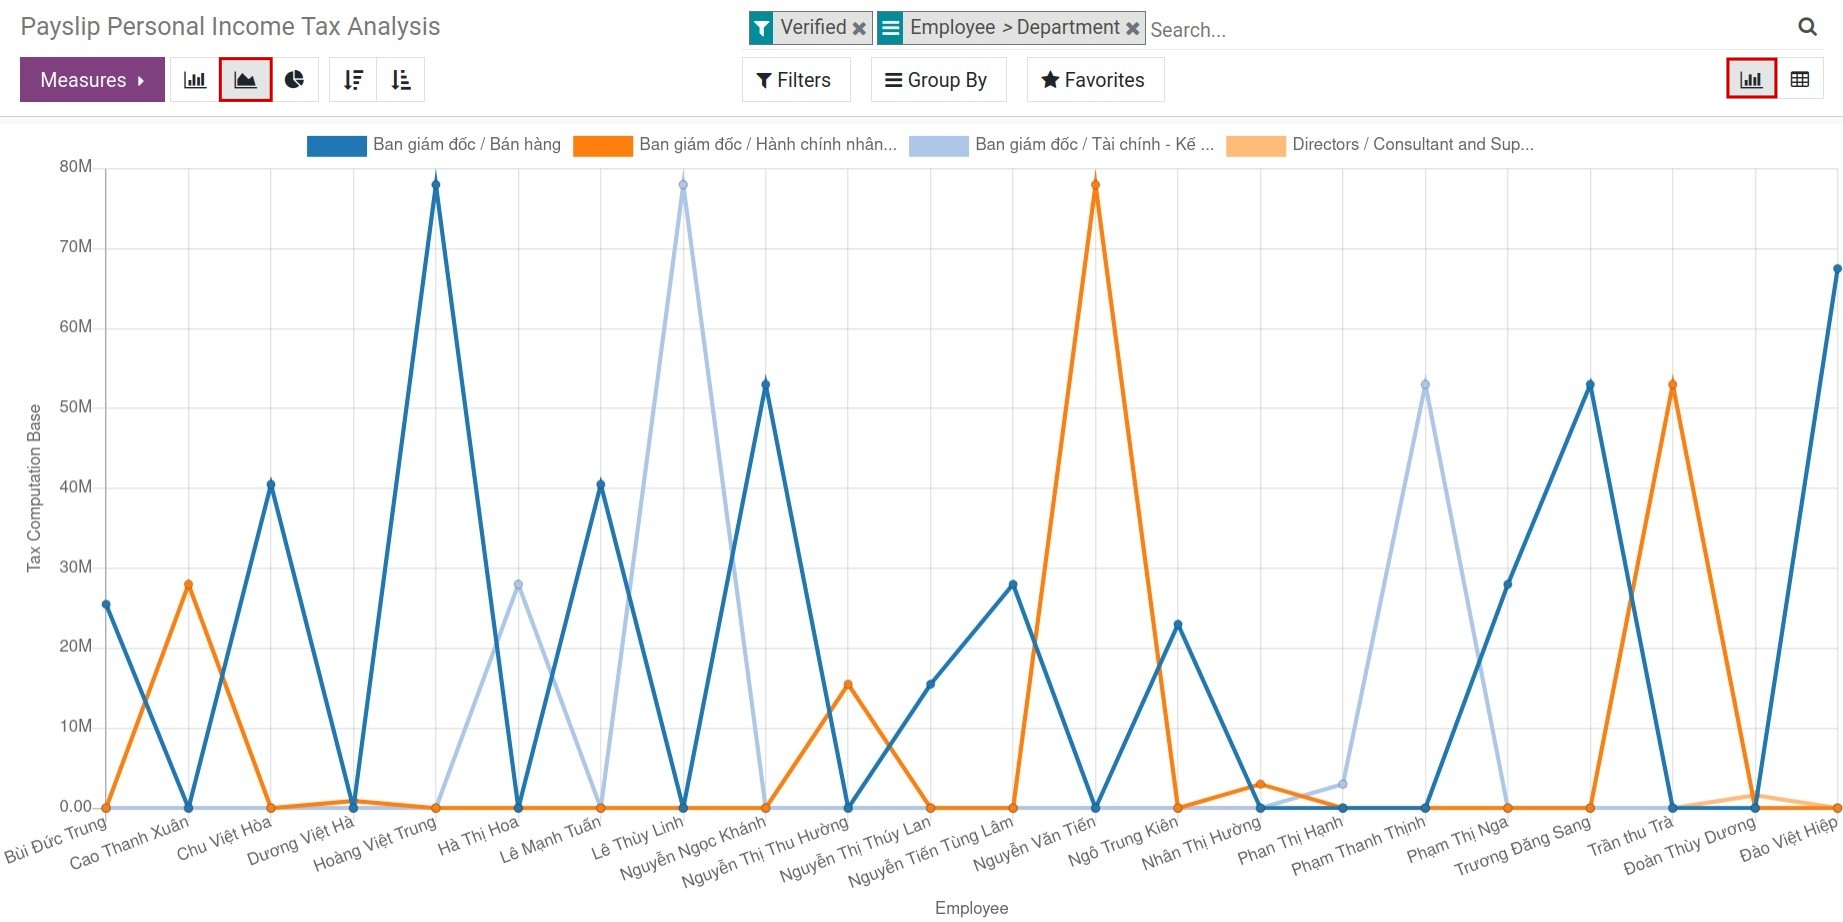
Bar chart![Viindoo bar chart personal income tax analysis]() Line chart
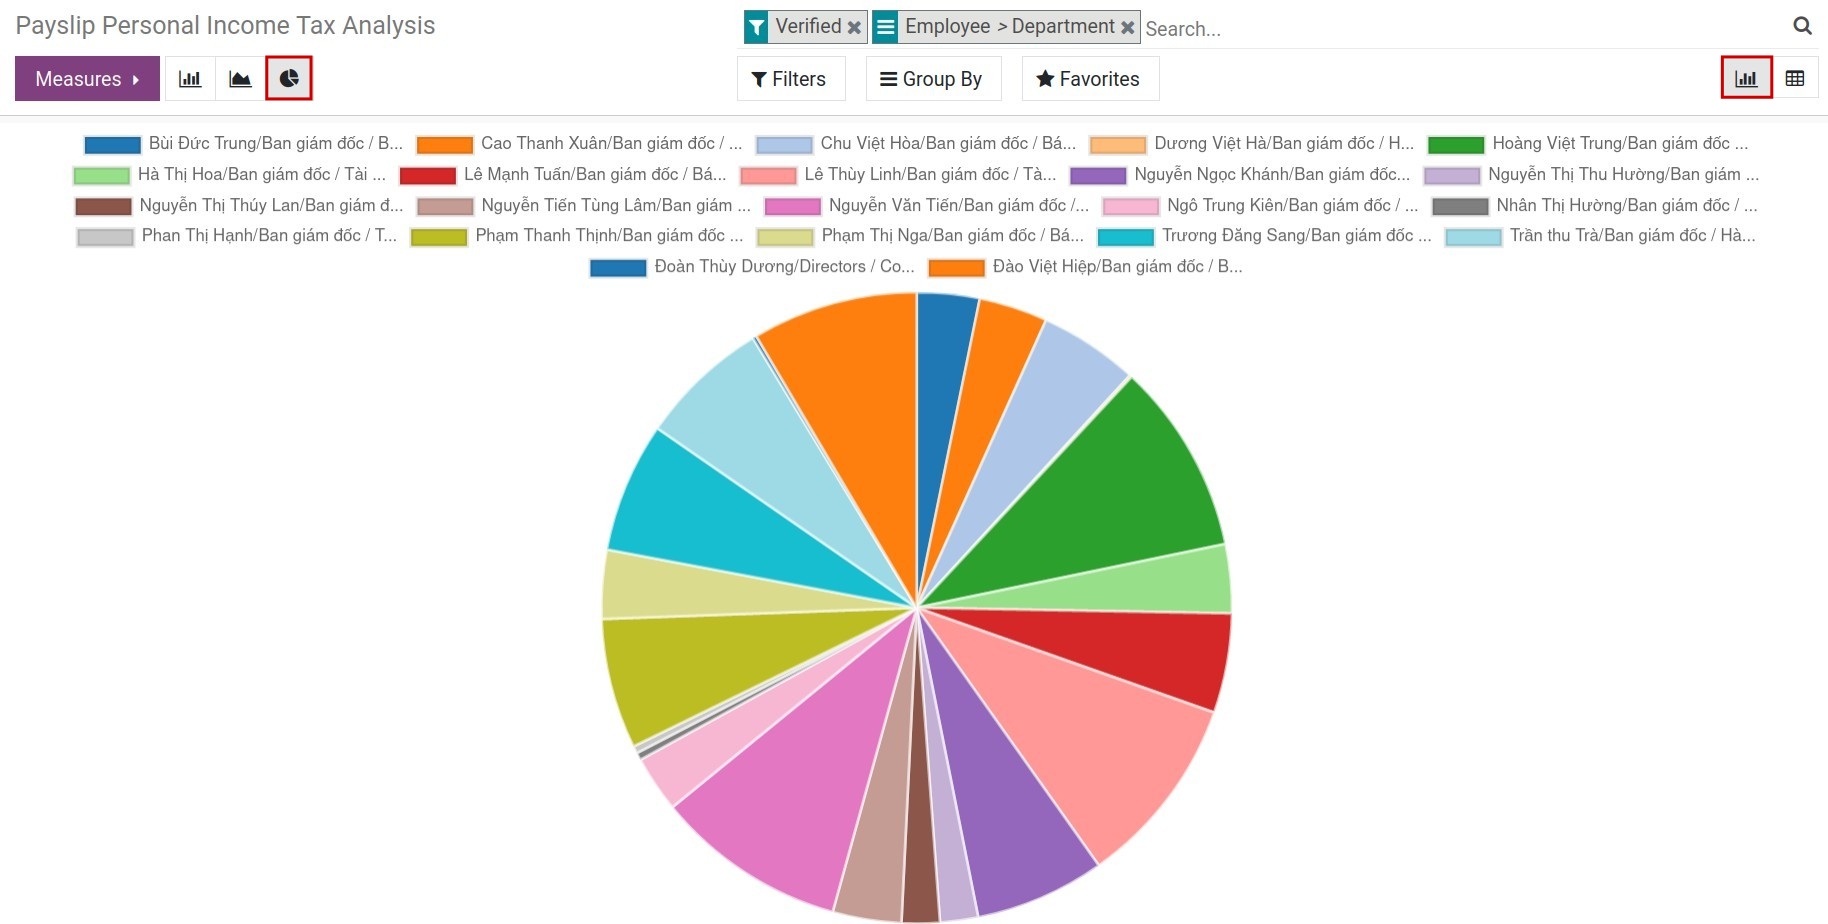
Line chart![Viindoo line chart personal income tax analysis]() Pie chart
Pie chart![Viindoo pie chart personal income tax analysis]()