Real time visualized Purchase Analysis
As a purchase manager, you need to carry out the information in the last month/quarter, about the amount of the purchase orders, the quotations, the value of those orders, and the average delivery time of the Vendor that the enterprise had been performed.
Viindoo Purchase Management app will support you in tracking and making the plan of purchasing which is suitable for the actual business of your company.
Note
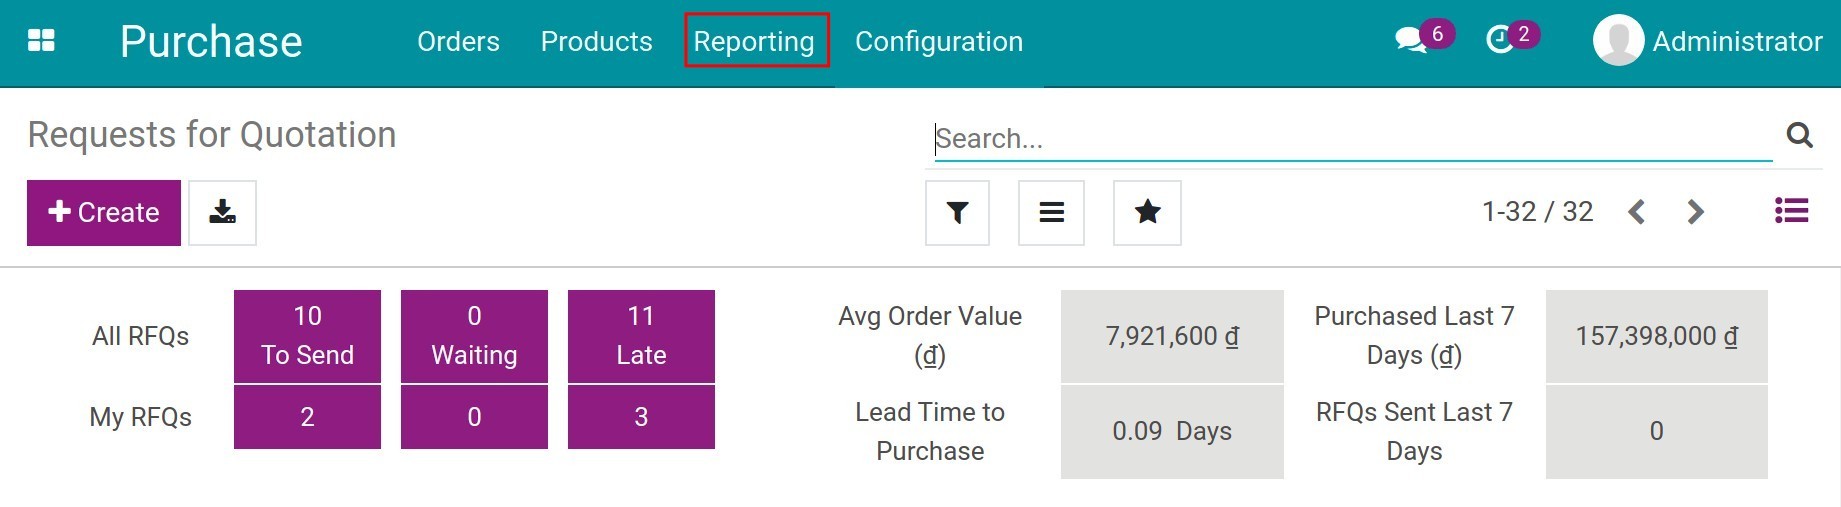
Users with the configured access right as Administrator of the Purchase app can see the Reporting menu. You can refer to Getting Started to set access right for user accounts.
Graph Reports
To view the report of purchasing, you navigate to .
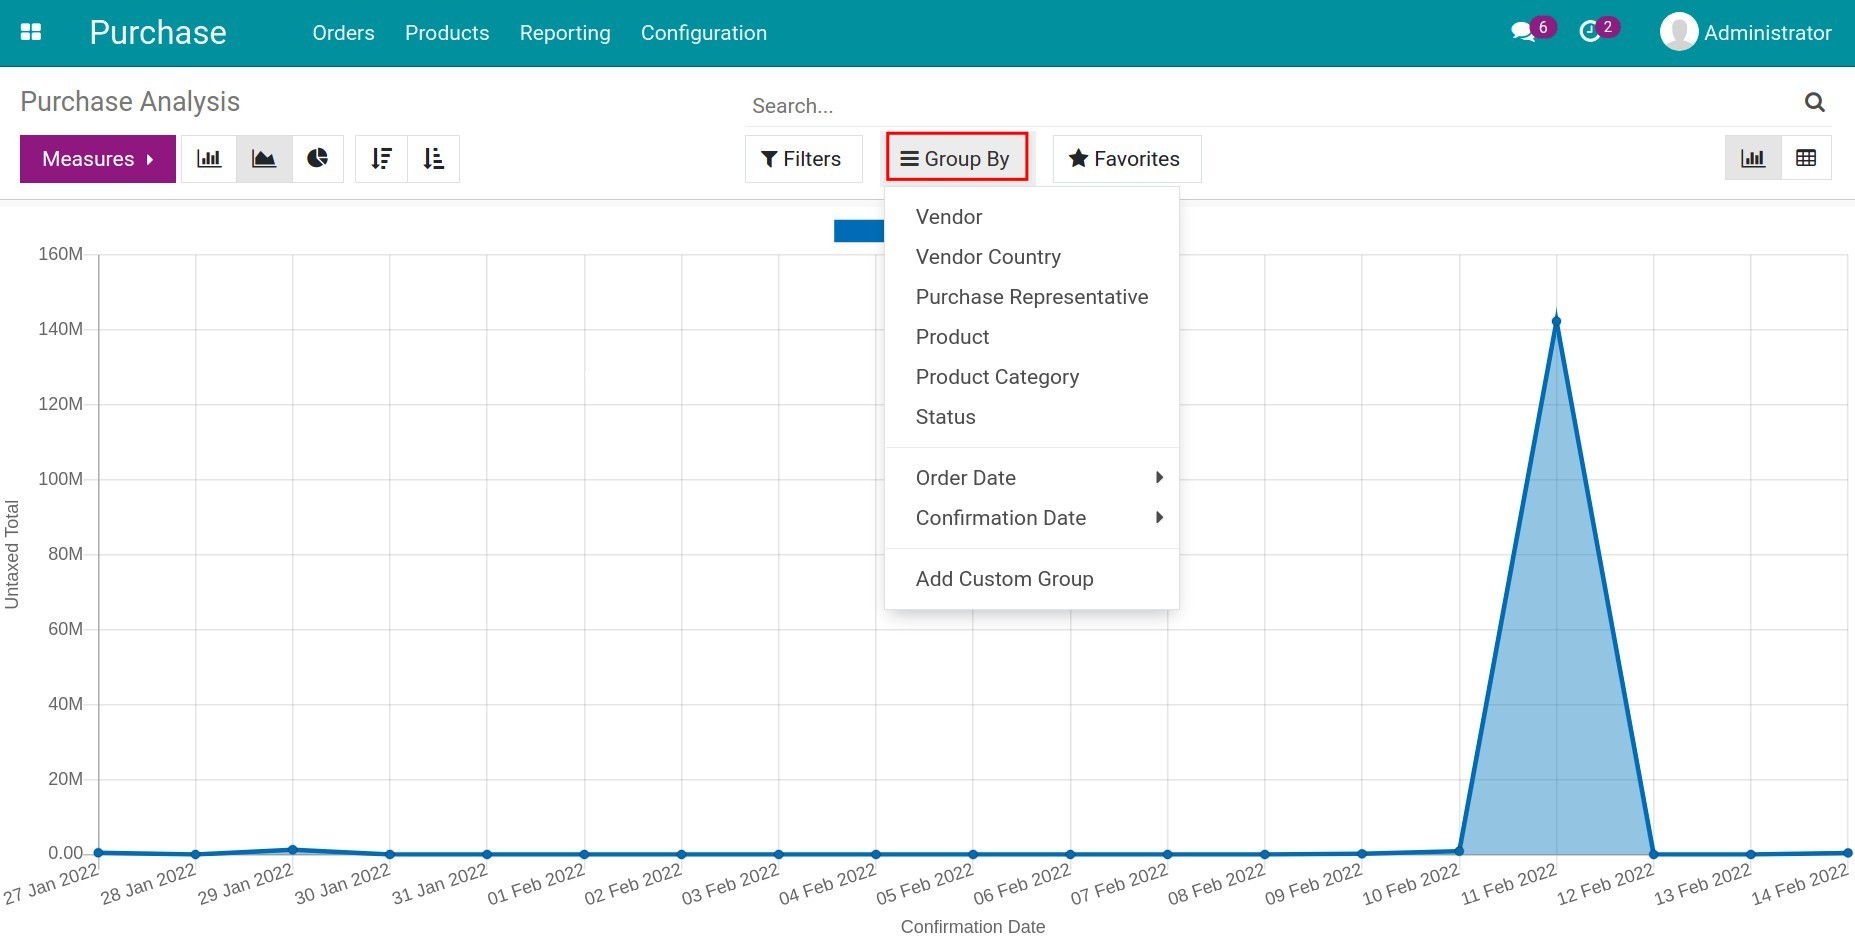
With the default setting, the system will display the report of the line chart.
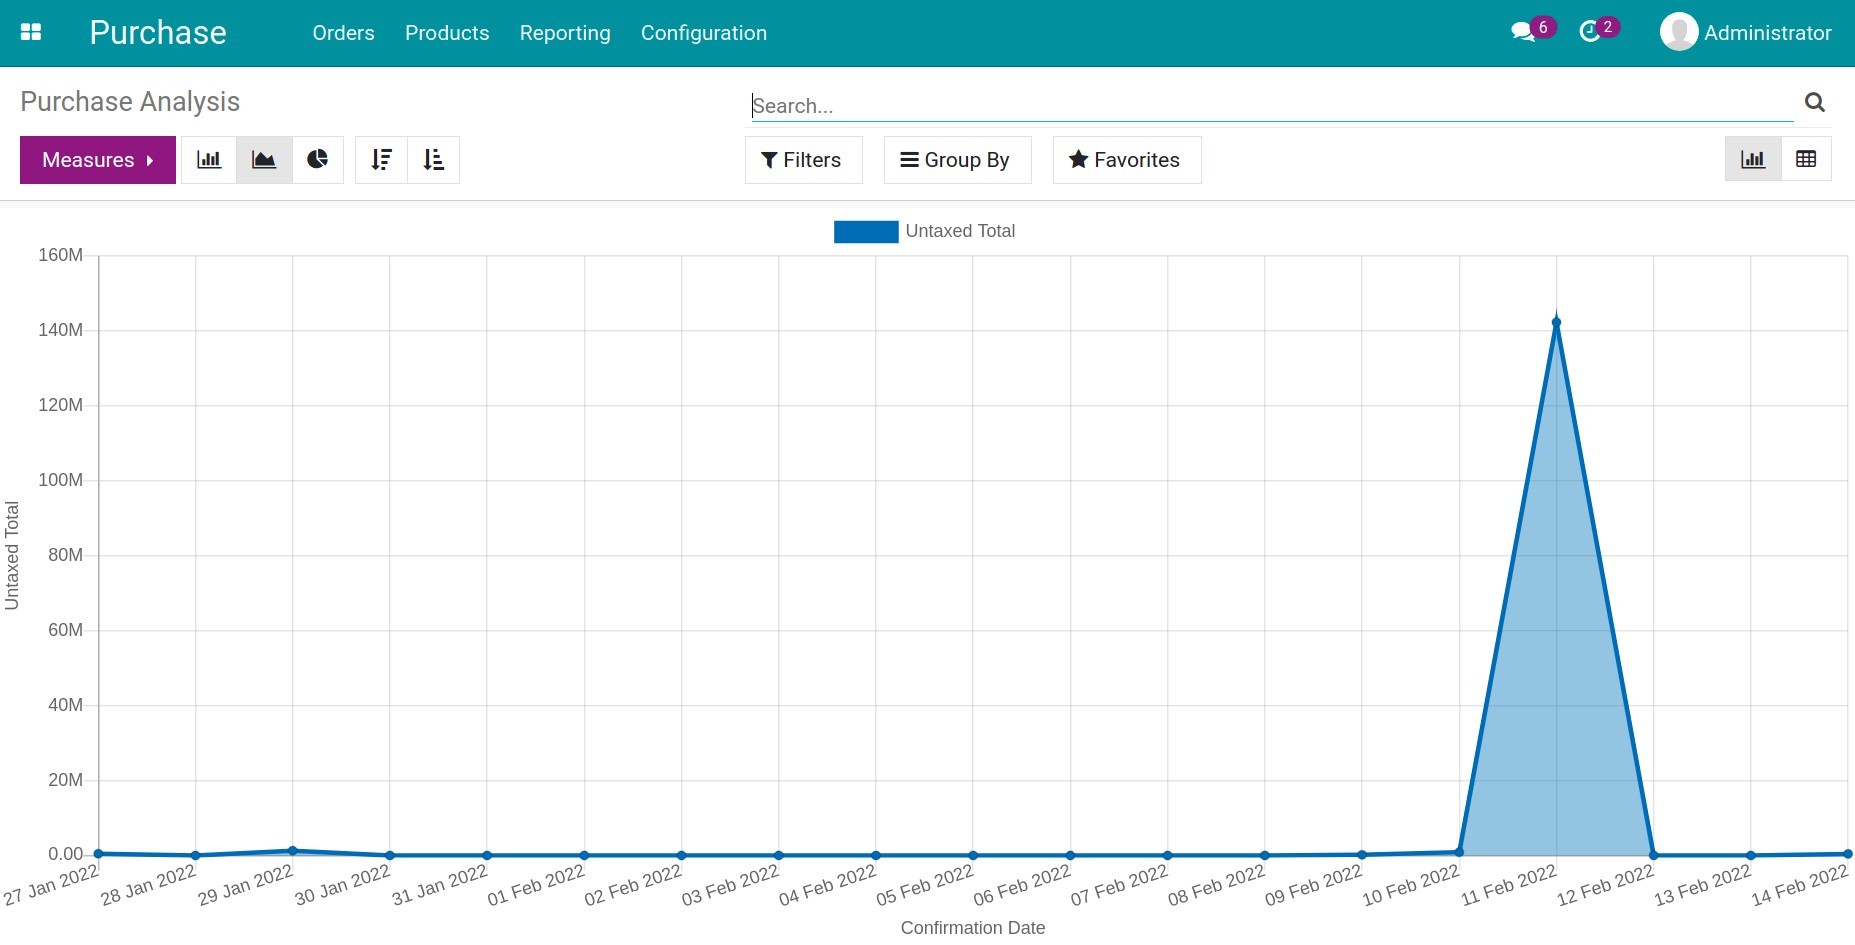
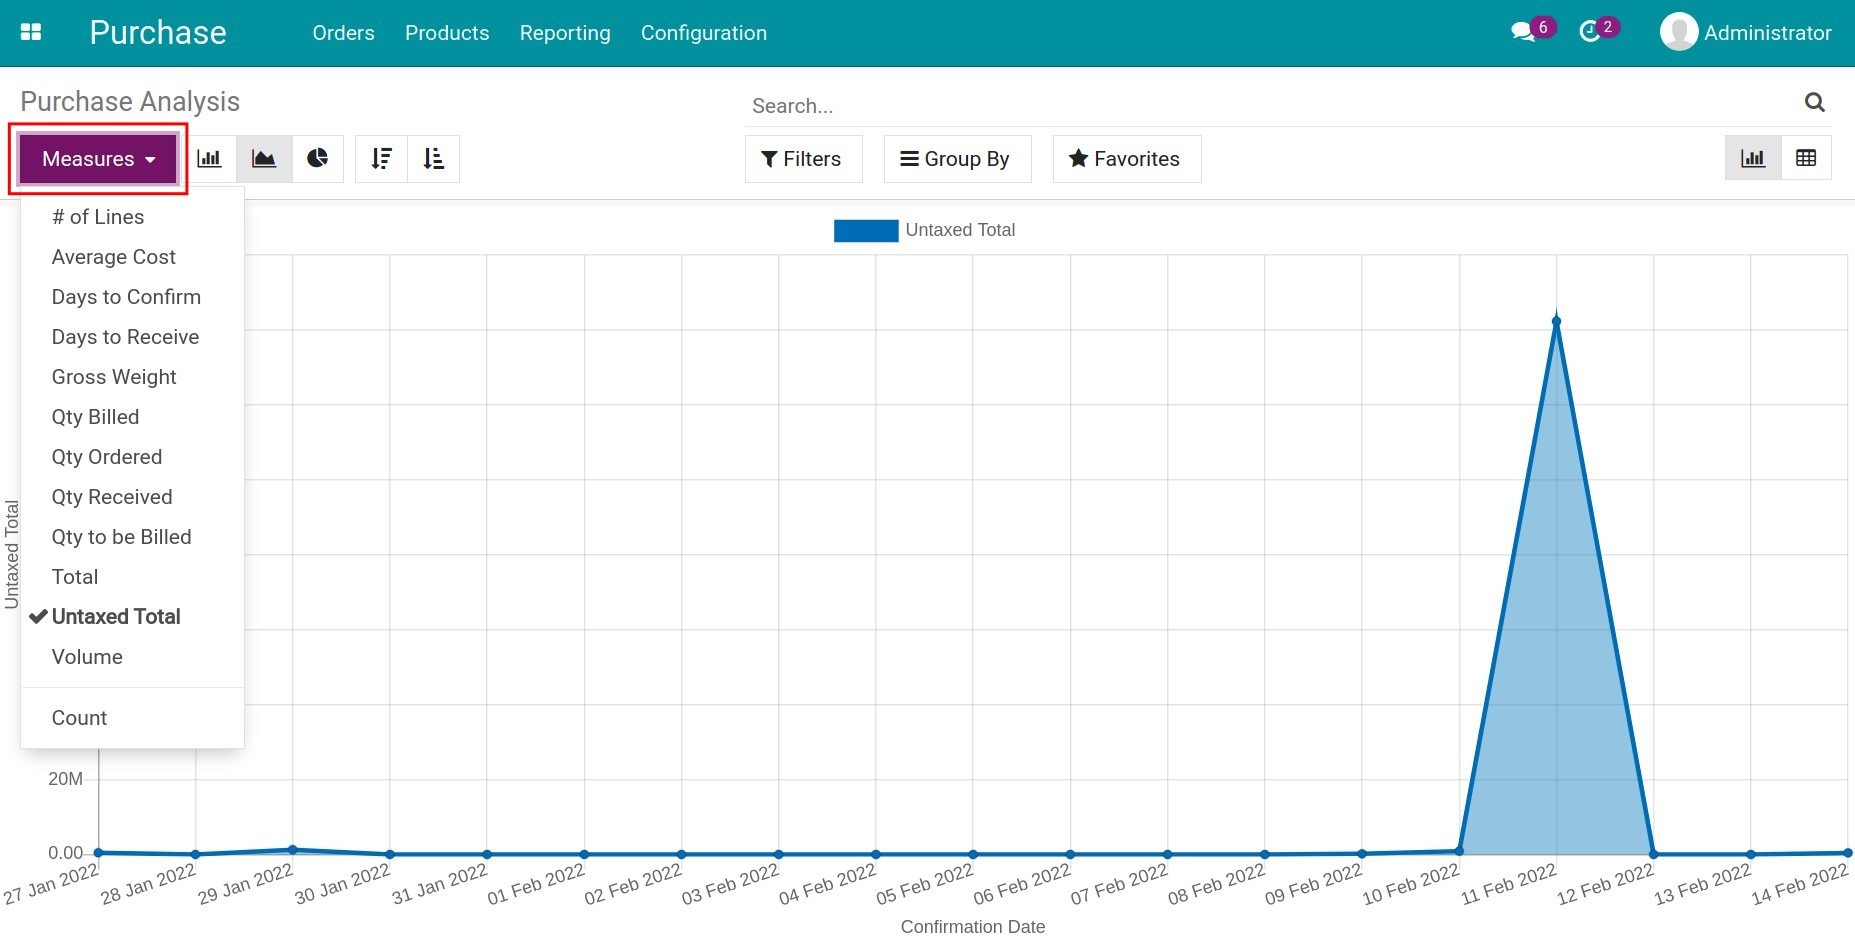
Vertical axis value: Used as the criteria in Measures. The software only allows selecting one criterion to display.
Horizontal axis value: The default setting will be according to the confirmation date of the purchase order. In case you want to change the horizontal axis value, use the Group by feature. According to the business needs, the software suggests grouping criteria by default such as by Vendor, Vendor Country, Purchasing Representative, Product, Product Category, Status, Order Date, Confirmation Date. With Add custom group you can find more criteria depending on the intended use.
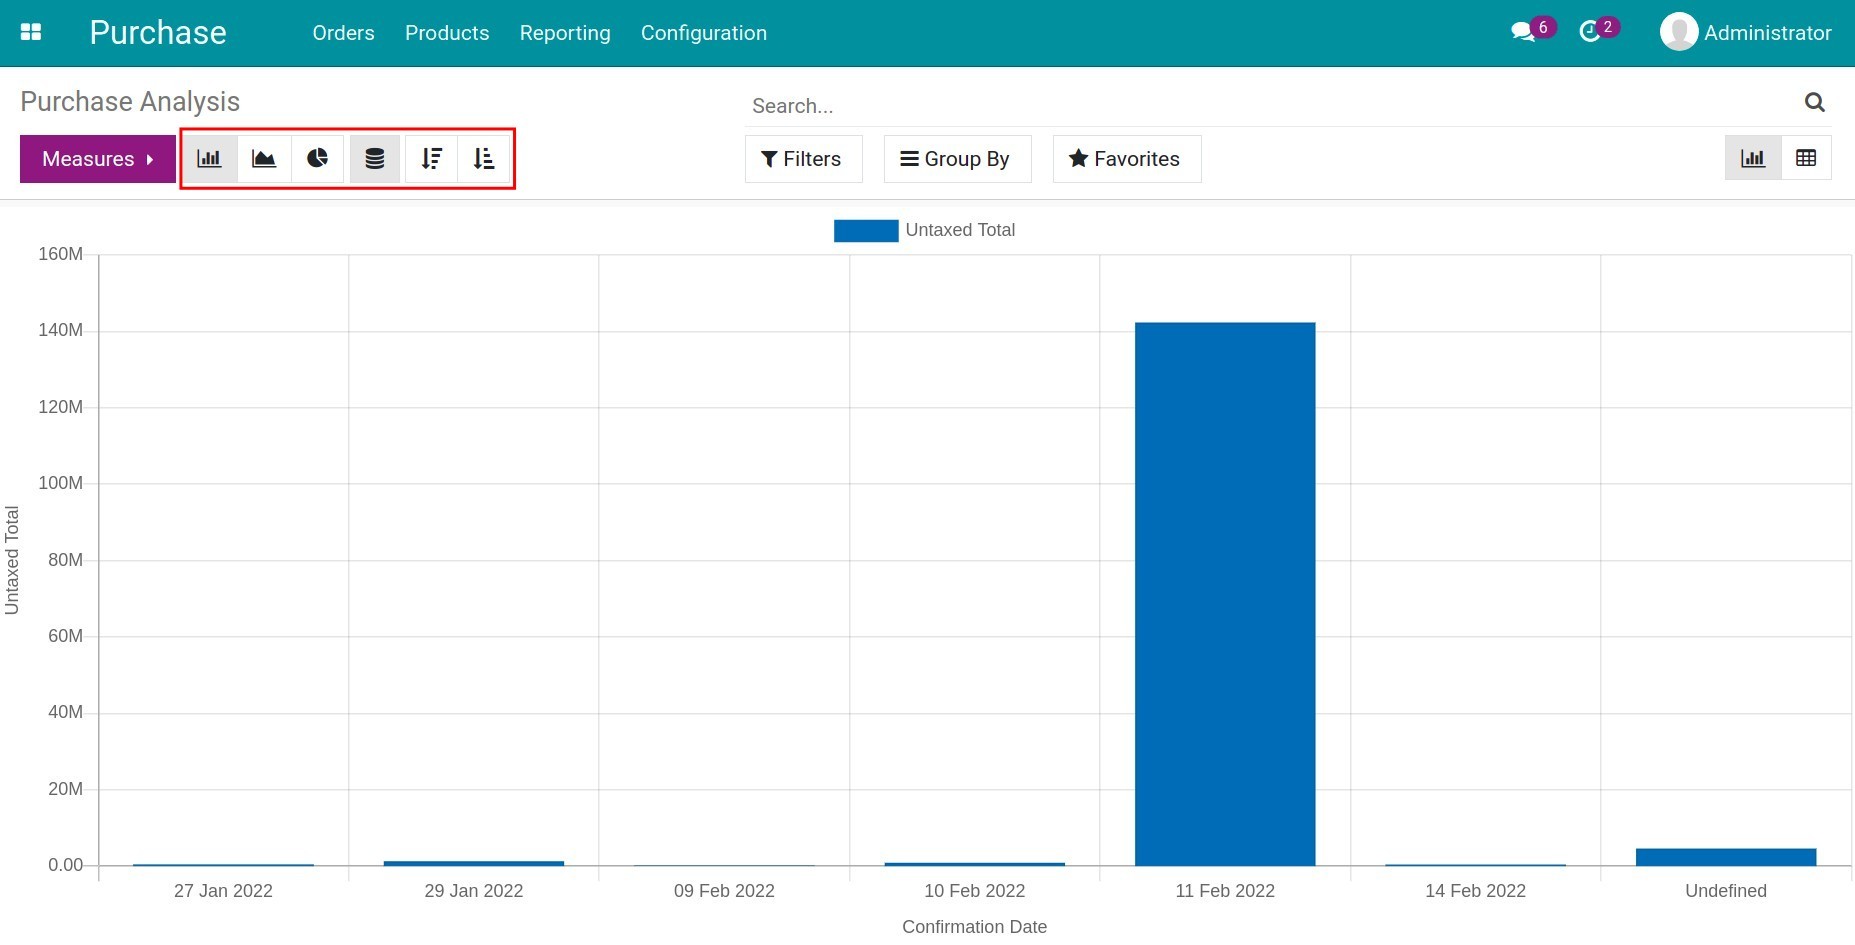
The system supports the various type of reports which are: the Bar chart, the Stacked, the Pie chart, the Line chart. You just have to swap among these symbols to view the different report interfaces. Or you also can sort the value of the horizontal axis in ascending or descending order.
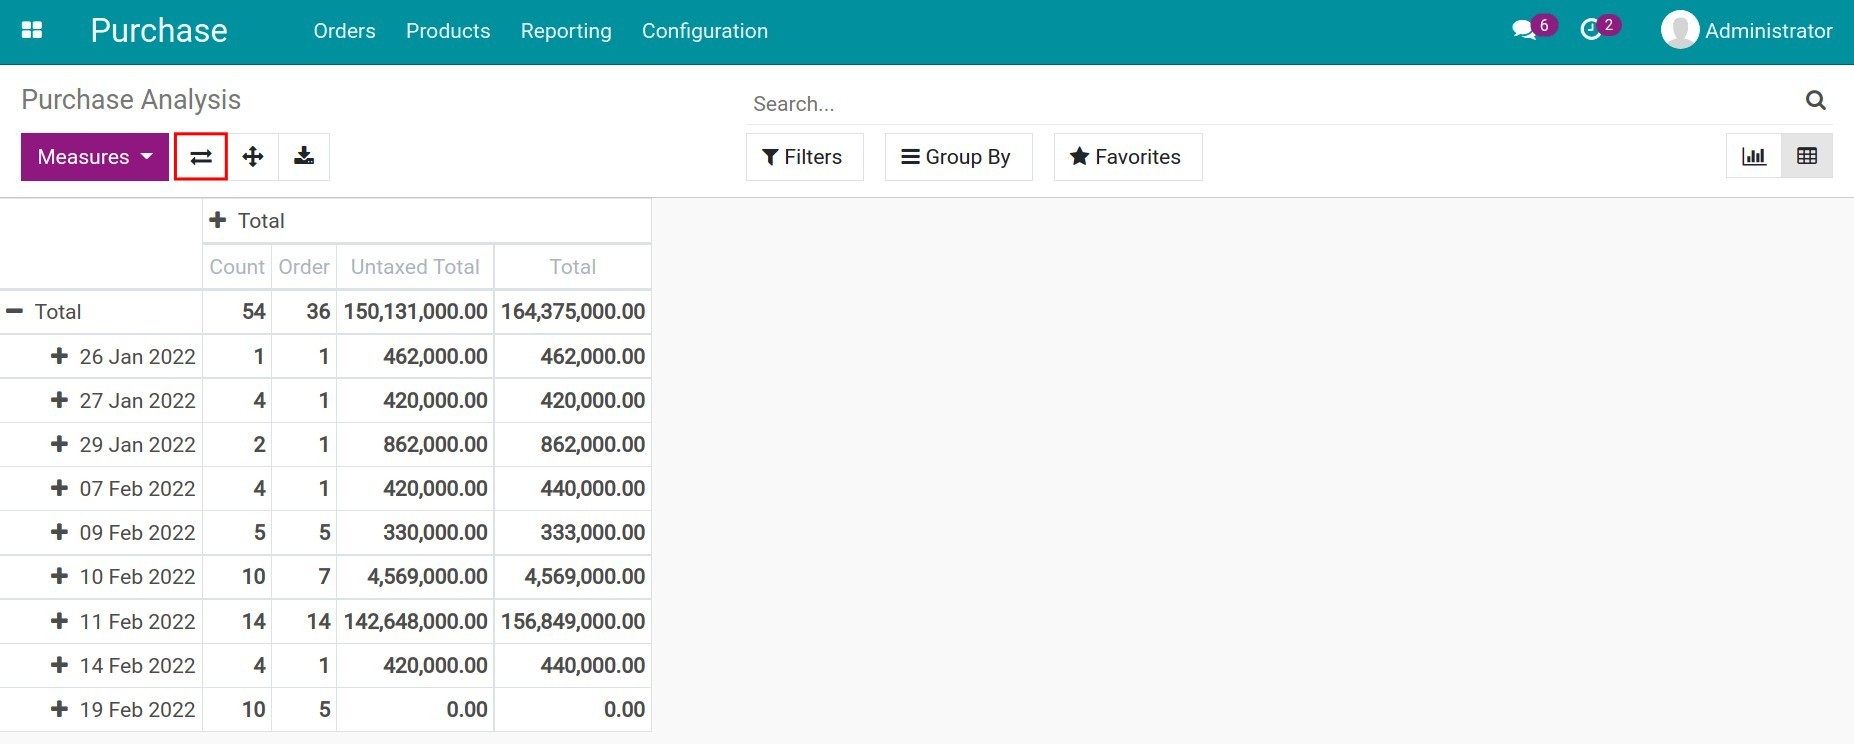
Pivot Table Report
The graph report helps you to see the fluctuation over a period of time in which related to the request for quotations/sale orders/Vendors. The pivot reports provide data to analyze those fluctuations.
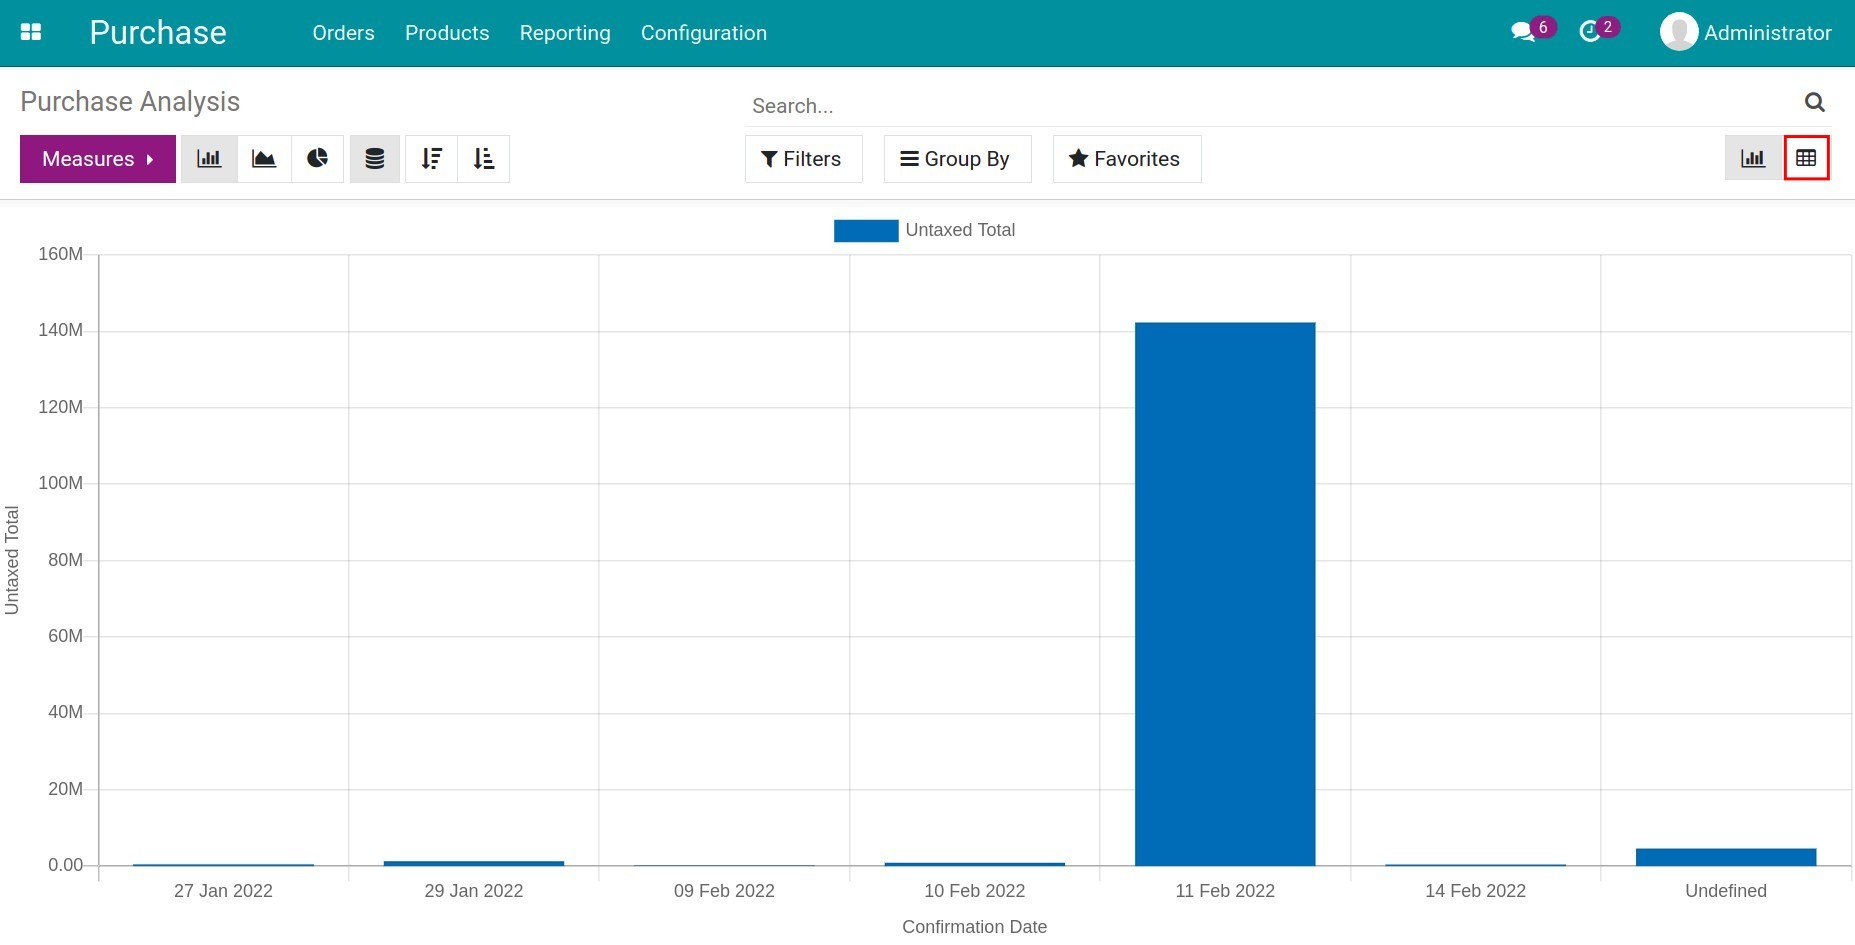
To switch to the pivot interface, you click on the table symbol on the right corner of the screen.
Now the purchase report will be changed to pivot mode. By default, the system will display the report by Product Category in the vertical column and the horizontal column by Count, Order, Untaxes Total, Total.
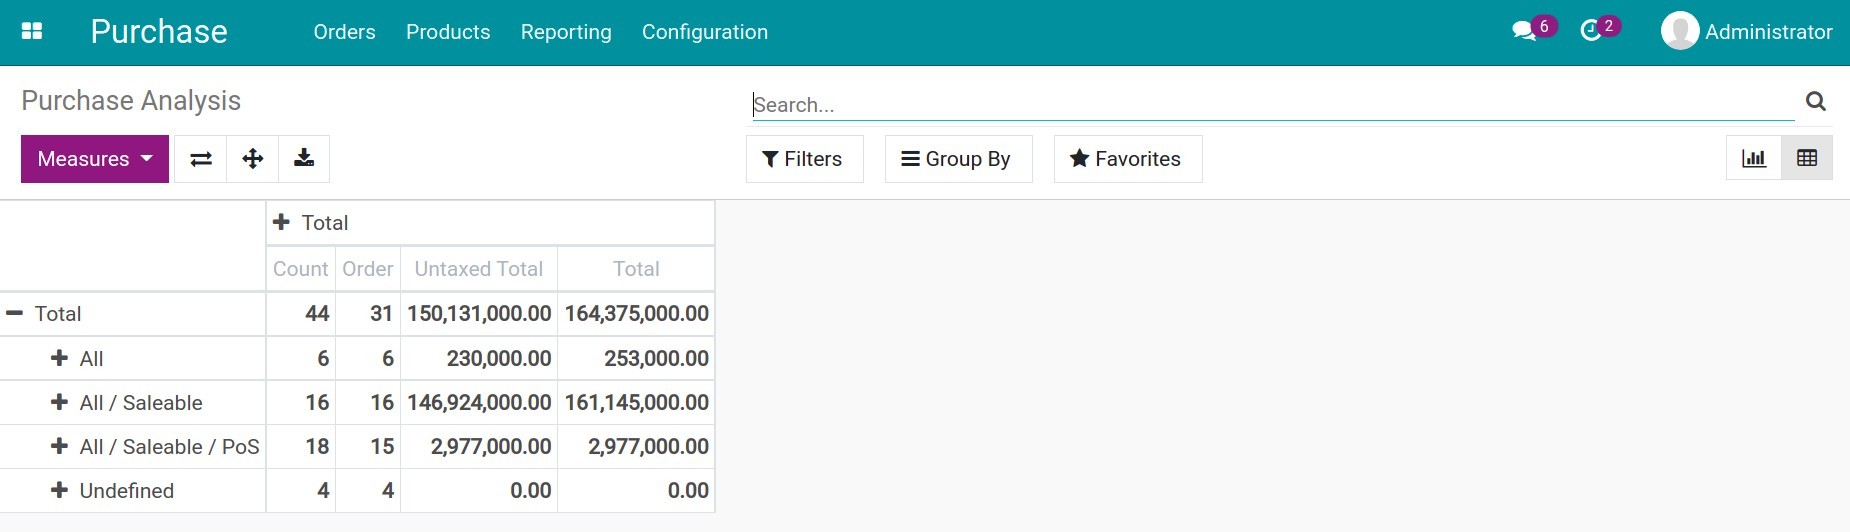
Similar to the chart format, the pivot table also uses the measure values to display in the vertical column. These values are the same as in the chart form, but the pivot format allows the user to combine multiple measure values at the same time.
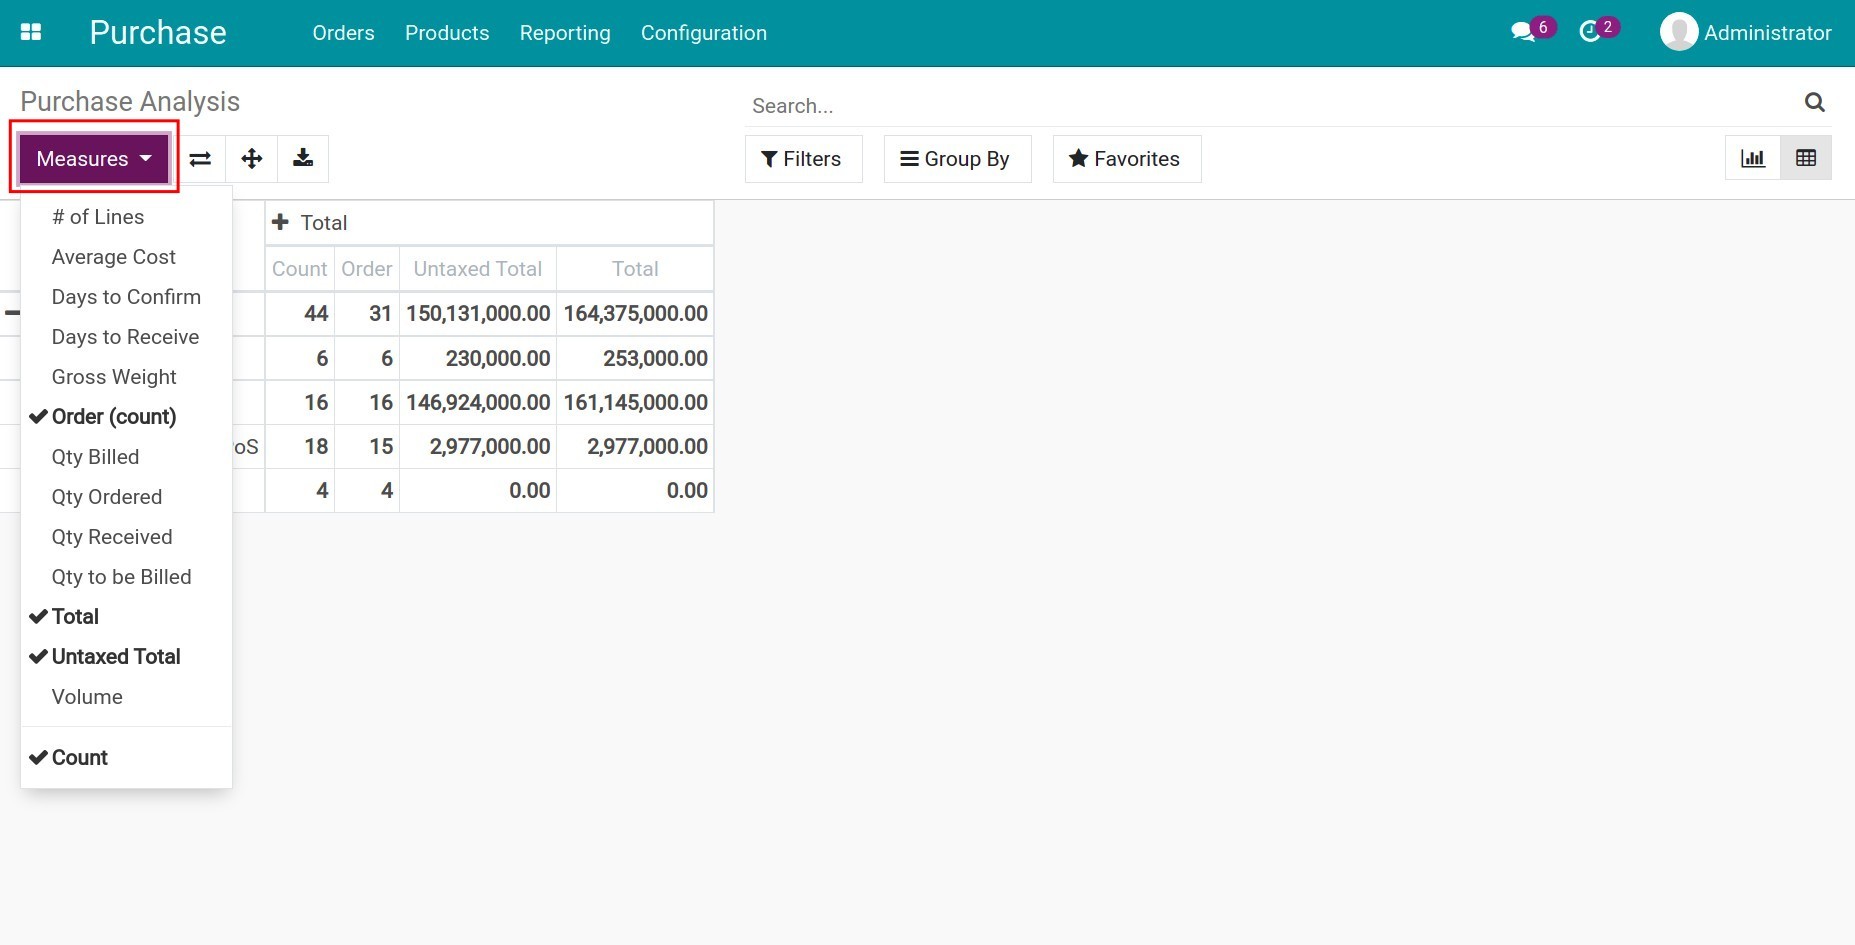
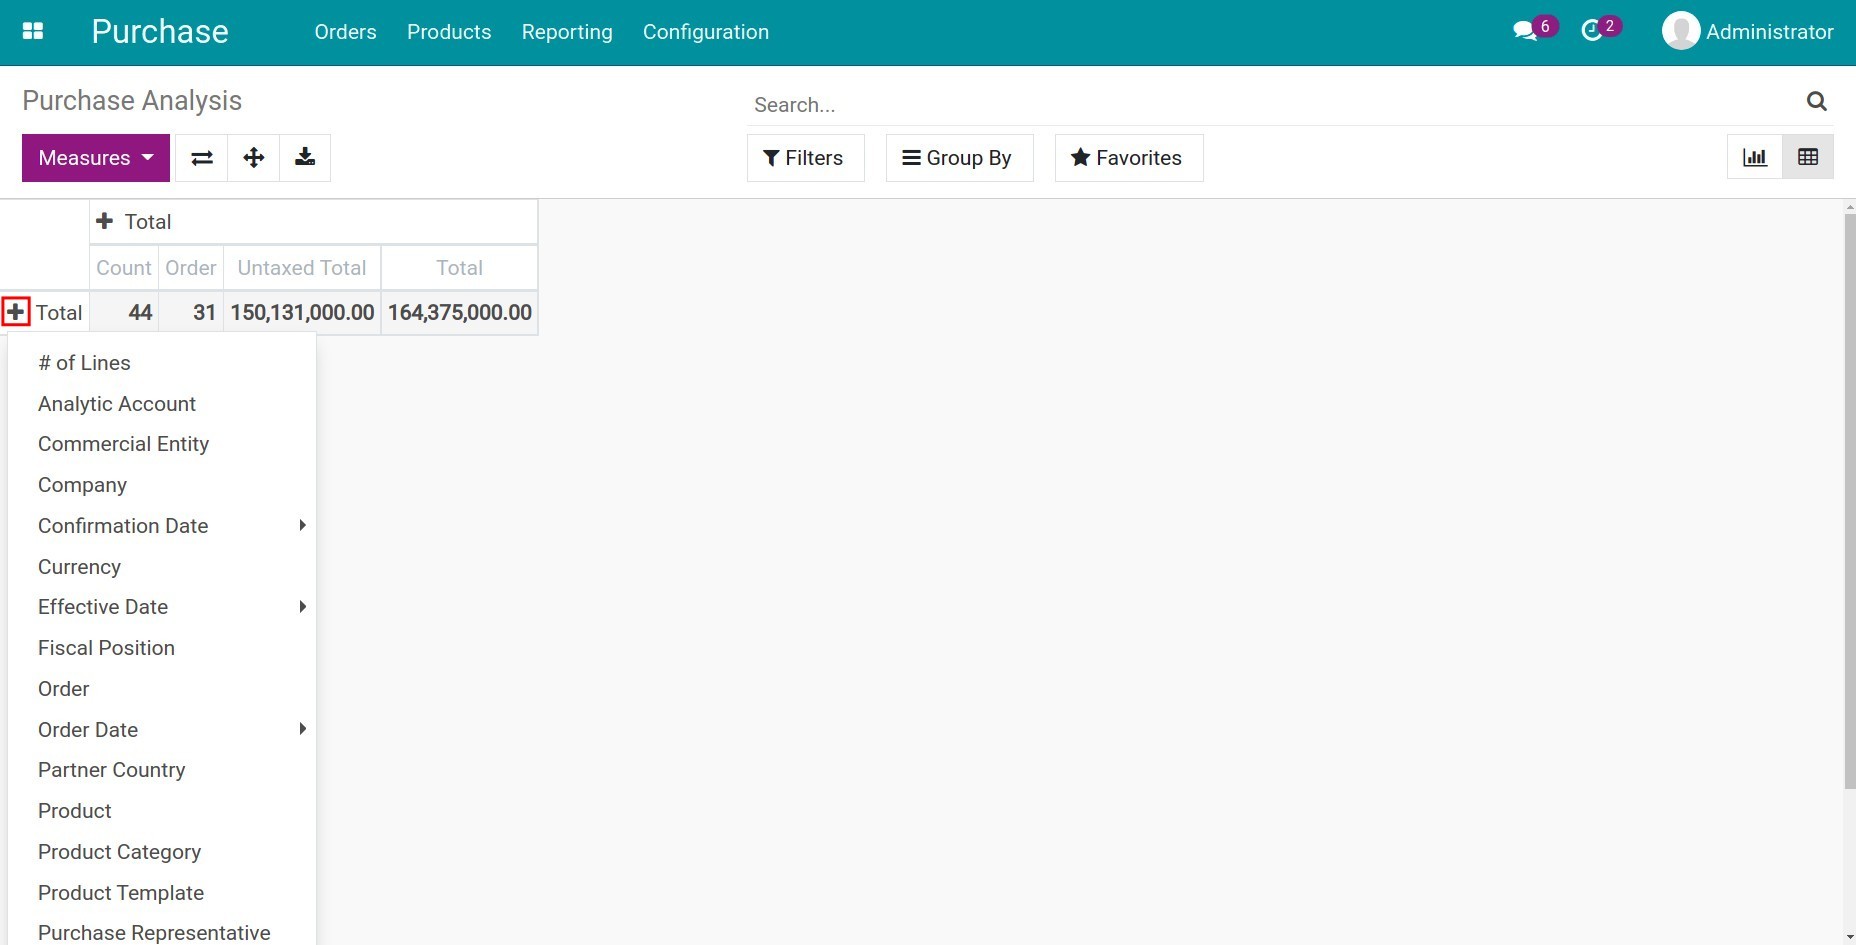
When you hit on the + symbol, you can select the criteria you want to see. For instance, viewing the report by Product, Purchase order, Vendor, etc.
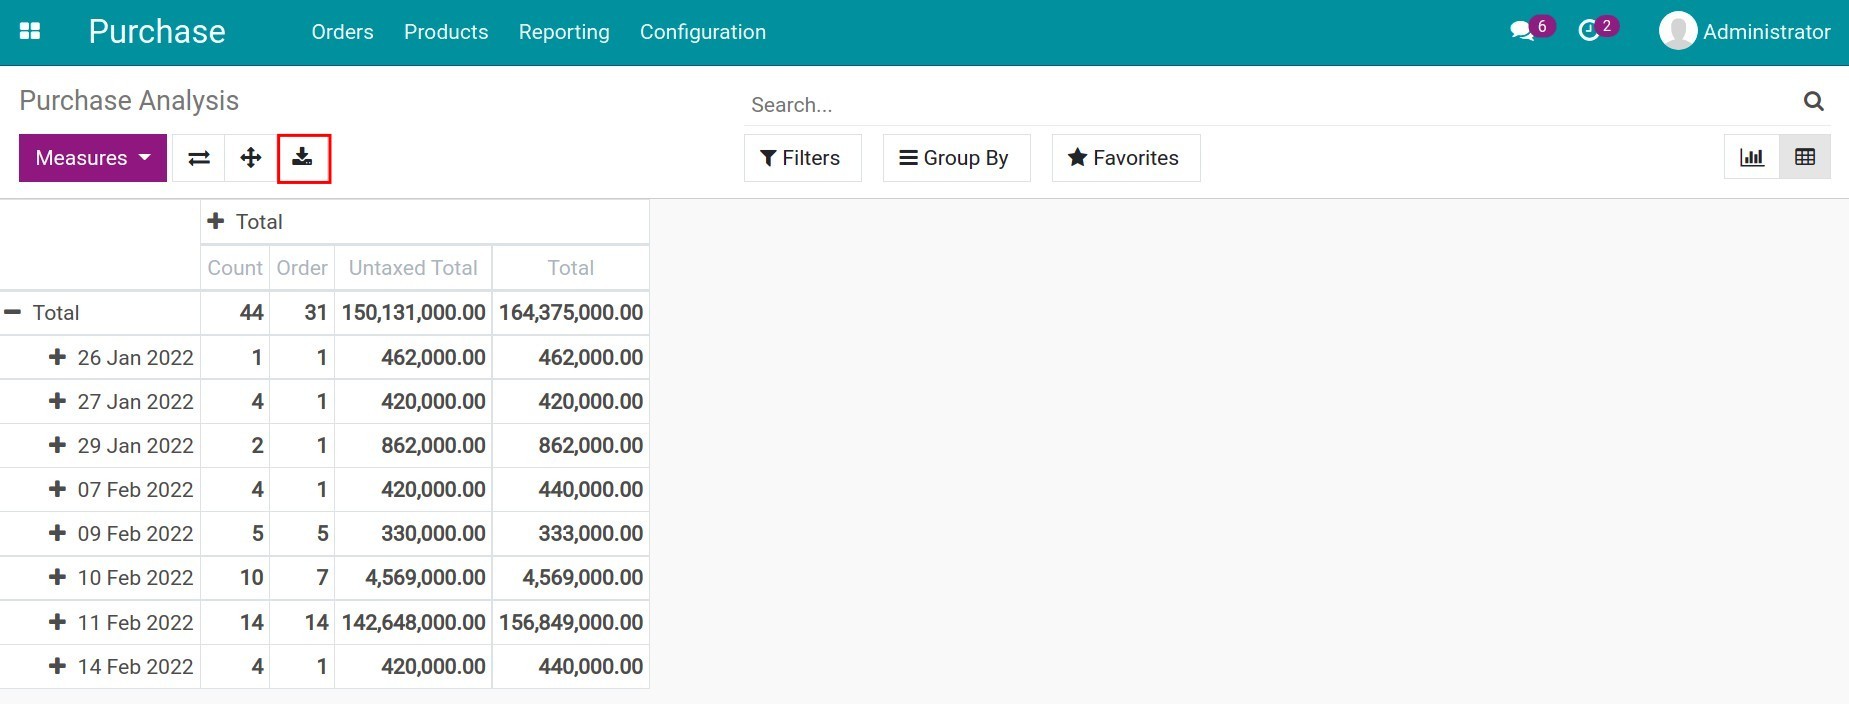
Not only you can view the report directly on the software, you can also export the report with the selected criteria to excel by clicking on the Download xlsx button.
In addition, you can switch the positions of all criteria in columns and rows for each other.