Visual Accounting Analysis (with Pivot and Graph)
Viindoo Accounting app provides you with a set of dynamic accounting analysis reports with intuitive visualization in pivot or graph, giving you a more in-depth analysis of financial accounts and management accounting accounts.
Entries Analysis Report
The journal entries analysis report is built based on the analysis of journal entries generated in the accounting system through measures and filtering/grouping criteria. From this analysis, you can get the best overview of the company’s accounting situation.
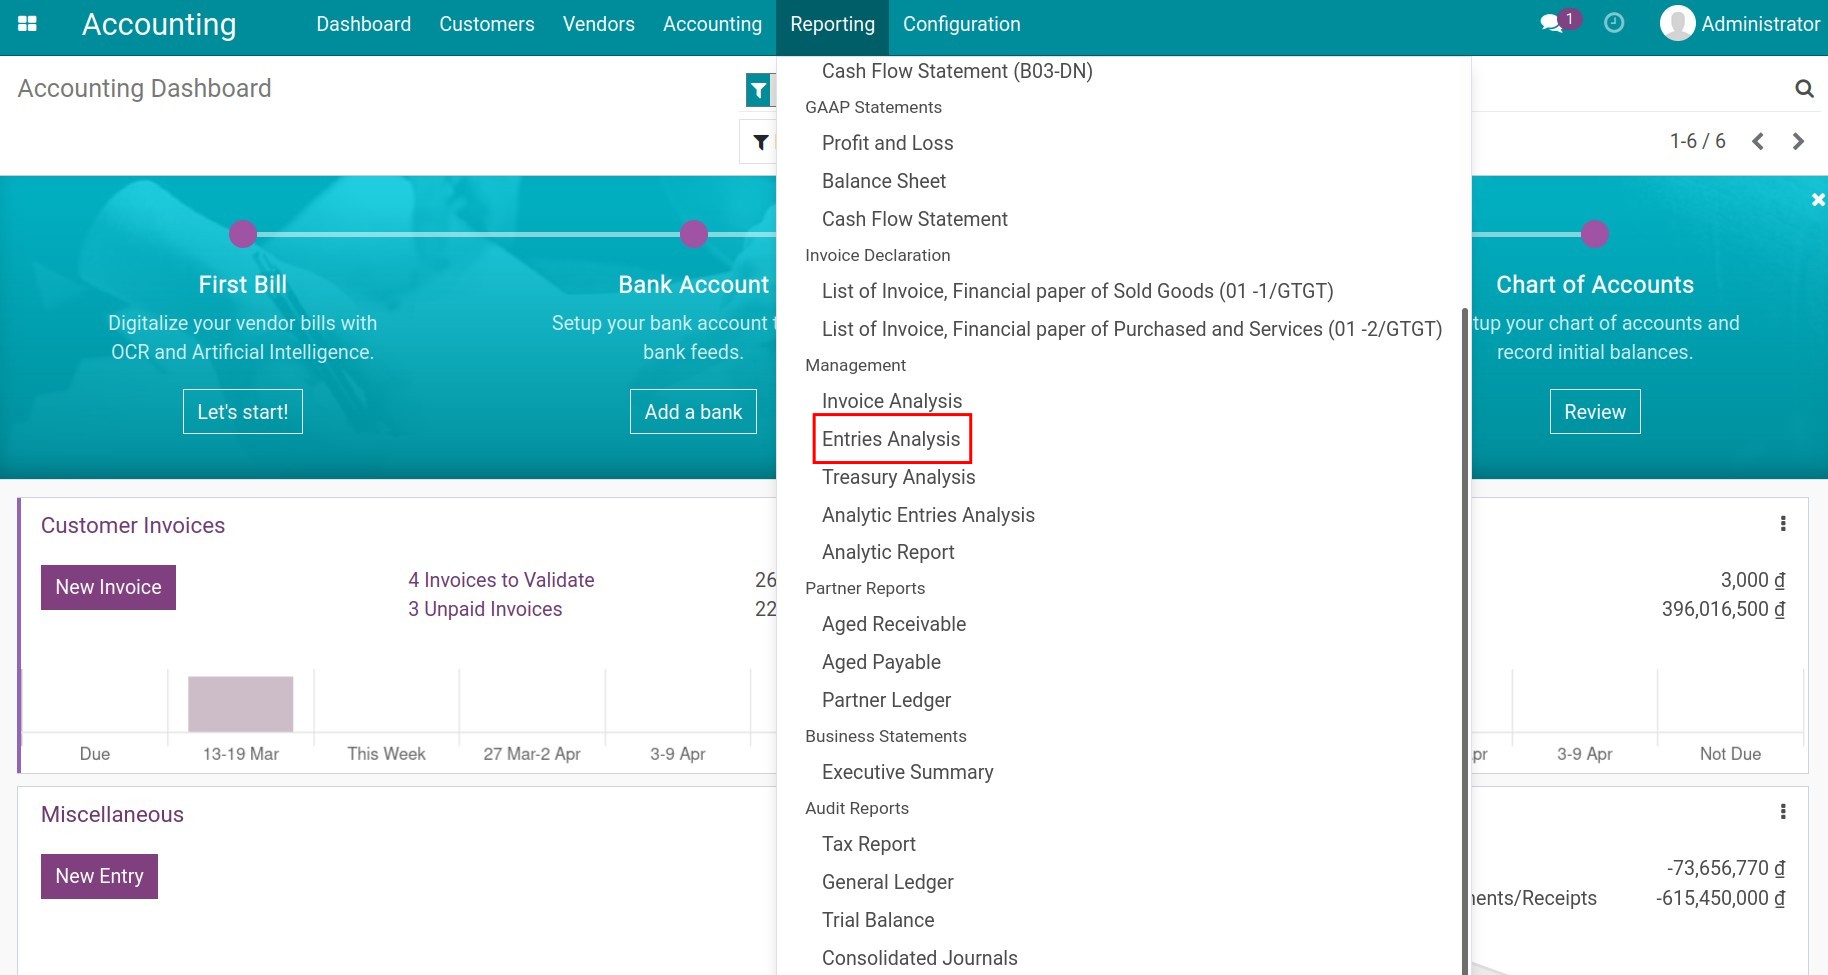
To view the journal entries analysis report, navigate to Accounting ‣ Reporting ‣ Entries Analysis:
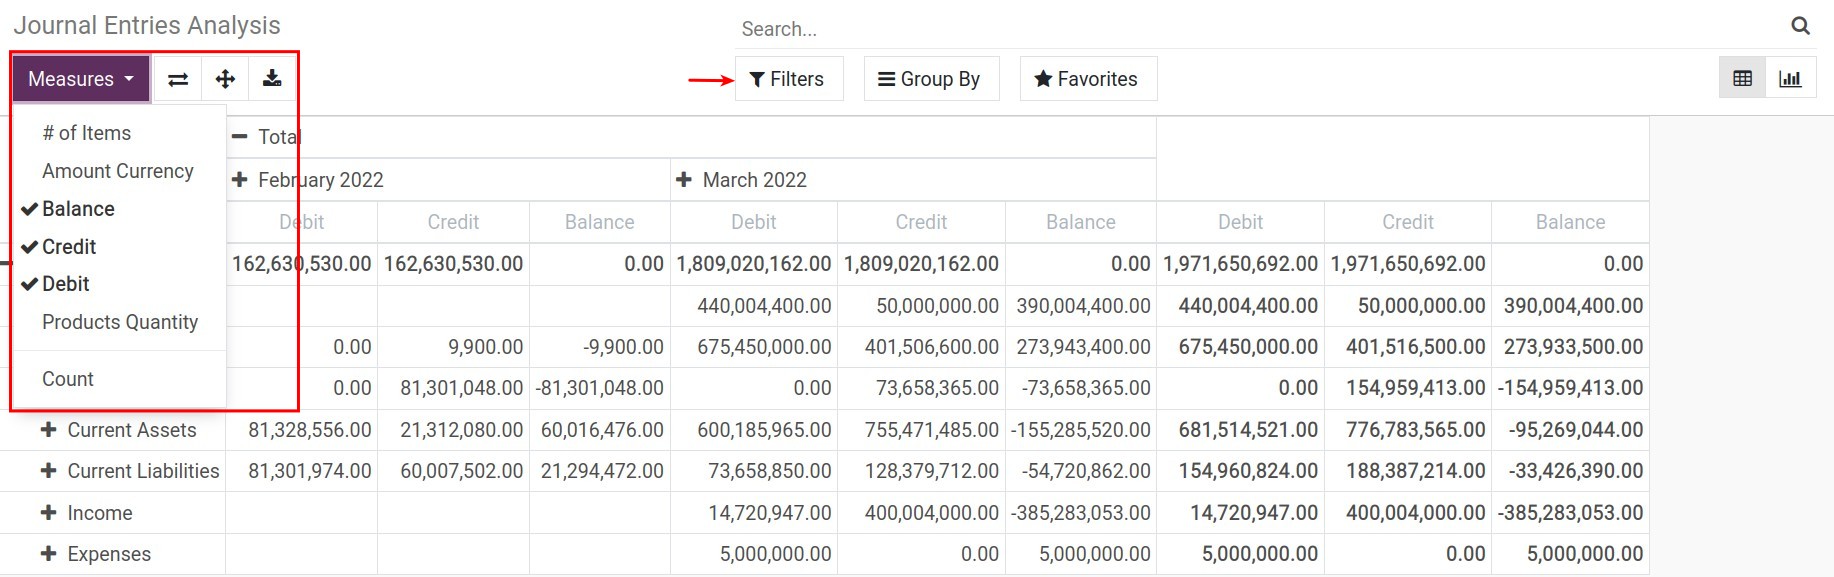
Depending on your needs, you can flexibly use the following measures:
![Measures for journal entries analysis - Viindoo Accounting software]()
Credit;
Debit;
Balance;
Amount Currency;
# of Items;
Products Quantity;
Count.
Besides, depending on the purpose, you can use the filter and grouping tools to view the report in other criteria.
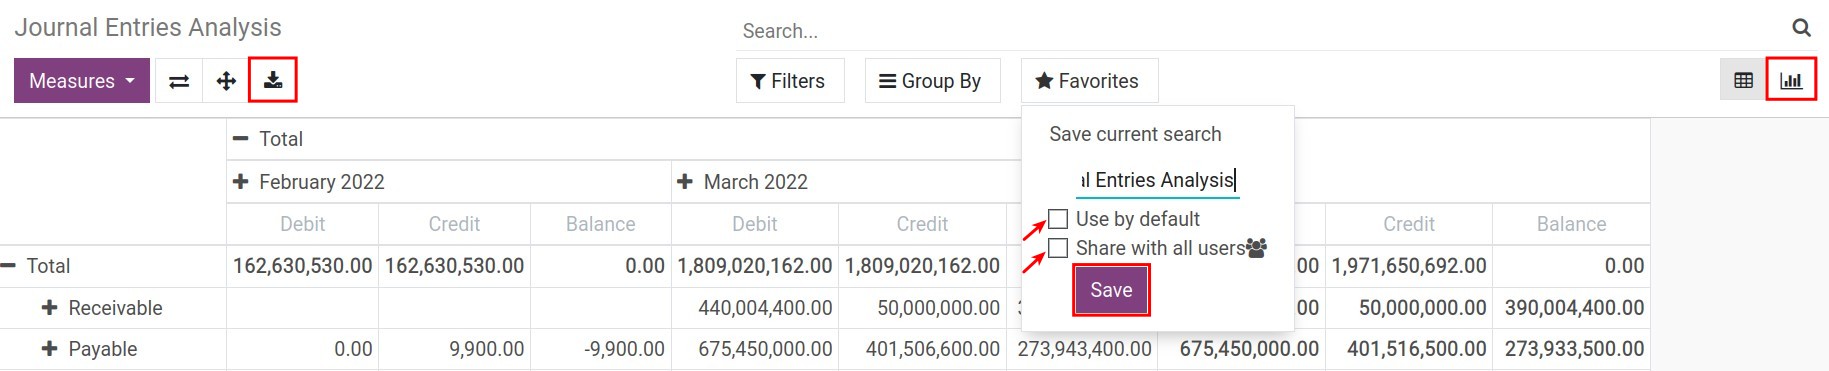
You can save the report as favorites to use as default later on or share it with other users:
![Save current search as favorite - Viindoo Accounting app]()
Supported report types:
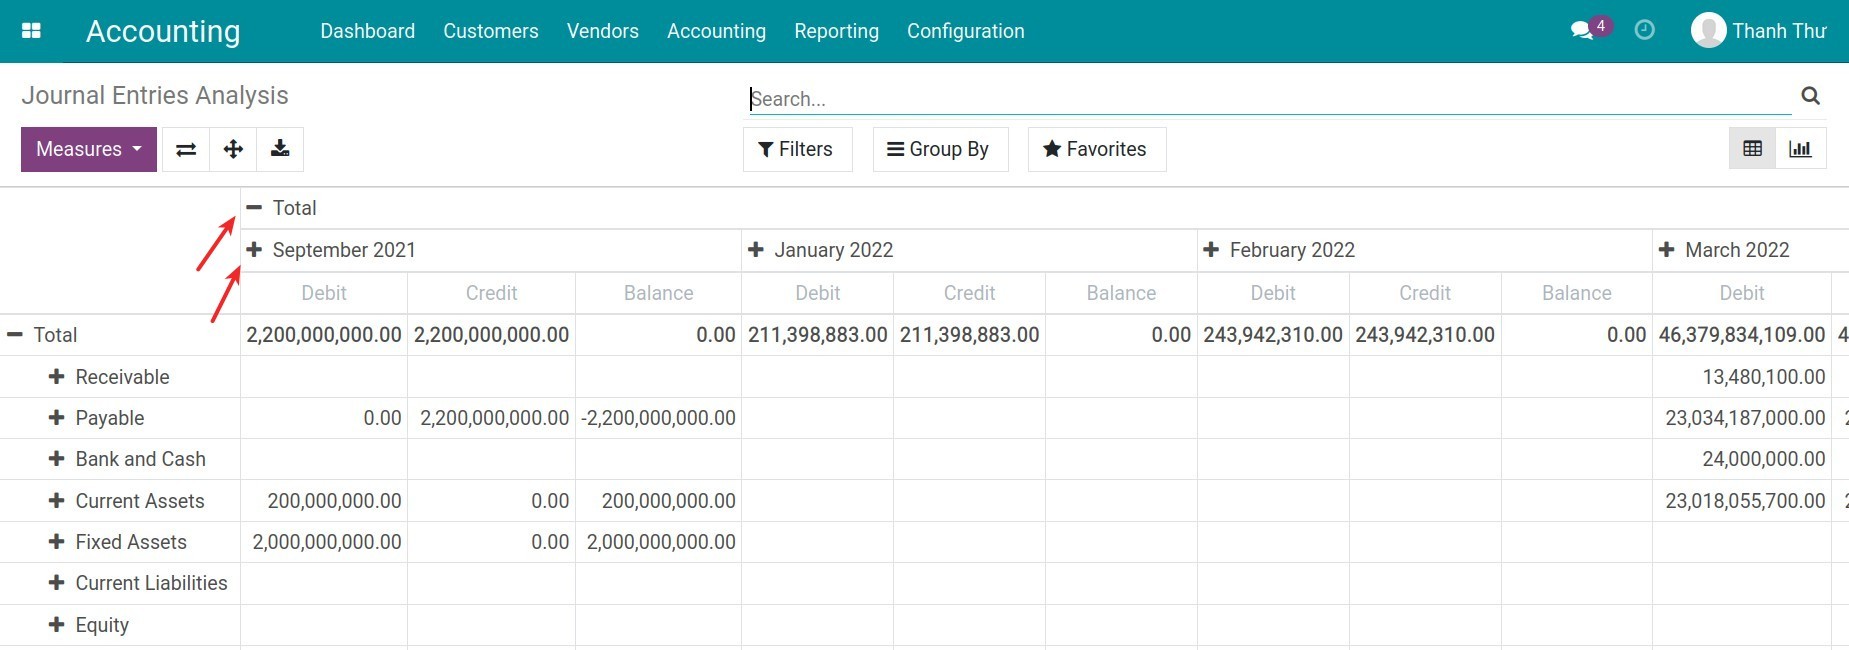
Dynamic pivot report, user-friendly and can be downloaded to an excel file. You can click on the “+”/”-” icon to extend/close the evaluation criteria:
![Pivot journal entries analysis report - Viindoo Accounting software]()
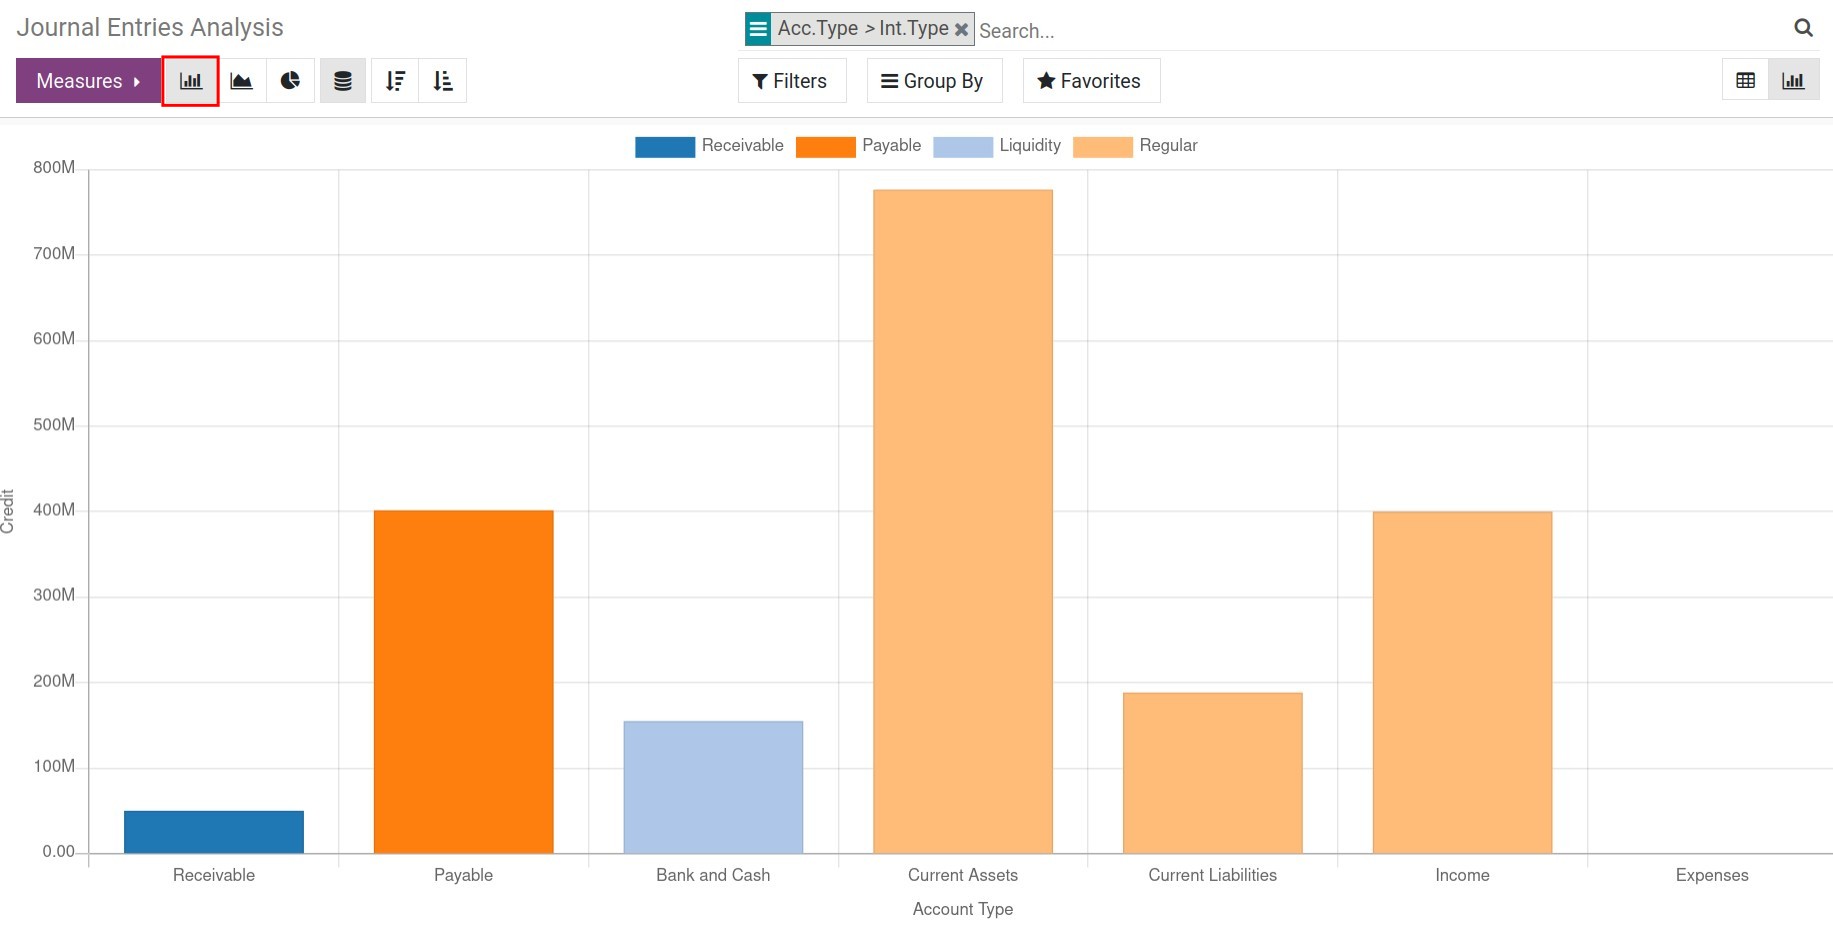
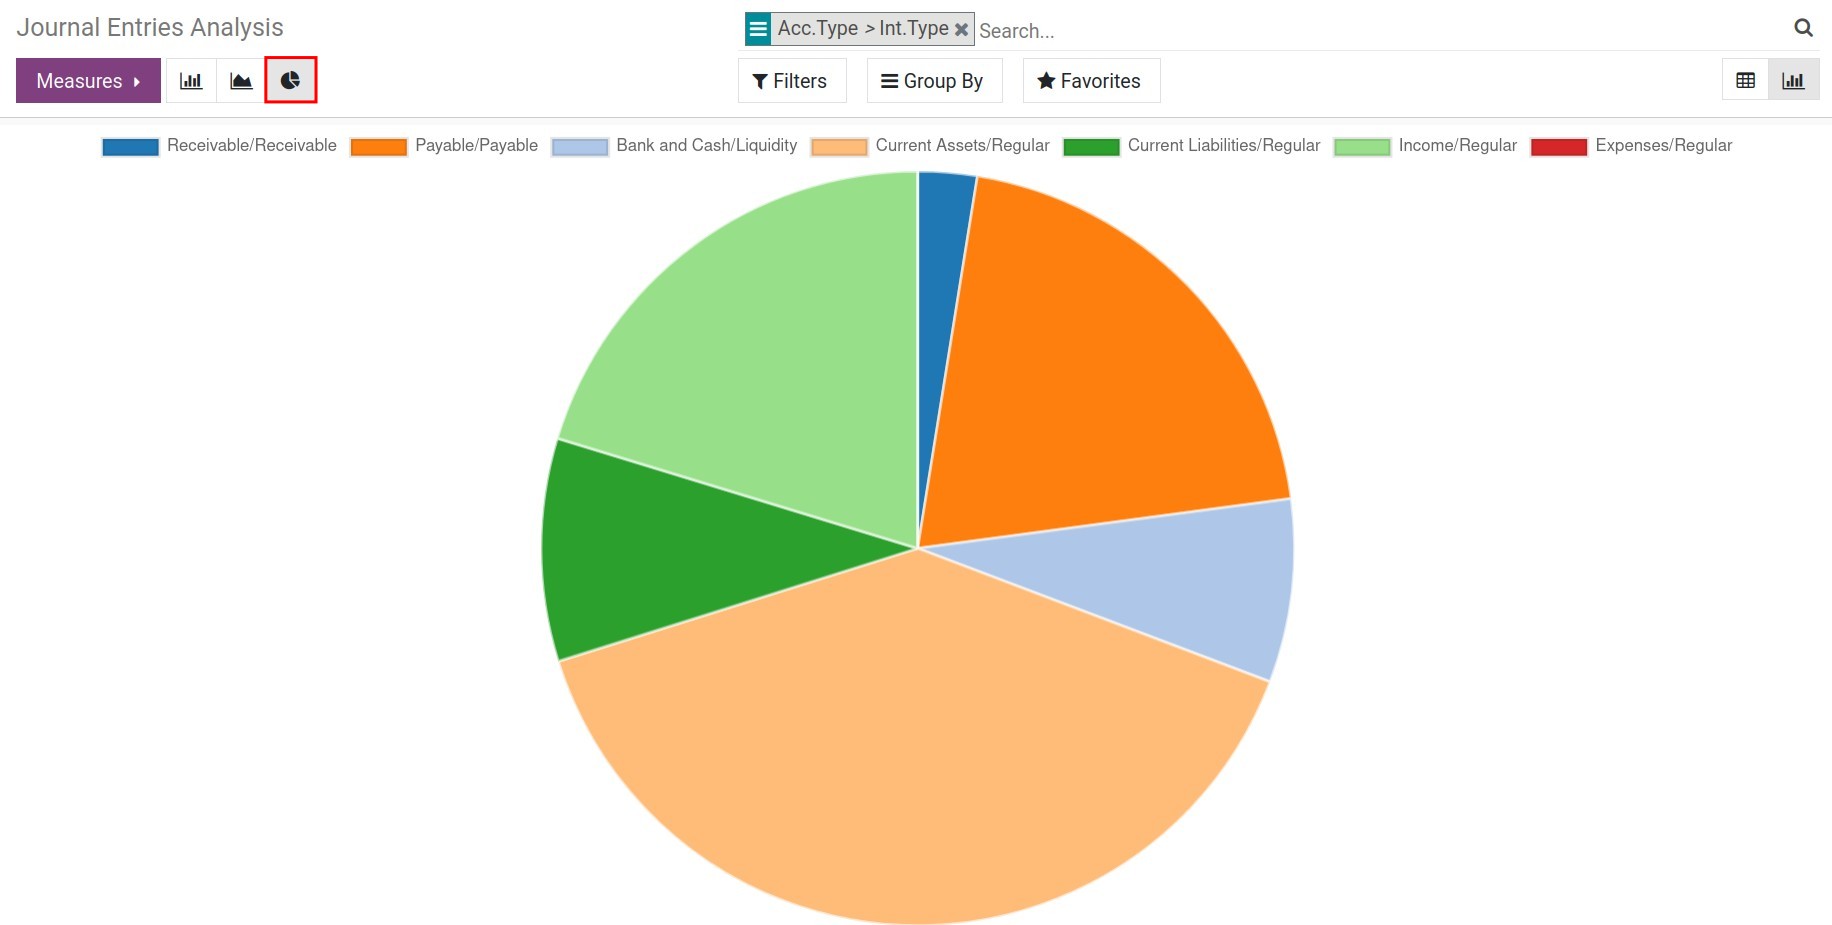
Report visual graph can be viewed in various types such as bar, line, or pie chart:
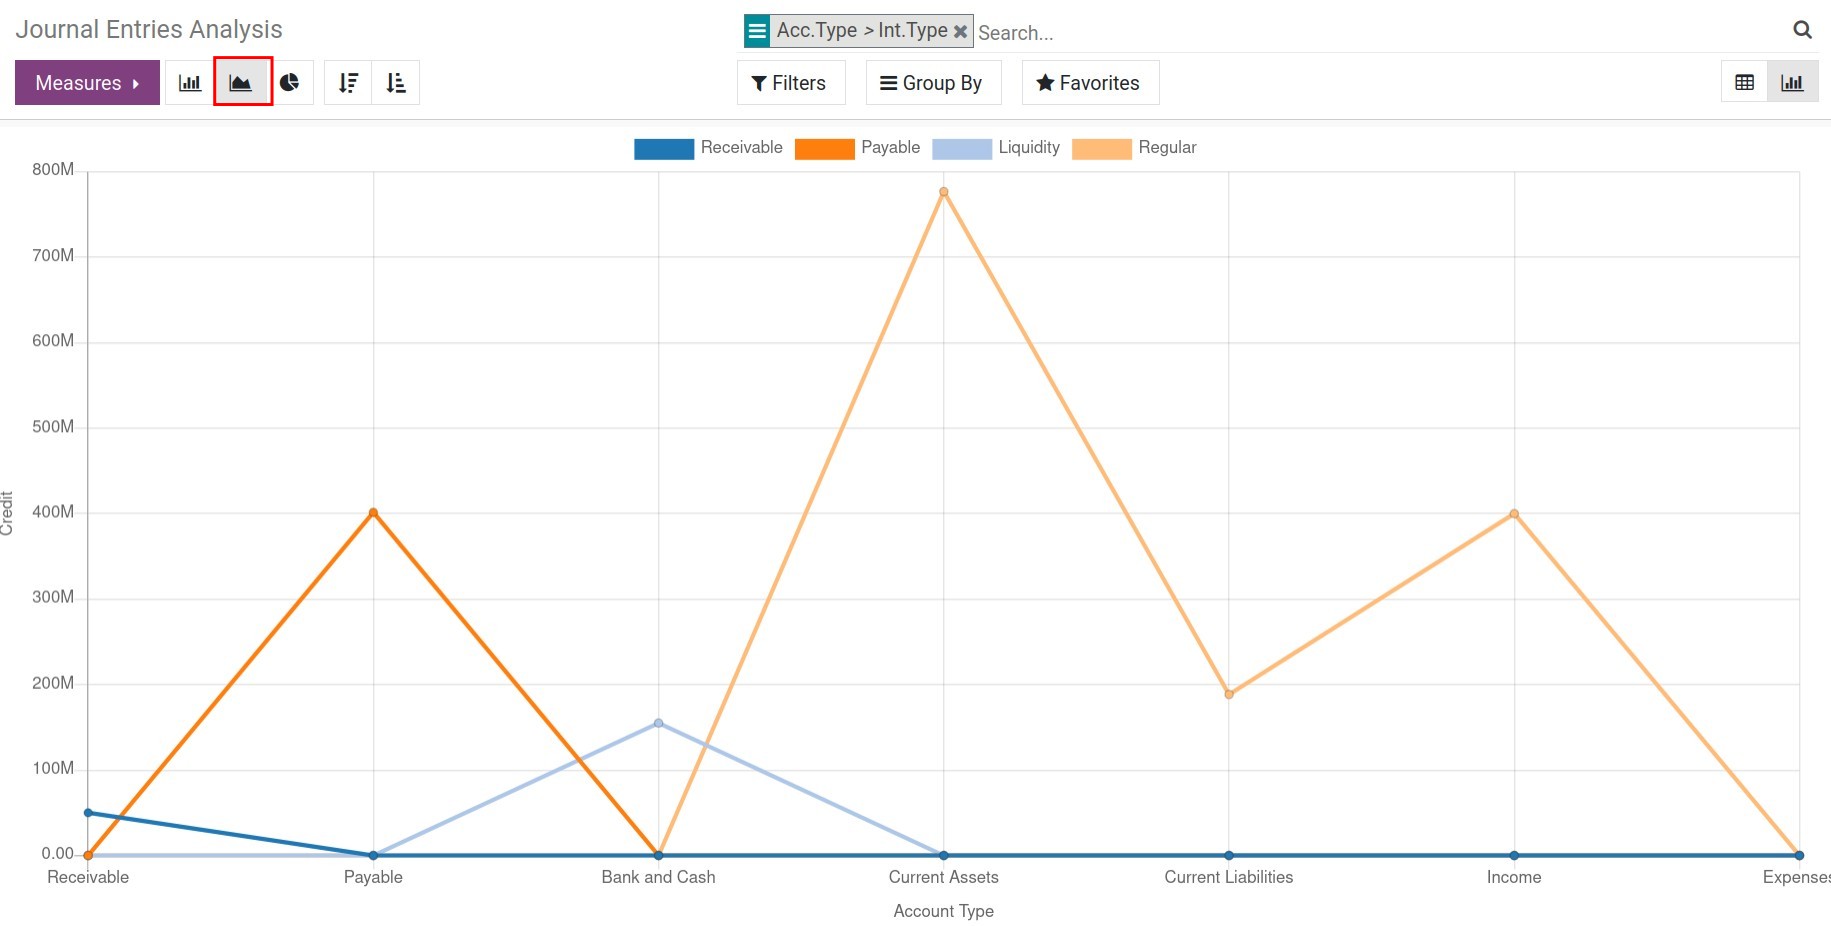
Bar chart![Journal entries analysis report in bar chart - Viindoo Accounting app]() Line chart
Line chart![Journal entries analysis report in line chart - Viindoo Accounting app]() Pie chart
Pie chart![Journal entries analysis report in pie chart - Viindoo Accounting software]()
Analytic Entries Analysis Report
The Analytic Entries Analysis Report provides you with a tool to analyze analytic entries, which gives managers a multi-dimensional overview of the analytic entries.
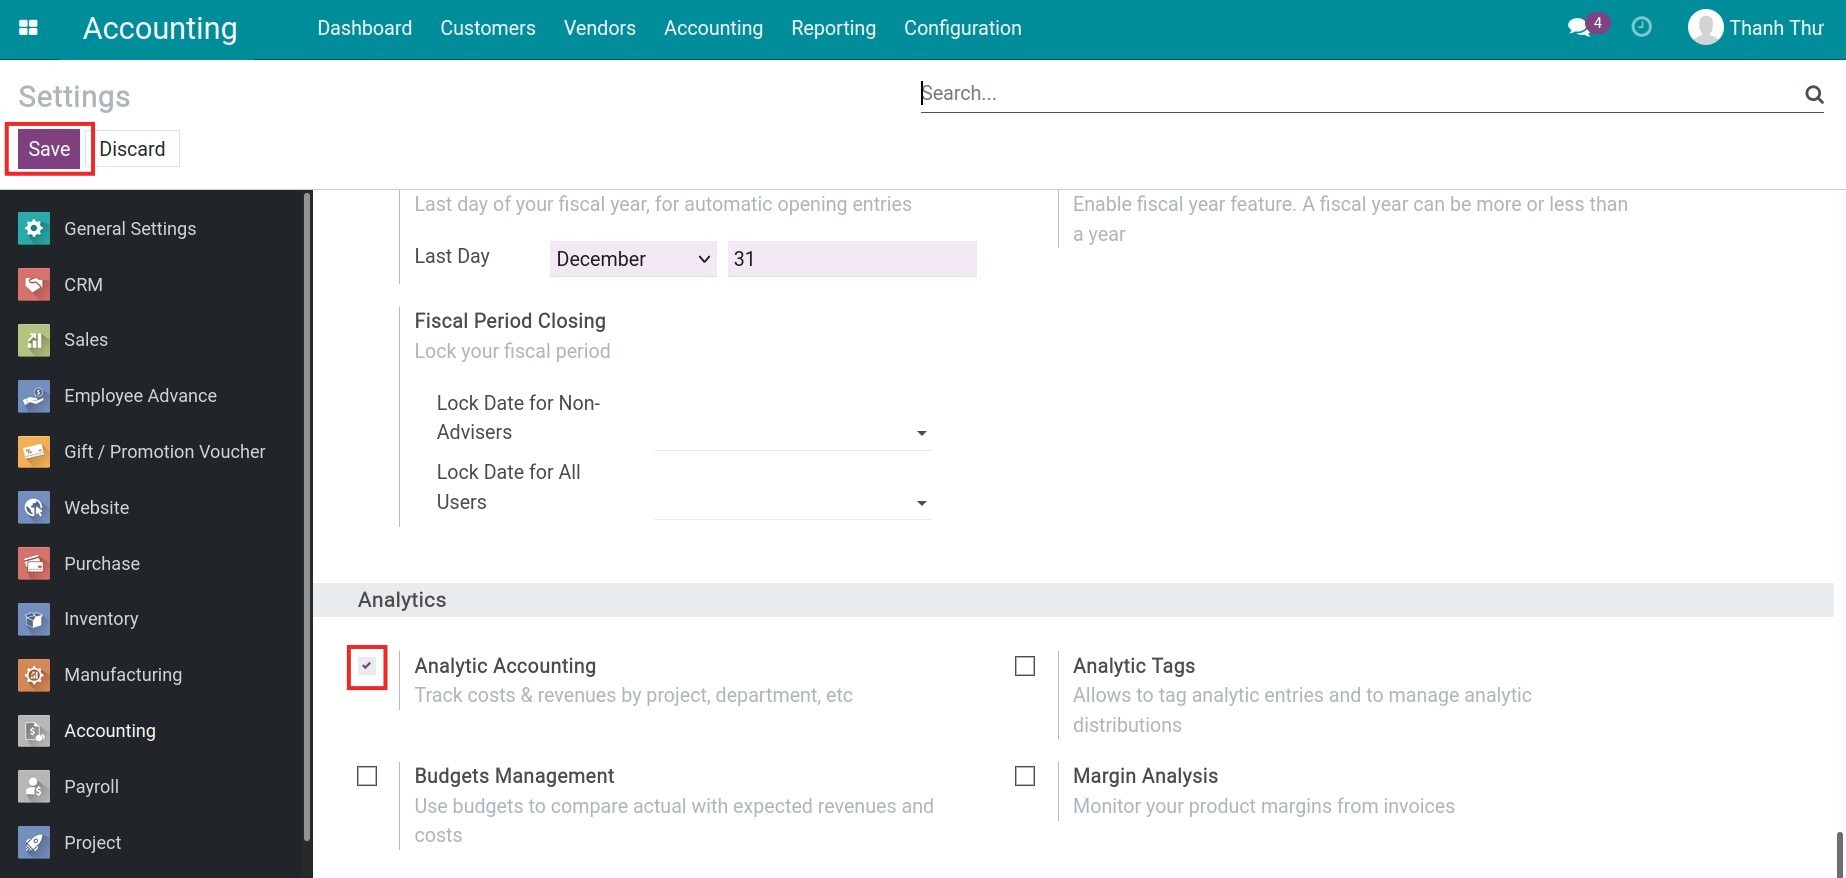
To see this report, you need to go to Accounting > Configure > Settings, turn on Analytic Accounting feature then press Save.
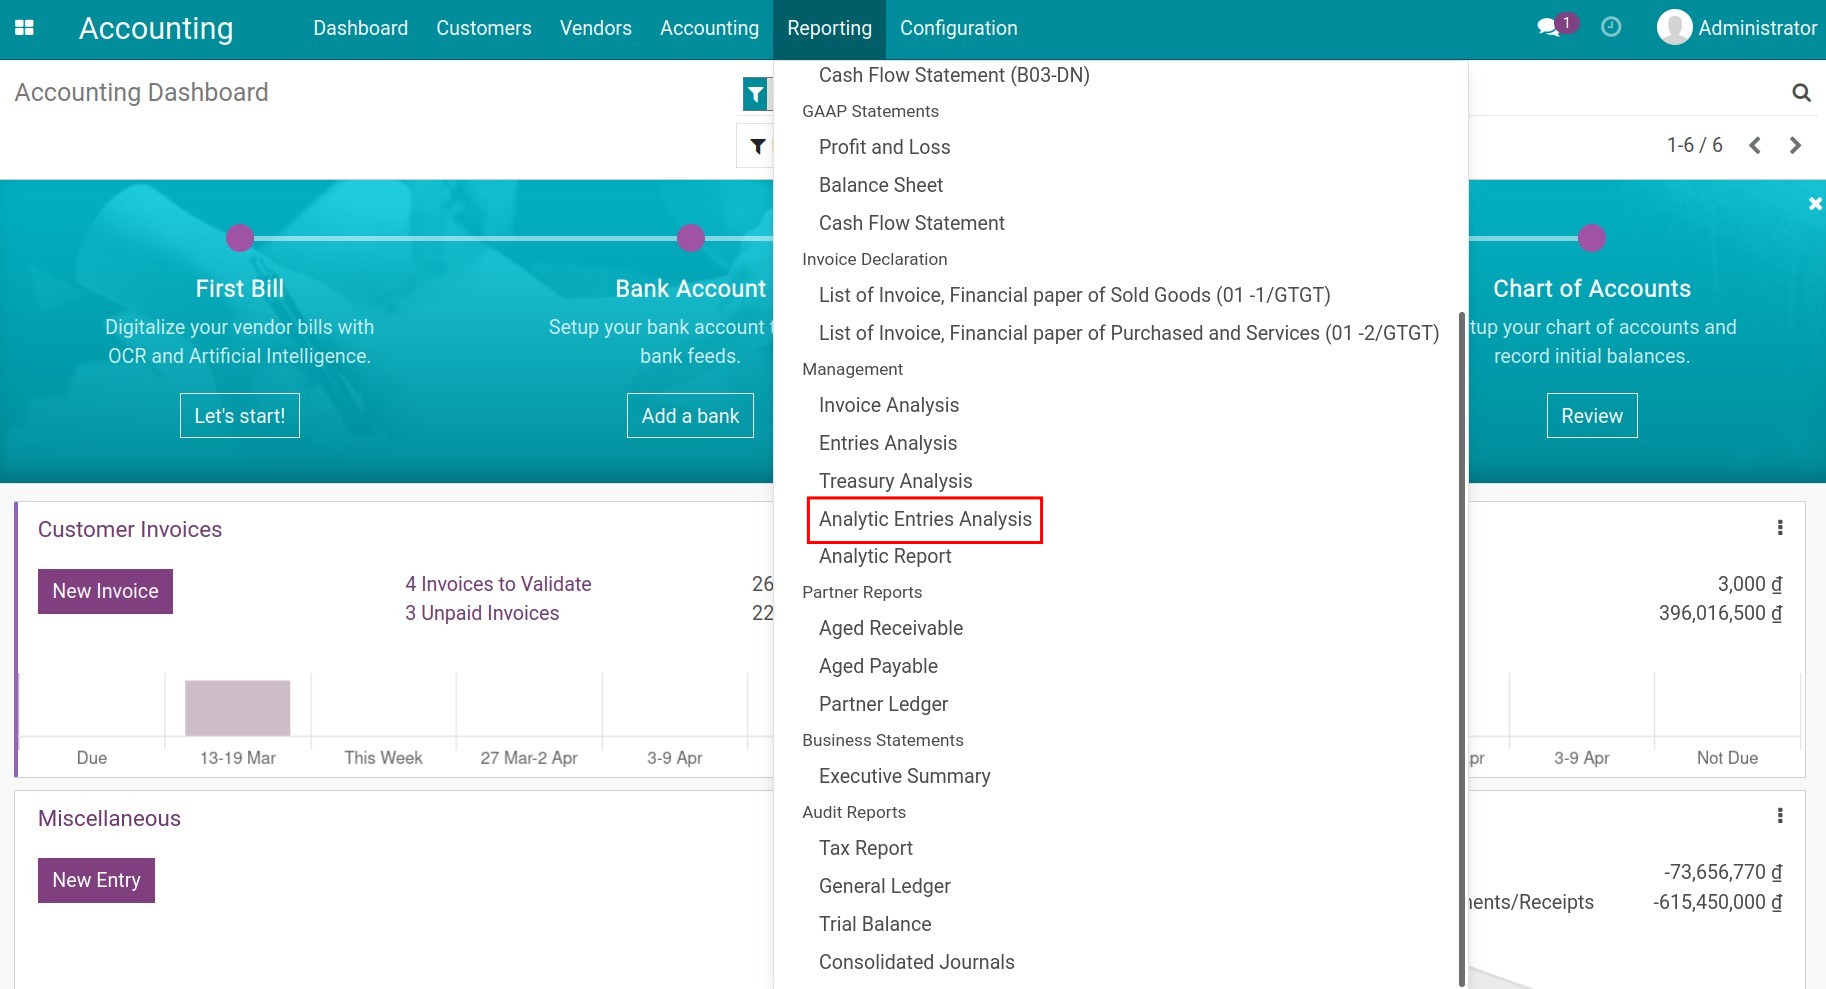
Navigate to Accounting > Reporting > Analytic Entries Analysis:
Similar to the journal entries analysis report, with the analytic entries analysis report, you can:
View reports in pivot or graph format with different chart types.
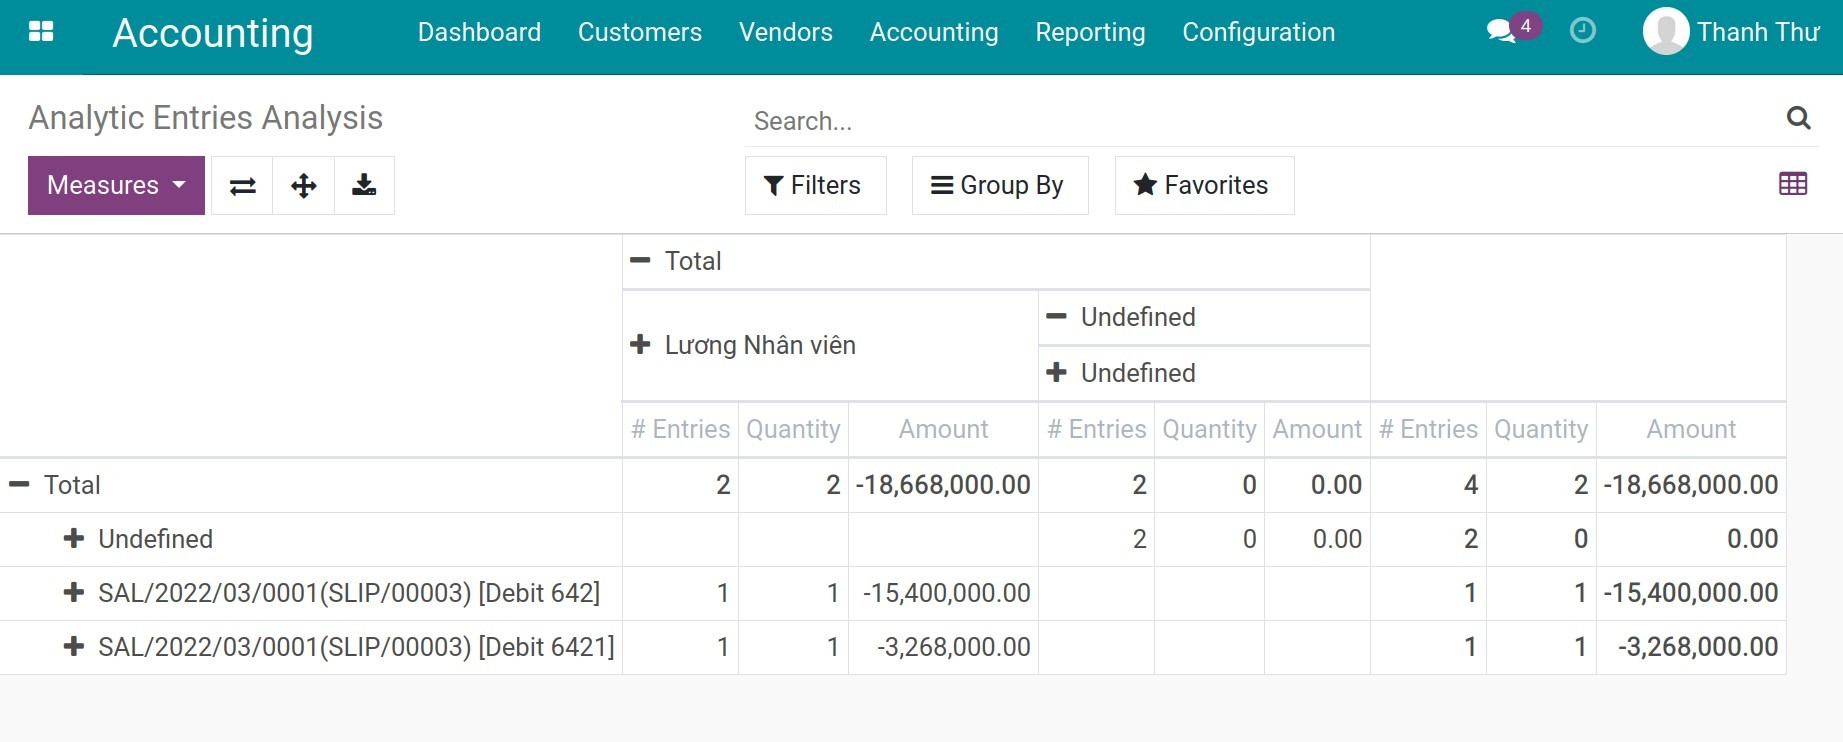
Pivot report:![Analytic entries analysis report - Viindoo Accounting software]() Graph report:
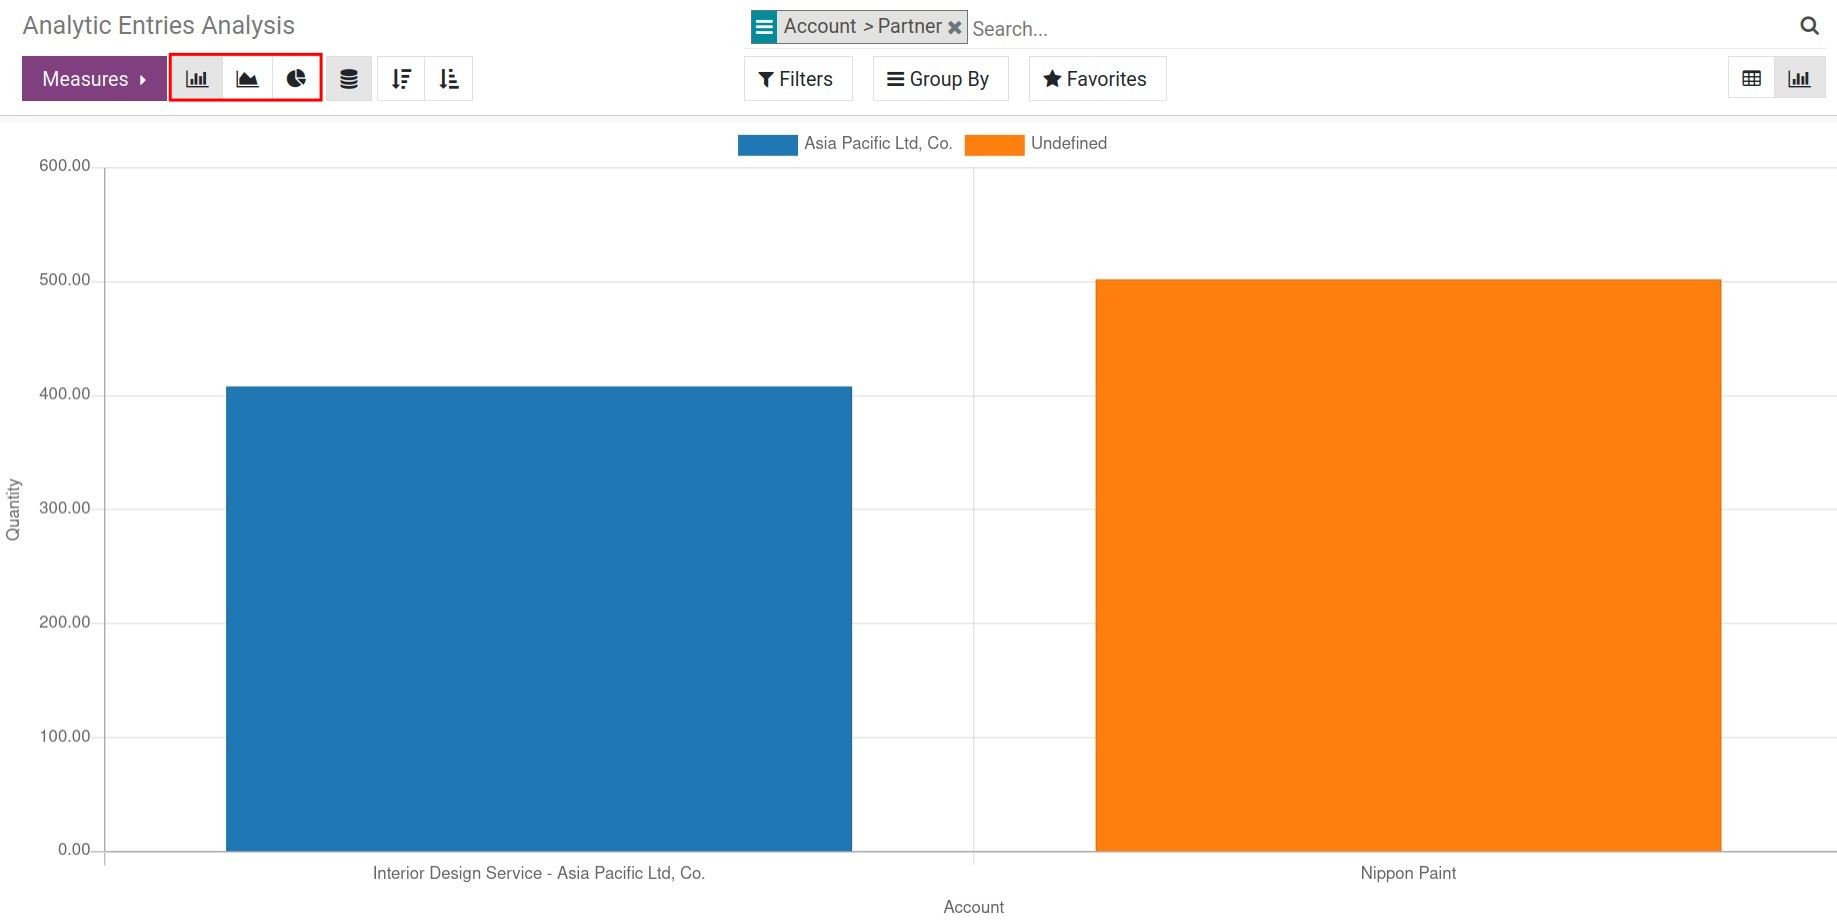
Graph report:![Graph analytic entries analysis report - Viindoo Accounting app]()
Flexible use of measures to generate reports tailored to each need:
# Entries;
Quantity;
Amount;
Count.
Save the report to the favorites filter for later use.