Views and Reports
Data on Viindoo software is automatically aggregated into different types of reports. Viindoo allows users to view reports and statistics on many types of views depending on their personal use, supporting managers to keep track of the business health instantly, accurately and easily.
Views in Viindoo Software
Supported view types
There are a total of 11 view types in Viindoo software. In which there are 6 common types:
- List view
- Kanban view
- Pivot table view
- Calendar view
- Graph view
- Activity view
The remaining 5 types will appear in some applications when installing supported view display modules:
- Cohort view
- Map view
- Dashboard view
- Gantt chart view
- Organization chart view
Where will you see these views?
With different applications and display subjects, Viindoo will display the appropriate view types depending on your purpose.
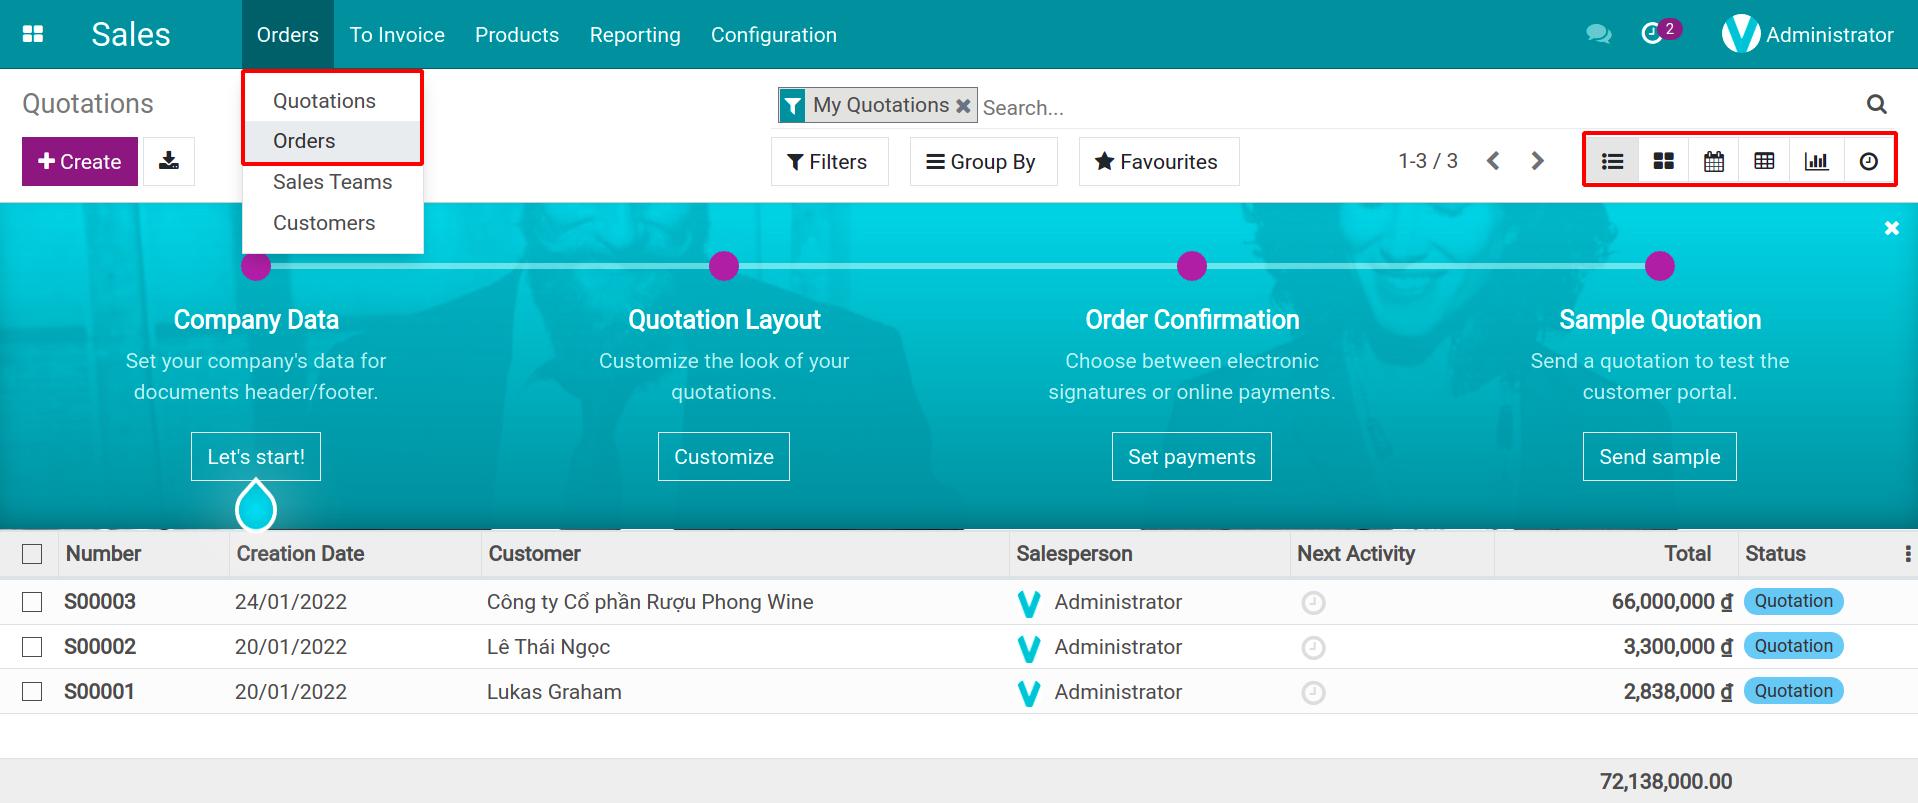
For example: In the main menu of the Sales application, you will see 6 types of report views. In order from left to right: list view, kanban view, calendar view, pivot view, graph view, activity view.
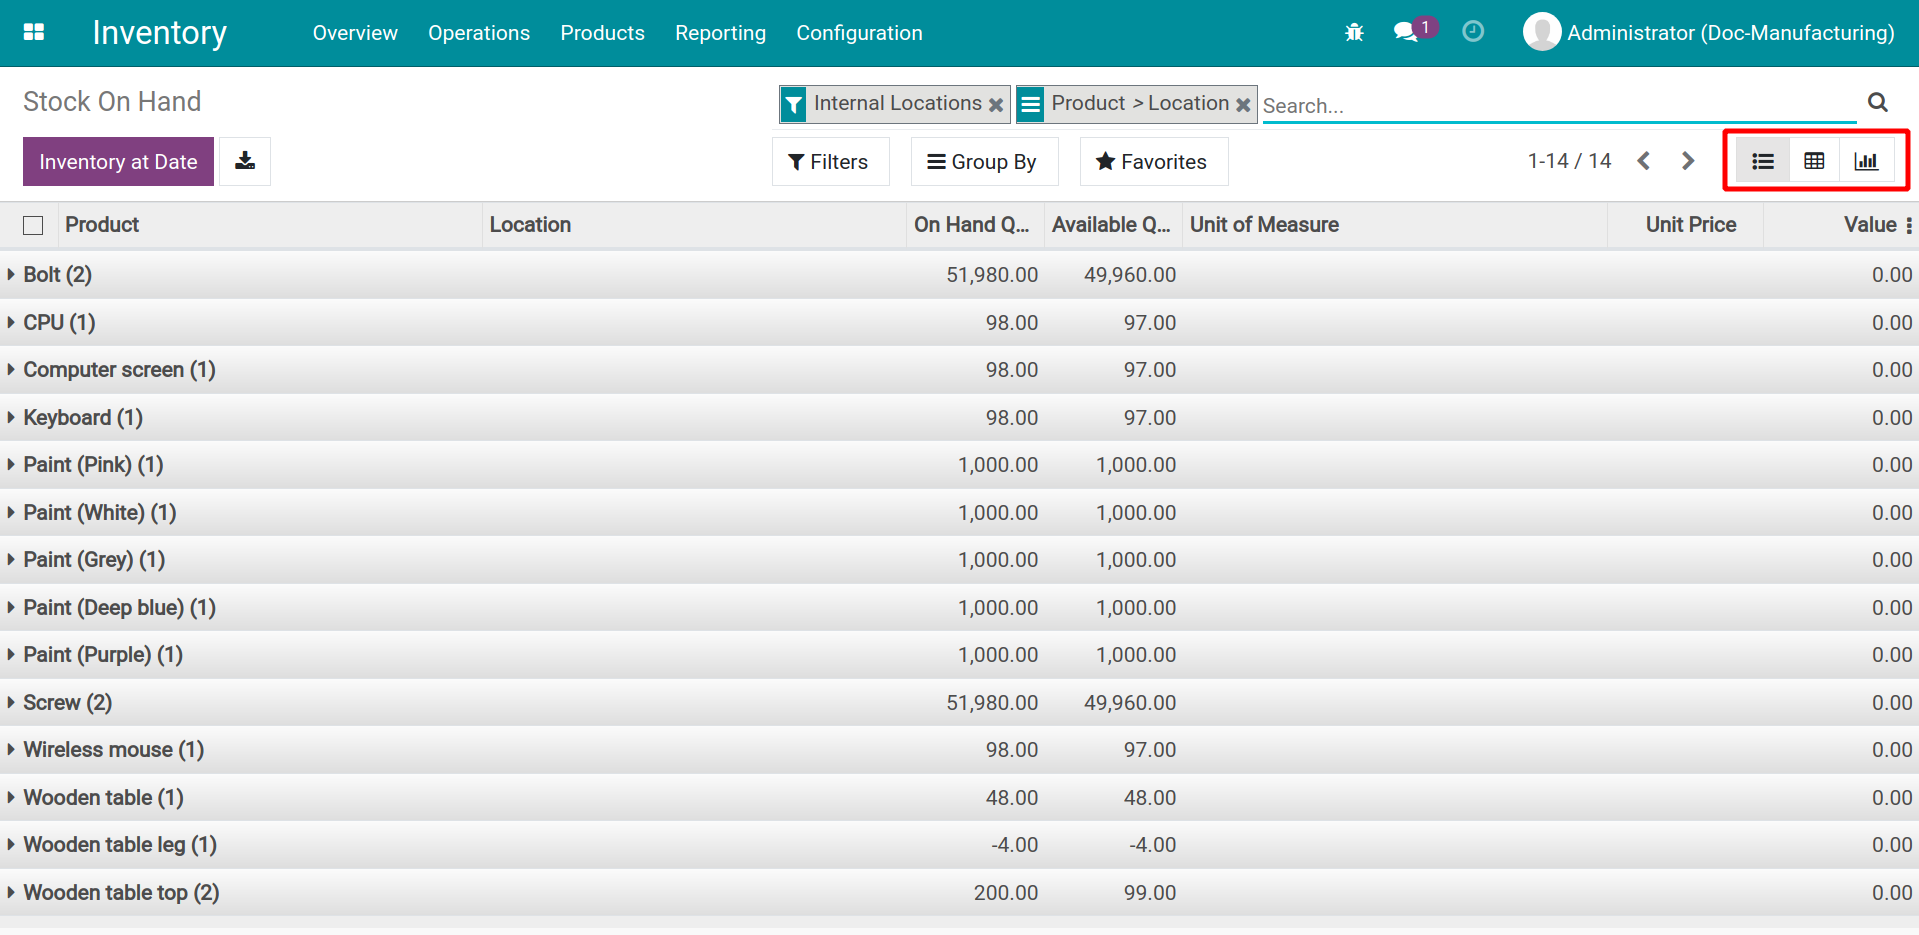
For example: When accessing Inventory > Reporting > Inventory Report, you will see that Viindoo only supports displaying reports under 3 view types: List, Pivot and Chart:
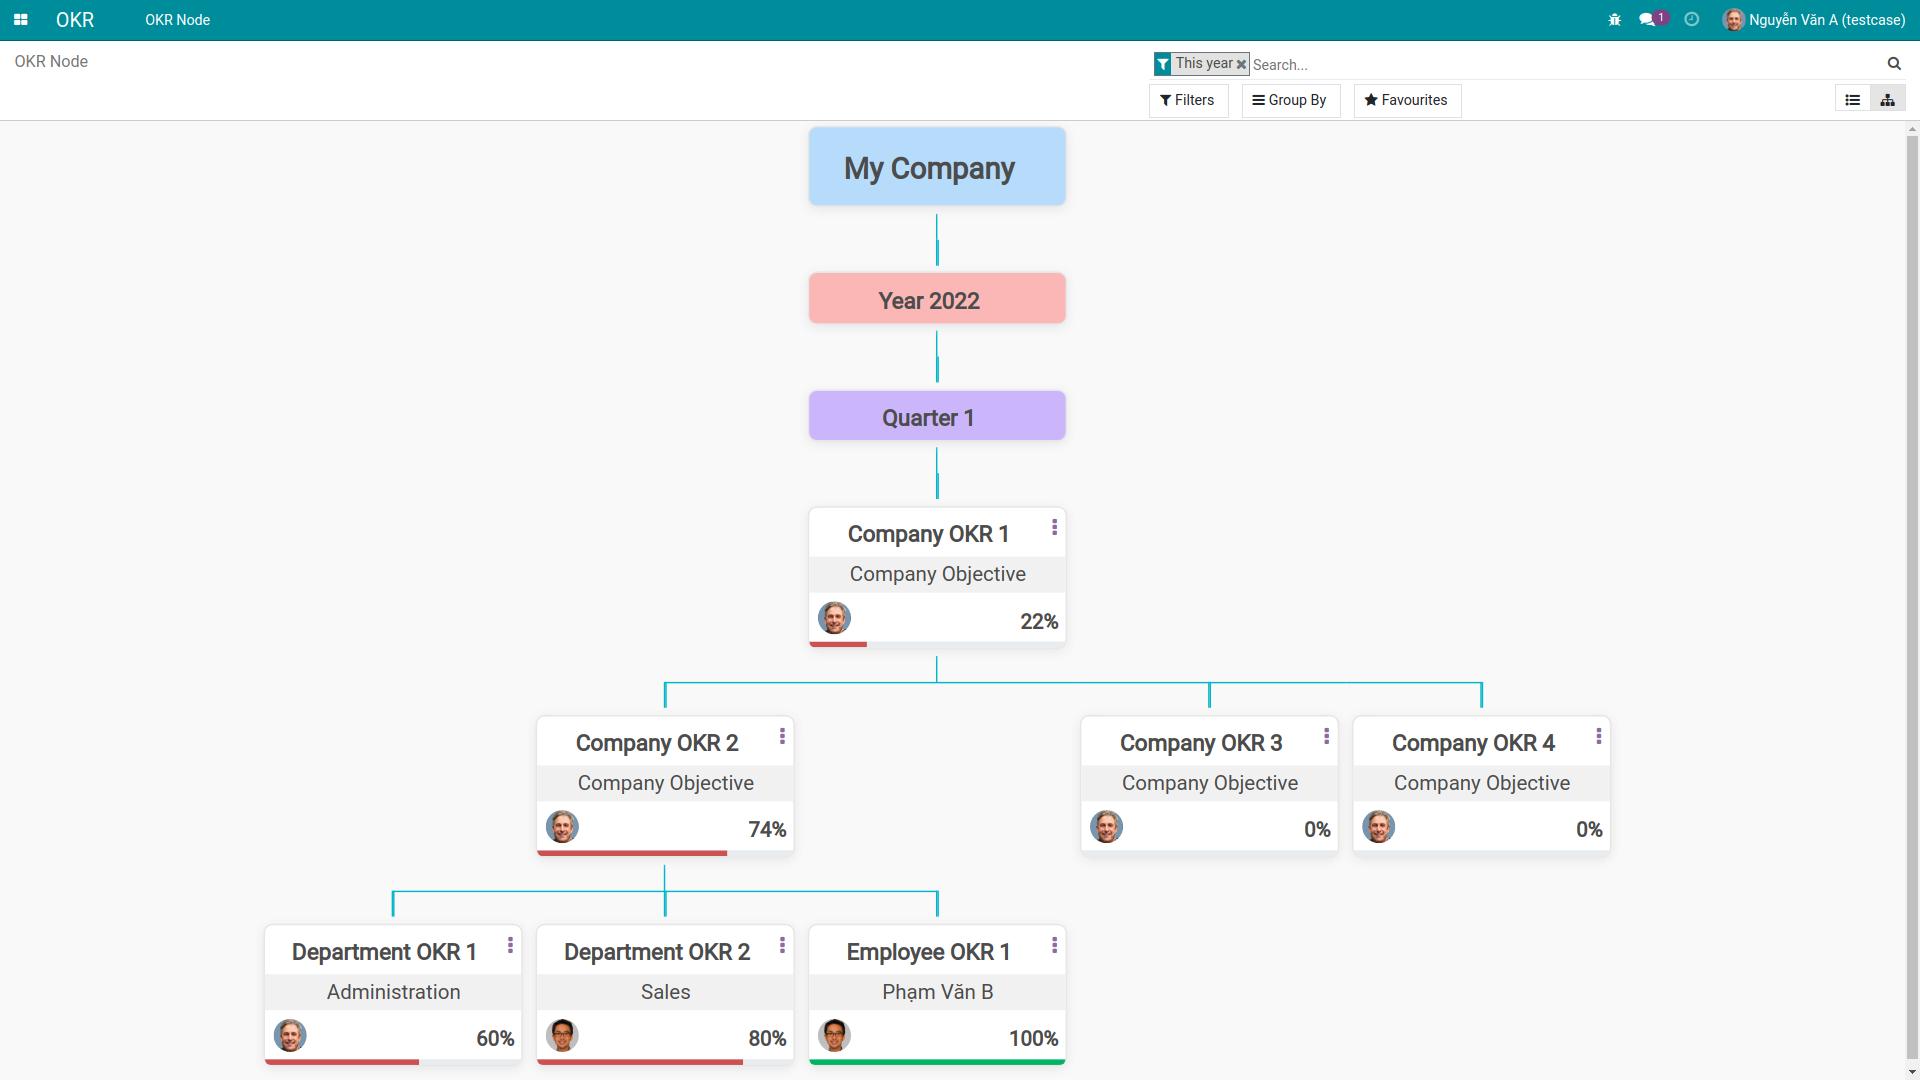
The remaining views will be displayed in specific applications. For example: With Organization chart type, you can find it at OKR App.
Details of view types
In this guideline, we will use the CRM application as a visual example for 6 common view types. With the same data set, we will see how the software supports the display of each view type.
Tip
The display buttons are in the top right corner and under the search bar on each form. These are the buttons to choose the view types. You should remember these button icons to quickly switch view types when needed.
List view
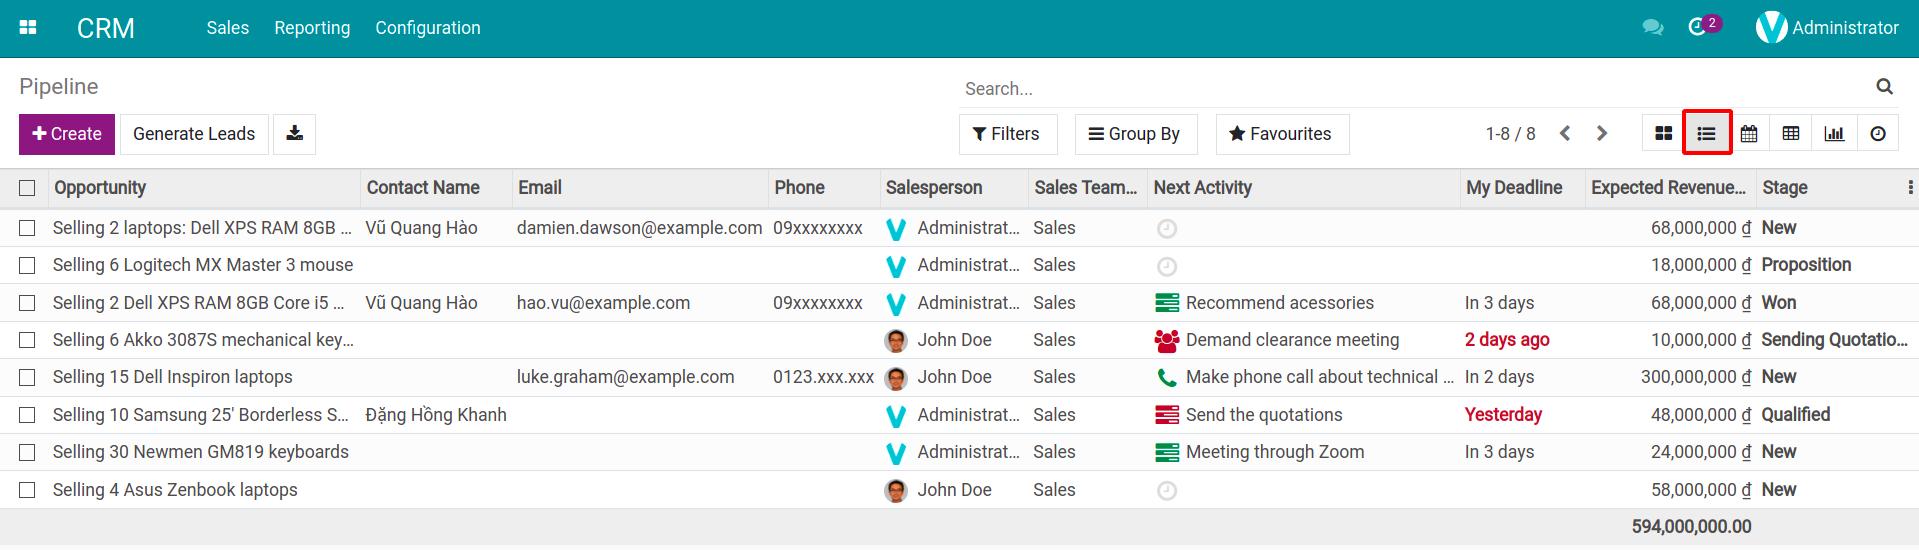
Click on the List view icon as shown so that the data is displayed in Opportunity lines. The columns in the list represent the fields of the form such as: Opportunity Name, Email, Phone Number, Expected Revenue, etc.
Kanban view
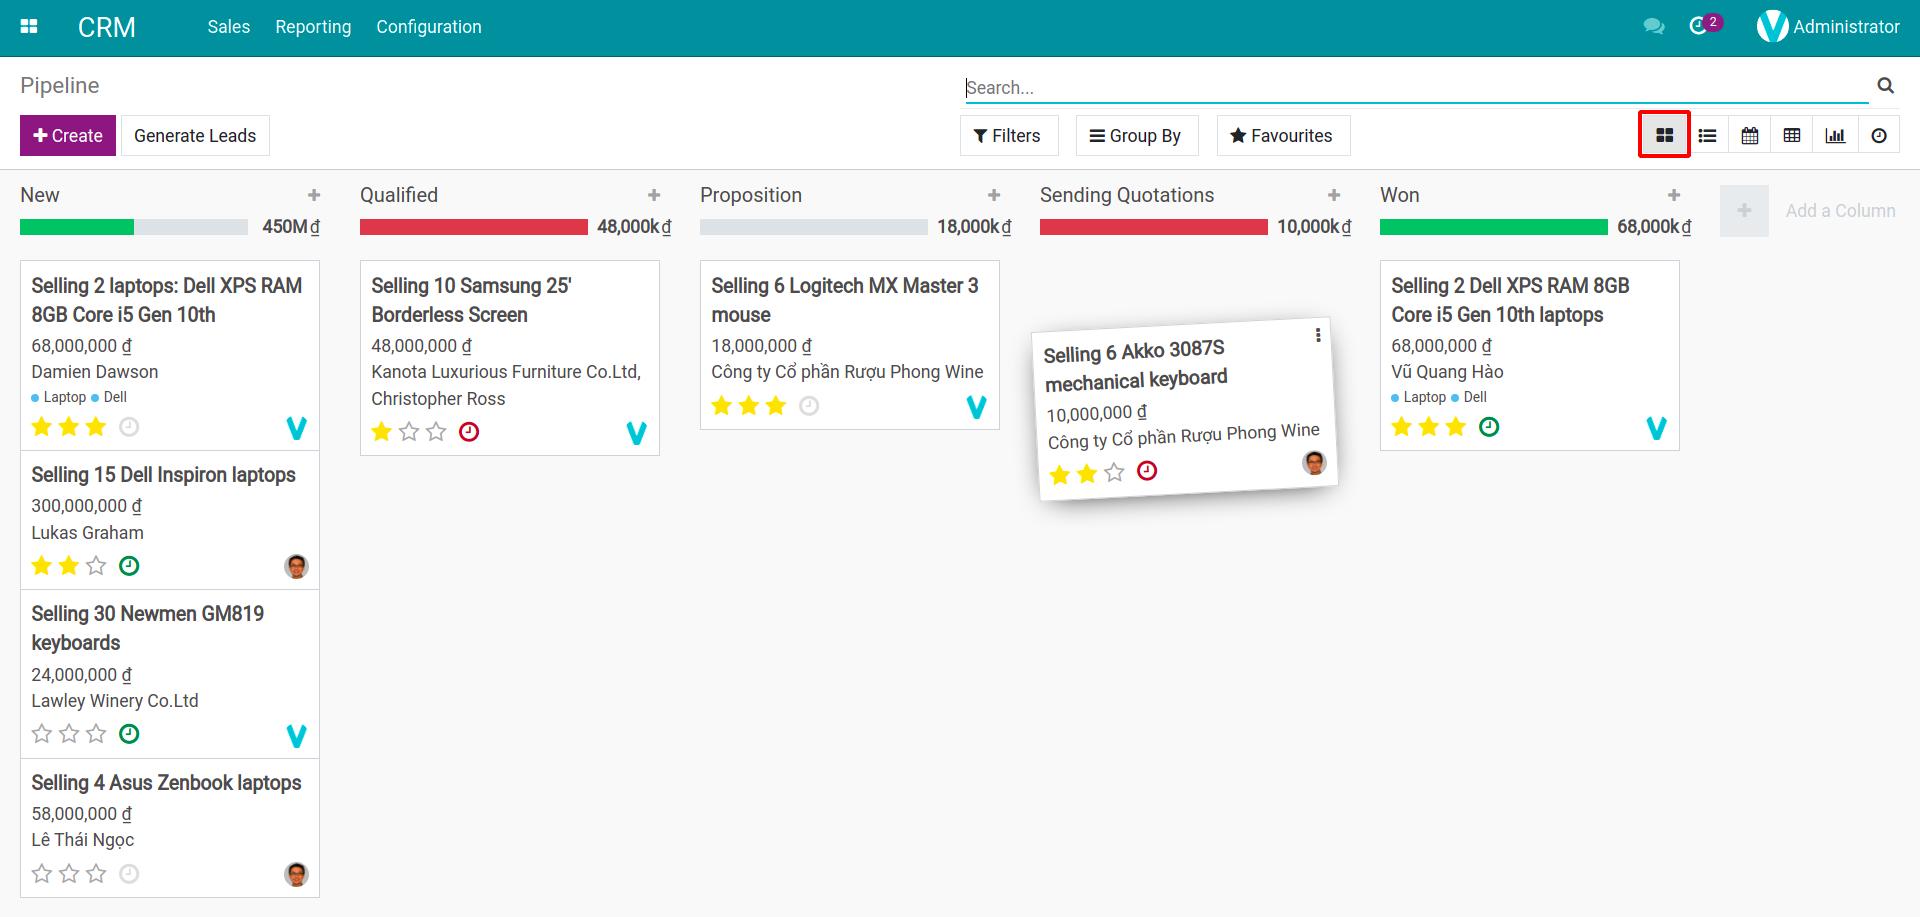
To view the data in Kanban, click on the Kanban icon as shown. Each Opportunity will now be displayed as a Kanban card (See more: What is Kanban?) and are categorized according to each stage: New, Qualified, Proposition, Sending Quotations, Won and Lost. Users can drag and drop to move these cards to another column; this also changes the Opportunity’s stage on the form.
Calendar view
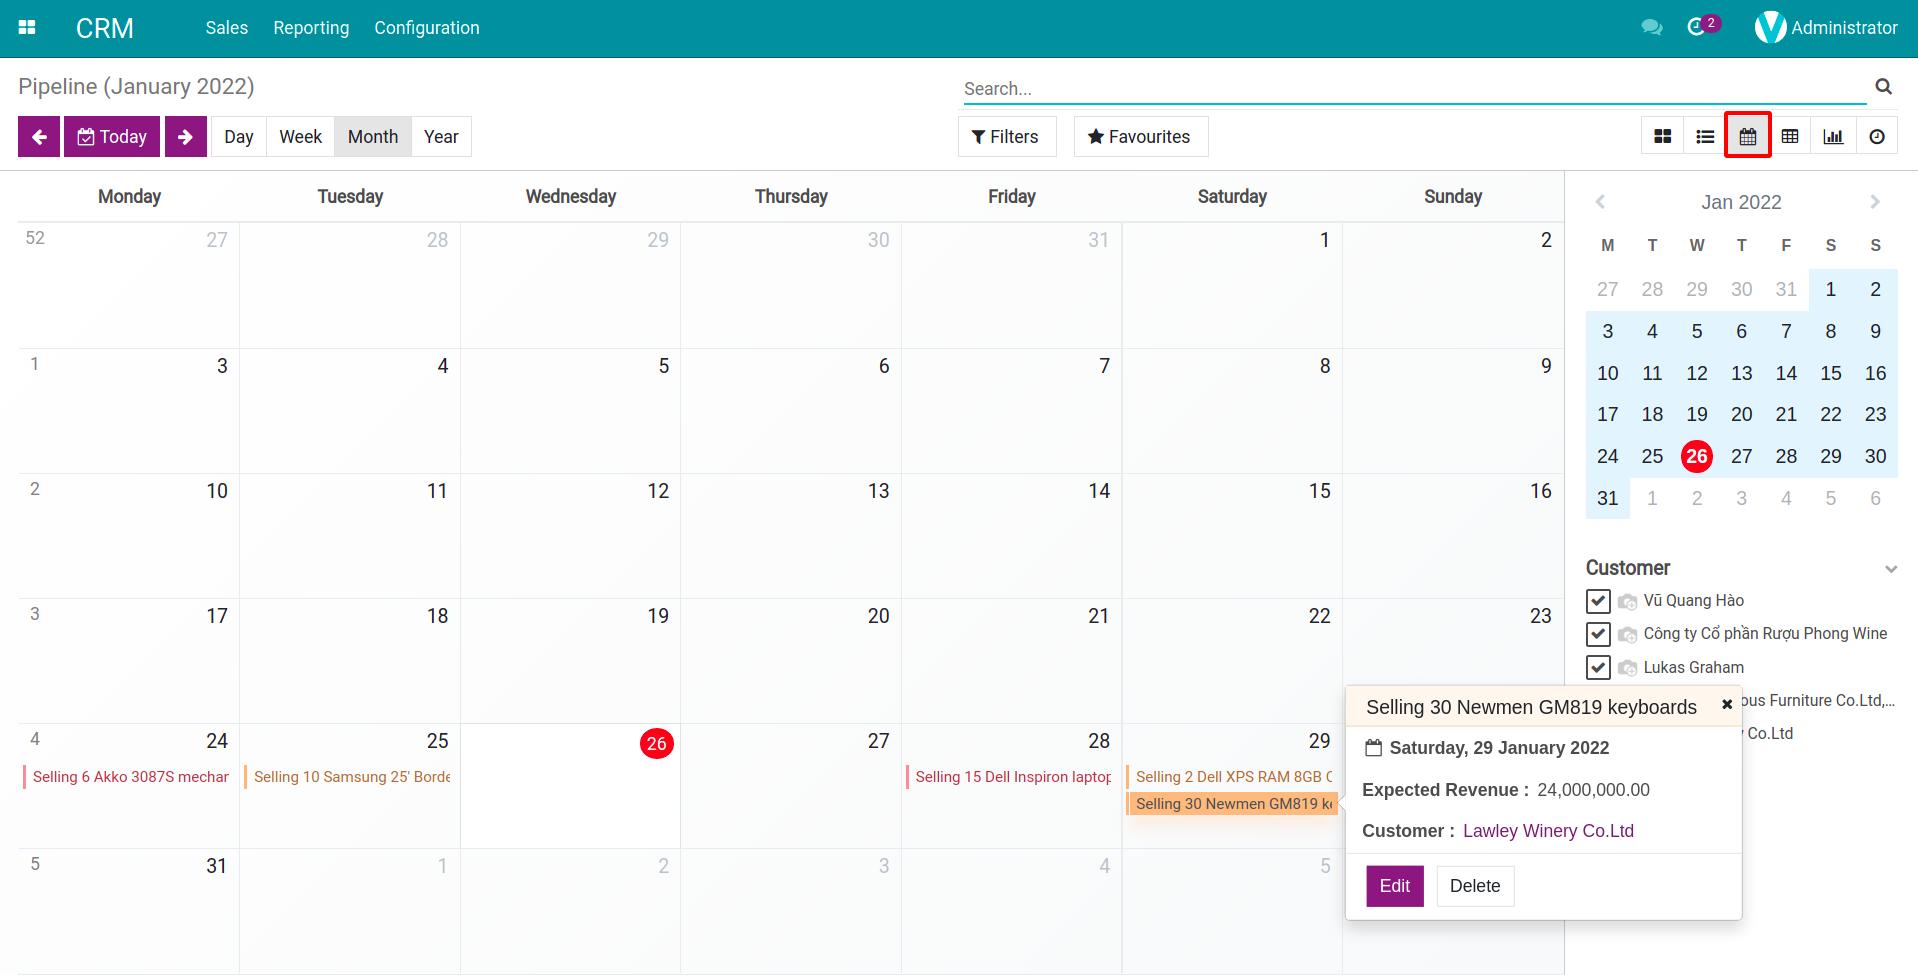
In this view, Opportunities are displayed on the calendar based on their scheduled activities. You can track the actions that need to be taken each day to schedule your own activities appropriately and in a timely manner, as well as keep track of other salespeople’s work.
Pivot table view
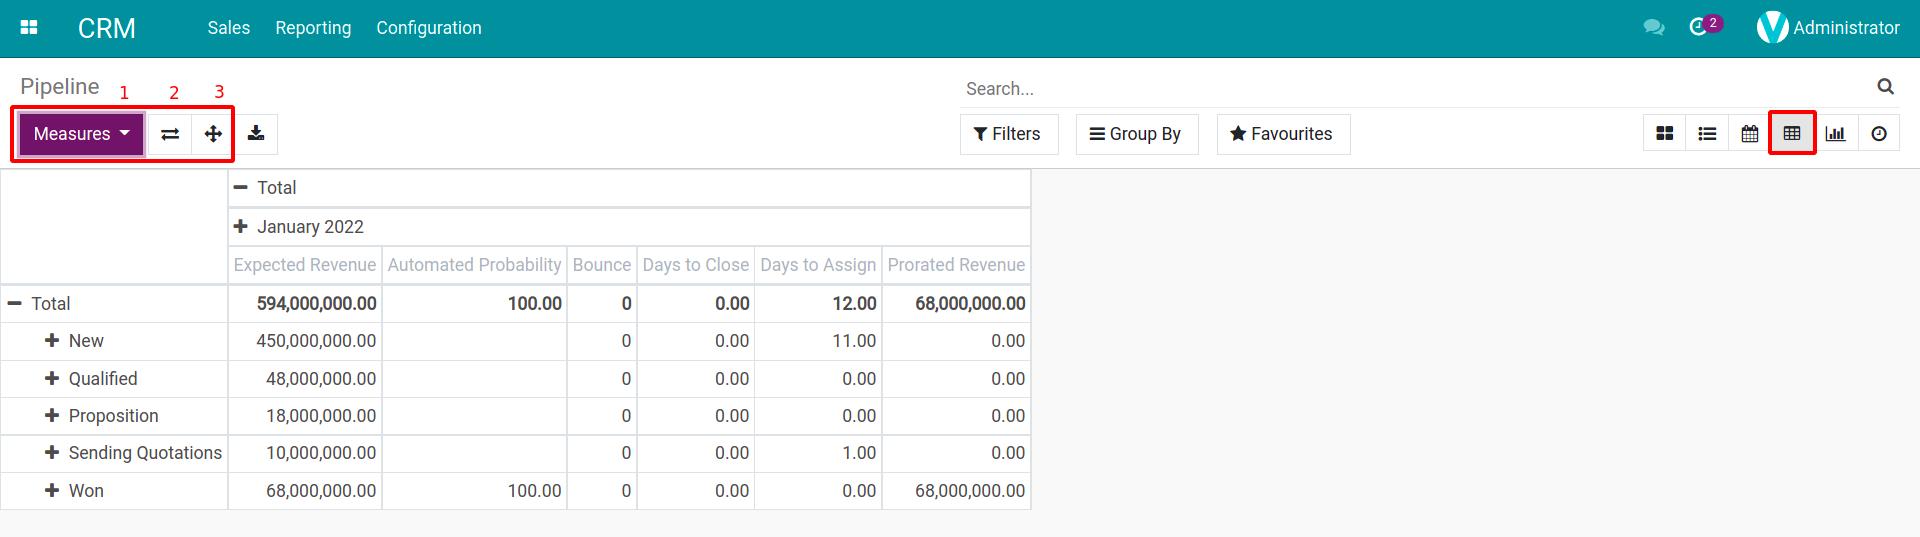
The Pivot table view here is similar to the Pivot display type present in most modern spreadsheet software. The data sorted into the pivot table can be flexible, classified, differently sorted (by time, by object, etc.). At the top left corner is the Measures button, click to select the desired measure.
- The Measures button allows the user to select additional fields to display on the pivot table.
- The Flip axis button converts the axis from rows to columns and vice versa.
- The Expand all button will open all temporarily closed columns on the pivot table.
Graph view
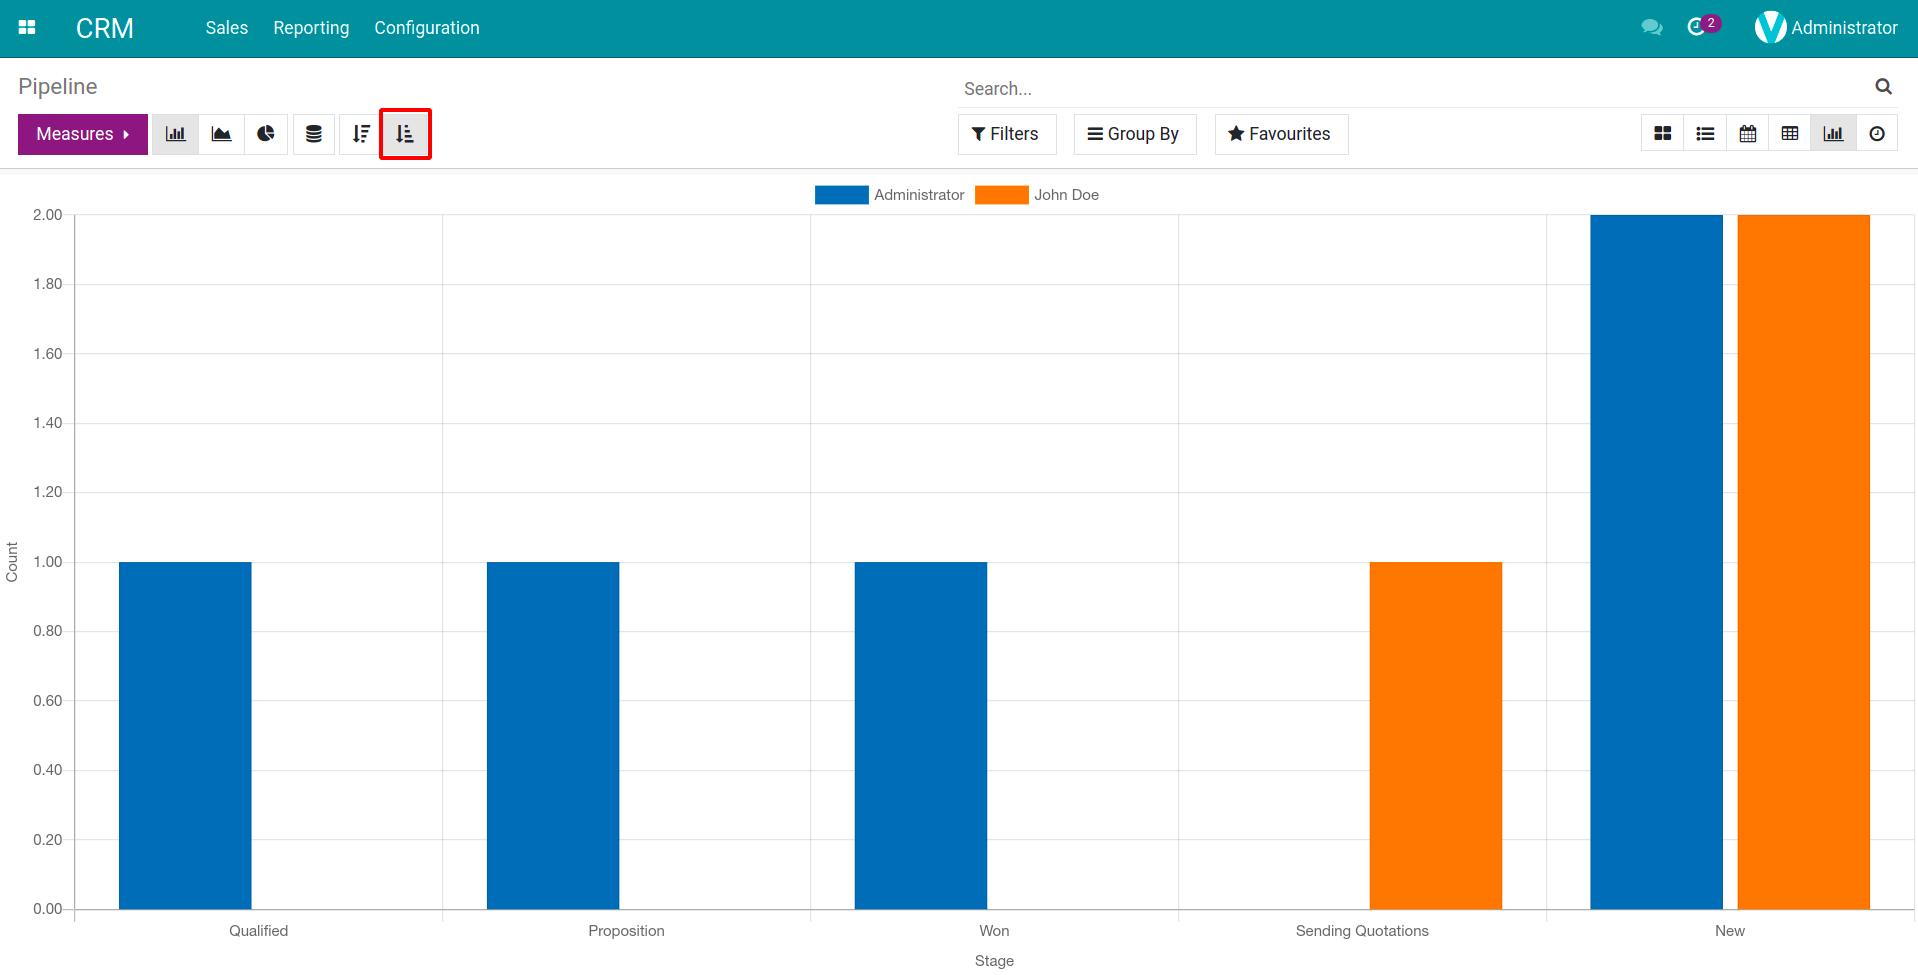
You will have a variety of chart types to choose from such as Bar chart, Pie chart, Line chart which is similar to the charts in spreadsheets. The data will be displayed visually, changes in data and measures will also change the display of the corresponding chart.
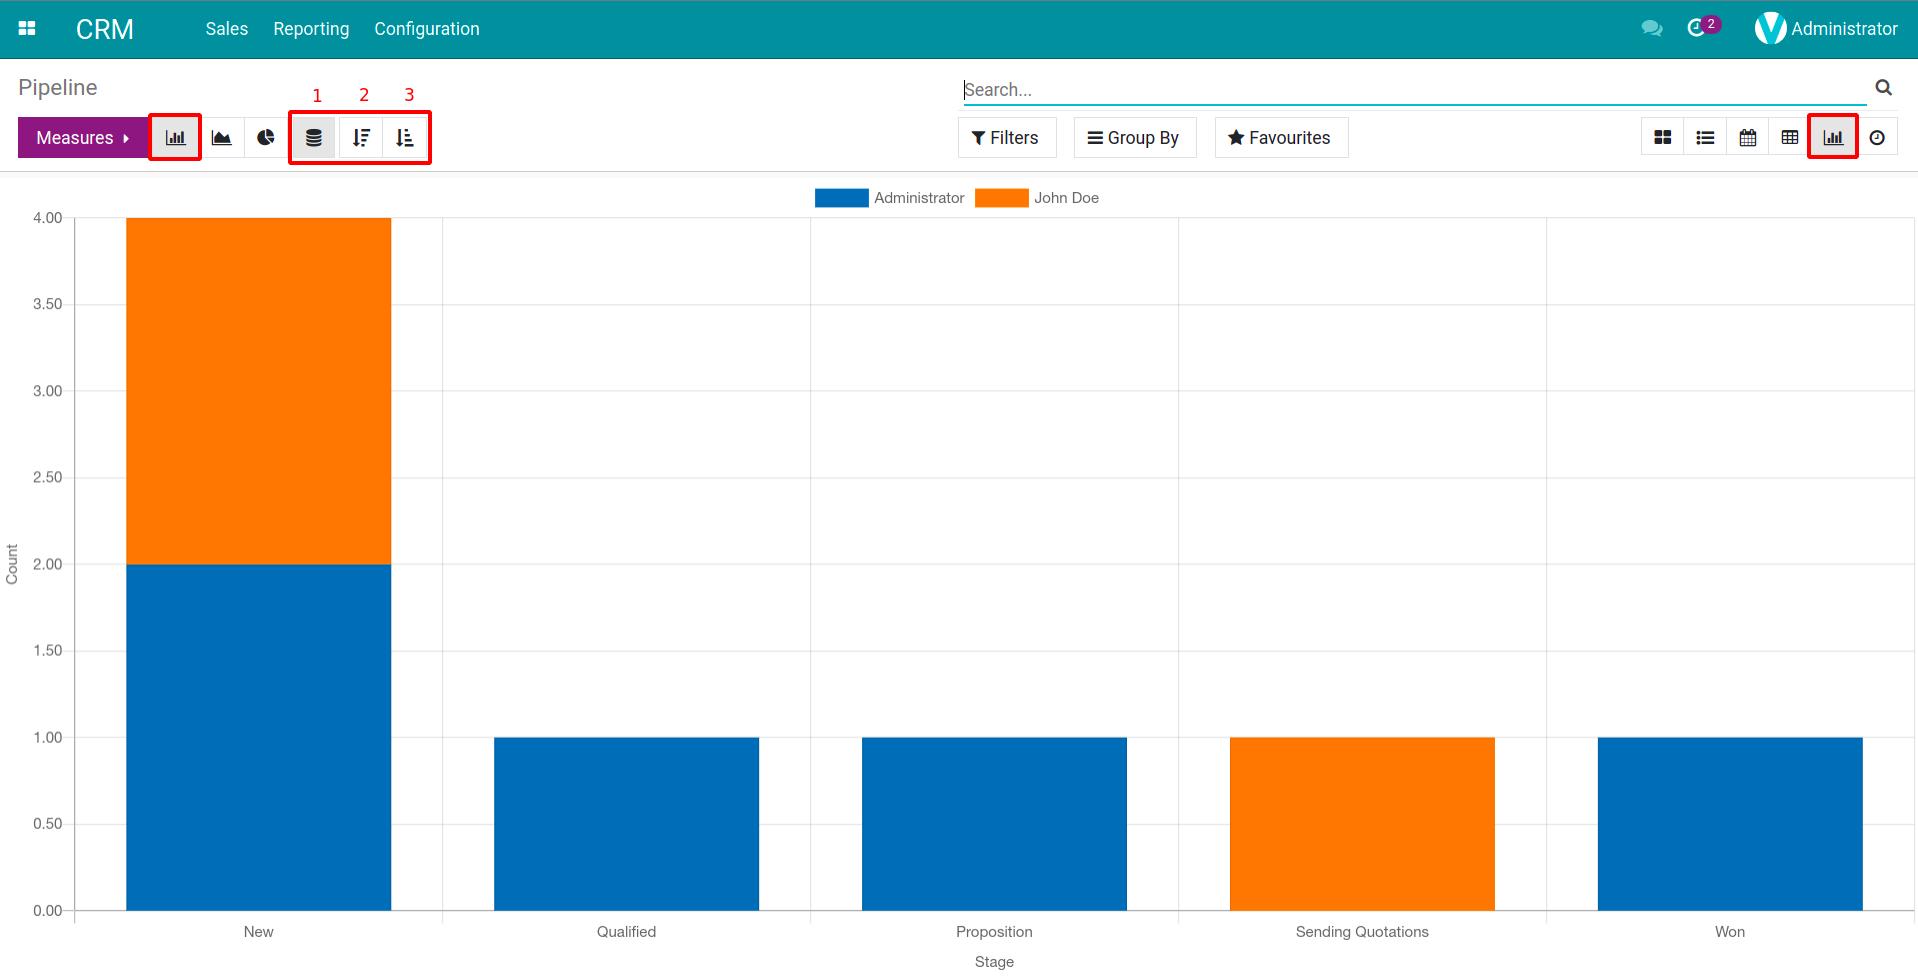
The bar chart is divided into 2 types Stacked Chart or Single Bar Chart, you can switch between these two formats by pressing the Stacked button (1). Besides, you can also arrange the columns in the order Descending (2) or Ascending (3).
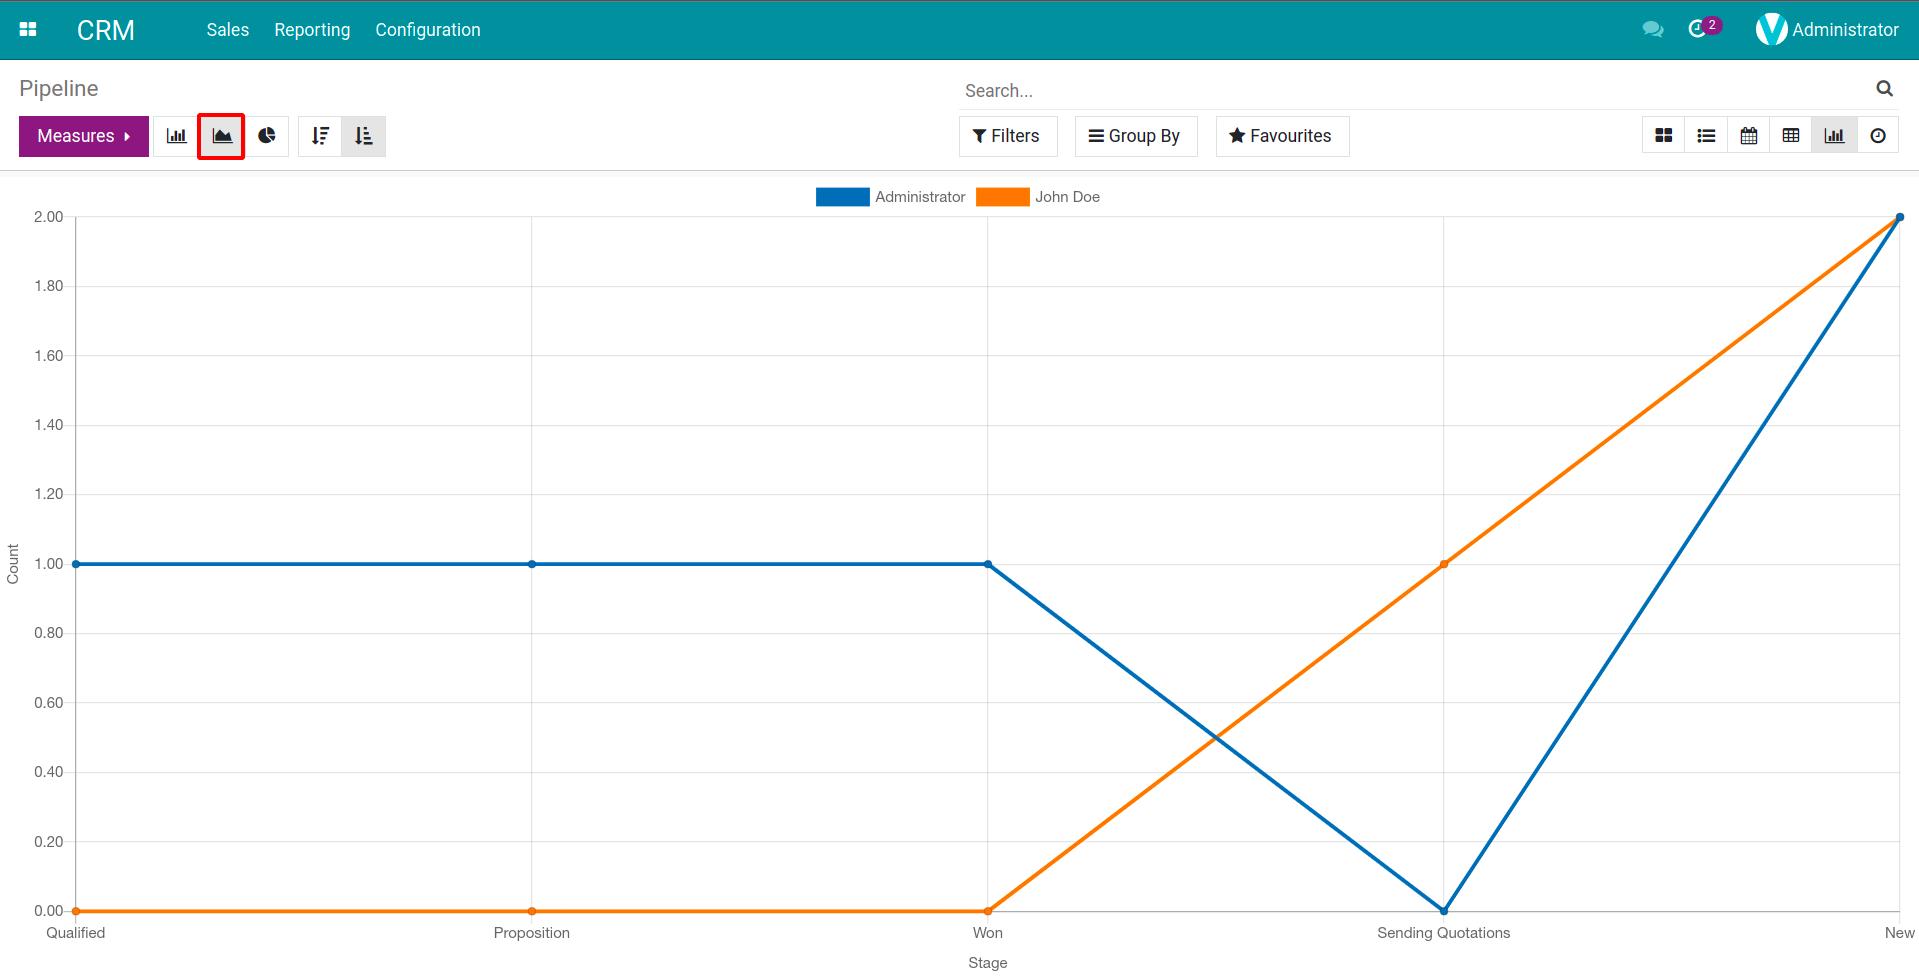
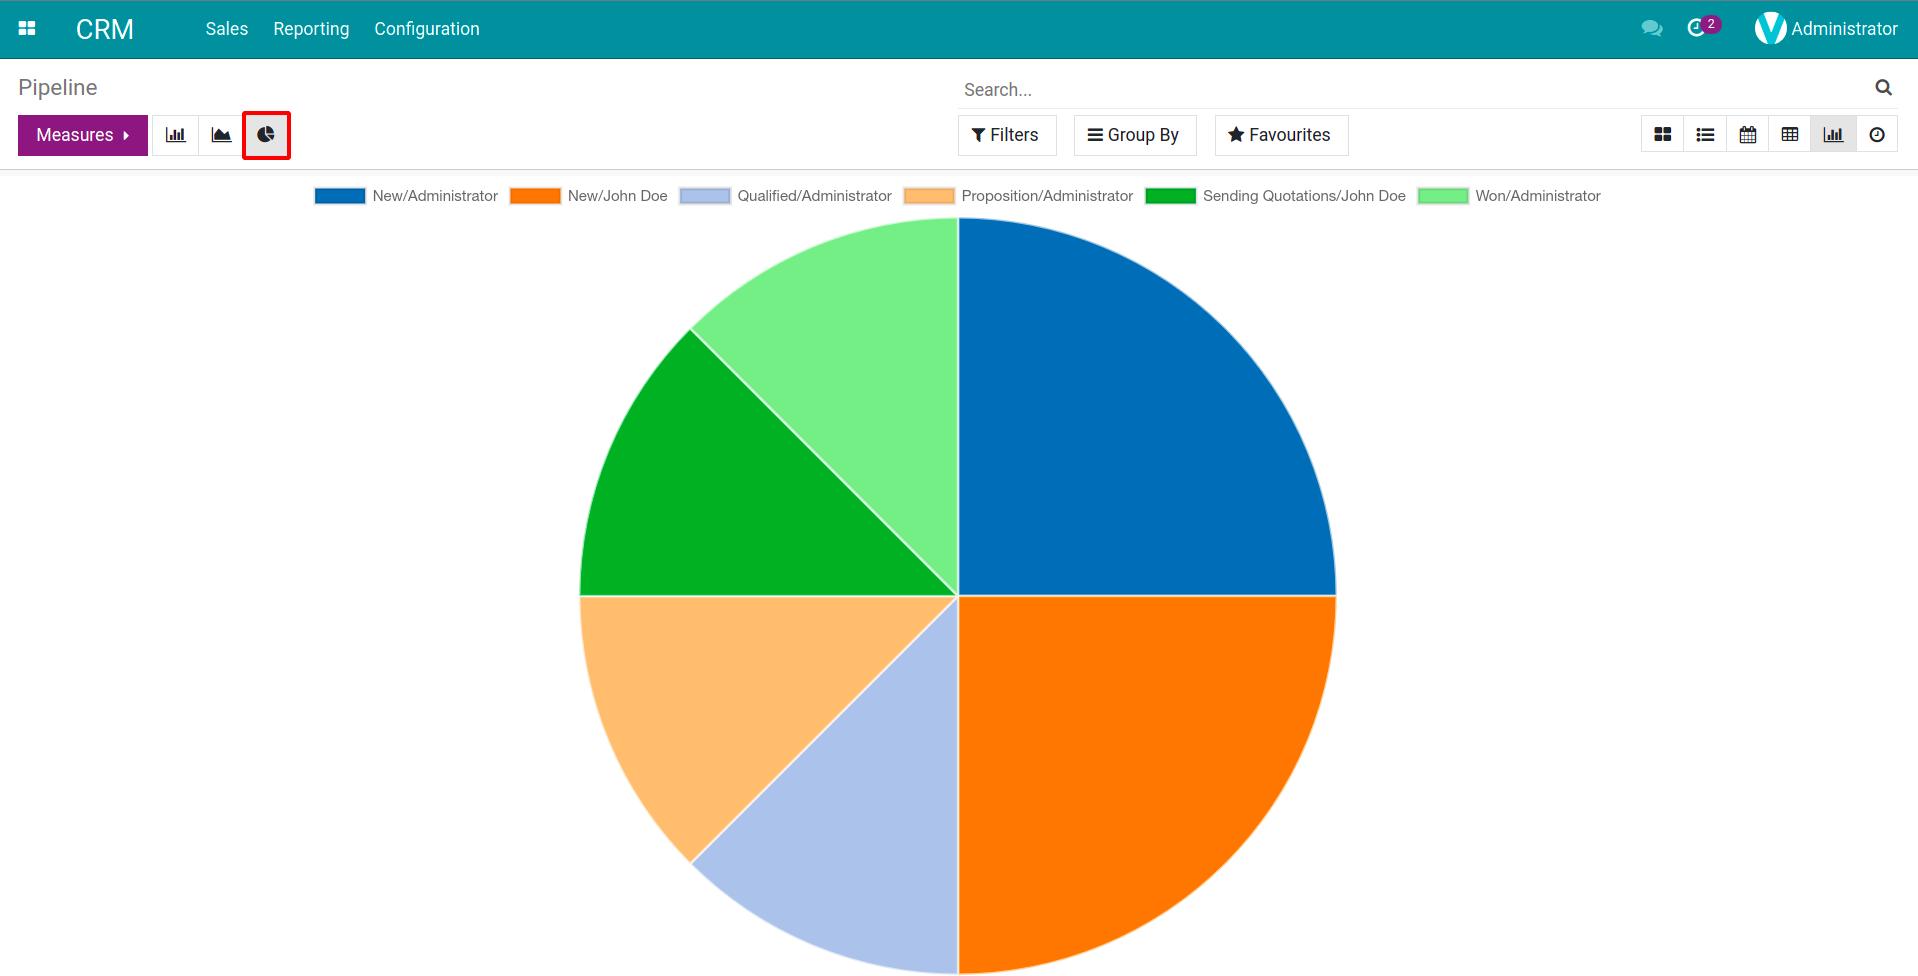
The other 2 view types are Line charts and Pie charts. You can use the filter that comes with the charts above to display only the necessary data.
See also
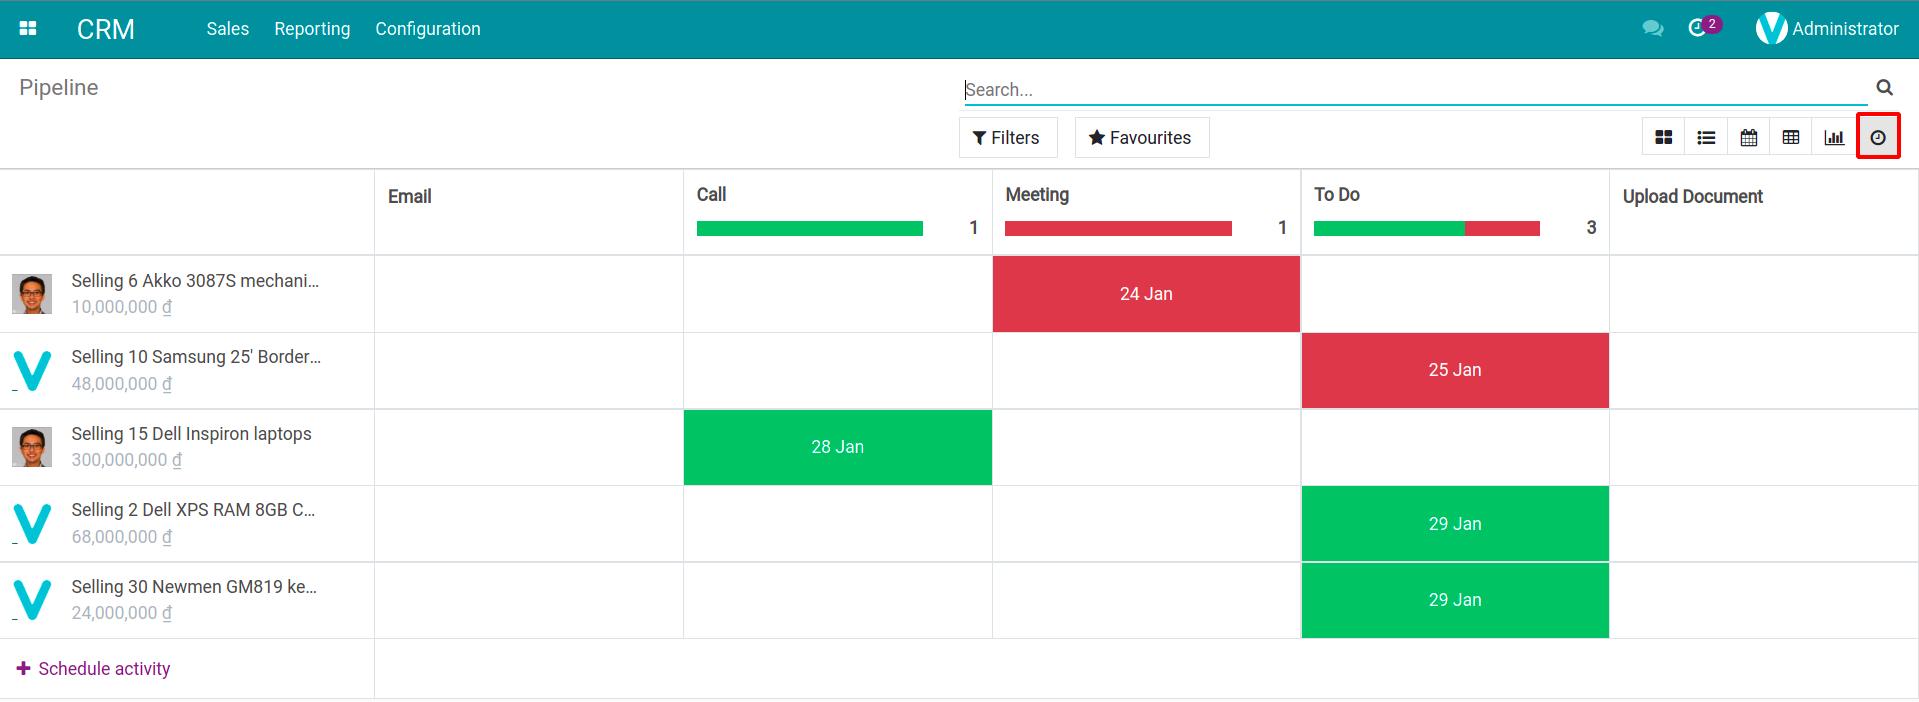
Activity view
Click on the View activity icon to see the Activity view. You will see all scheduled activities that you set on opportunities in this view.
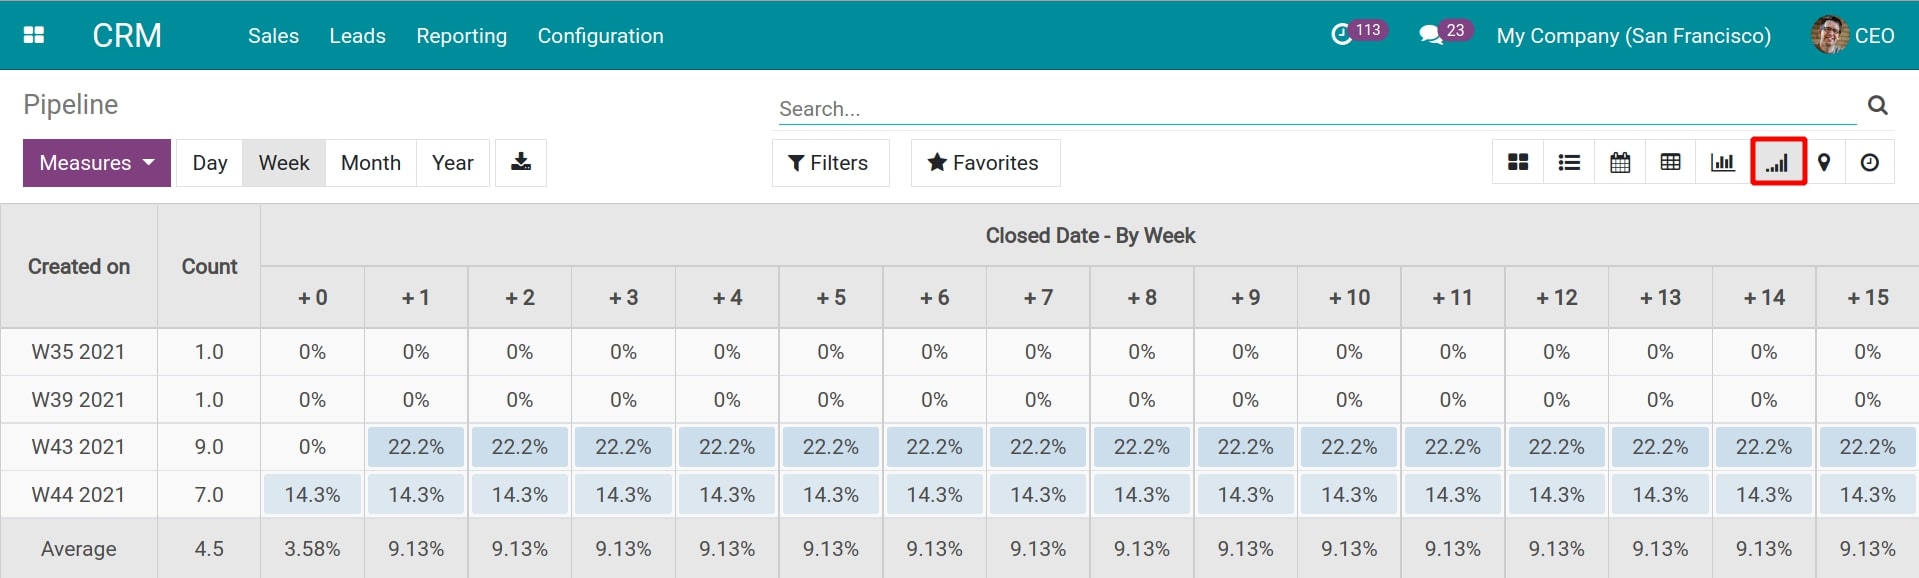
Cohort view
You will see this view by going to CRM > Sales > My Pipeline and choosing the cohort icon (image). The cohort view allows you to track the process of opportunities in a certain period.
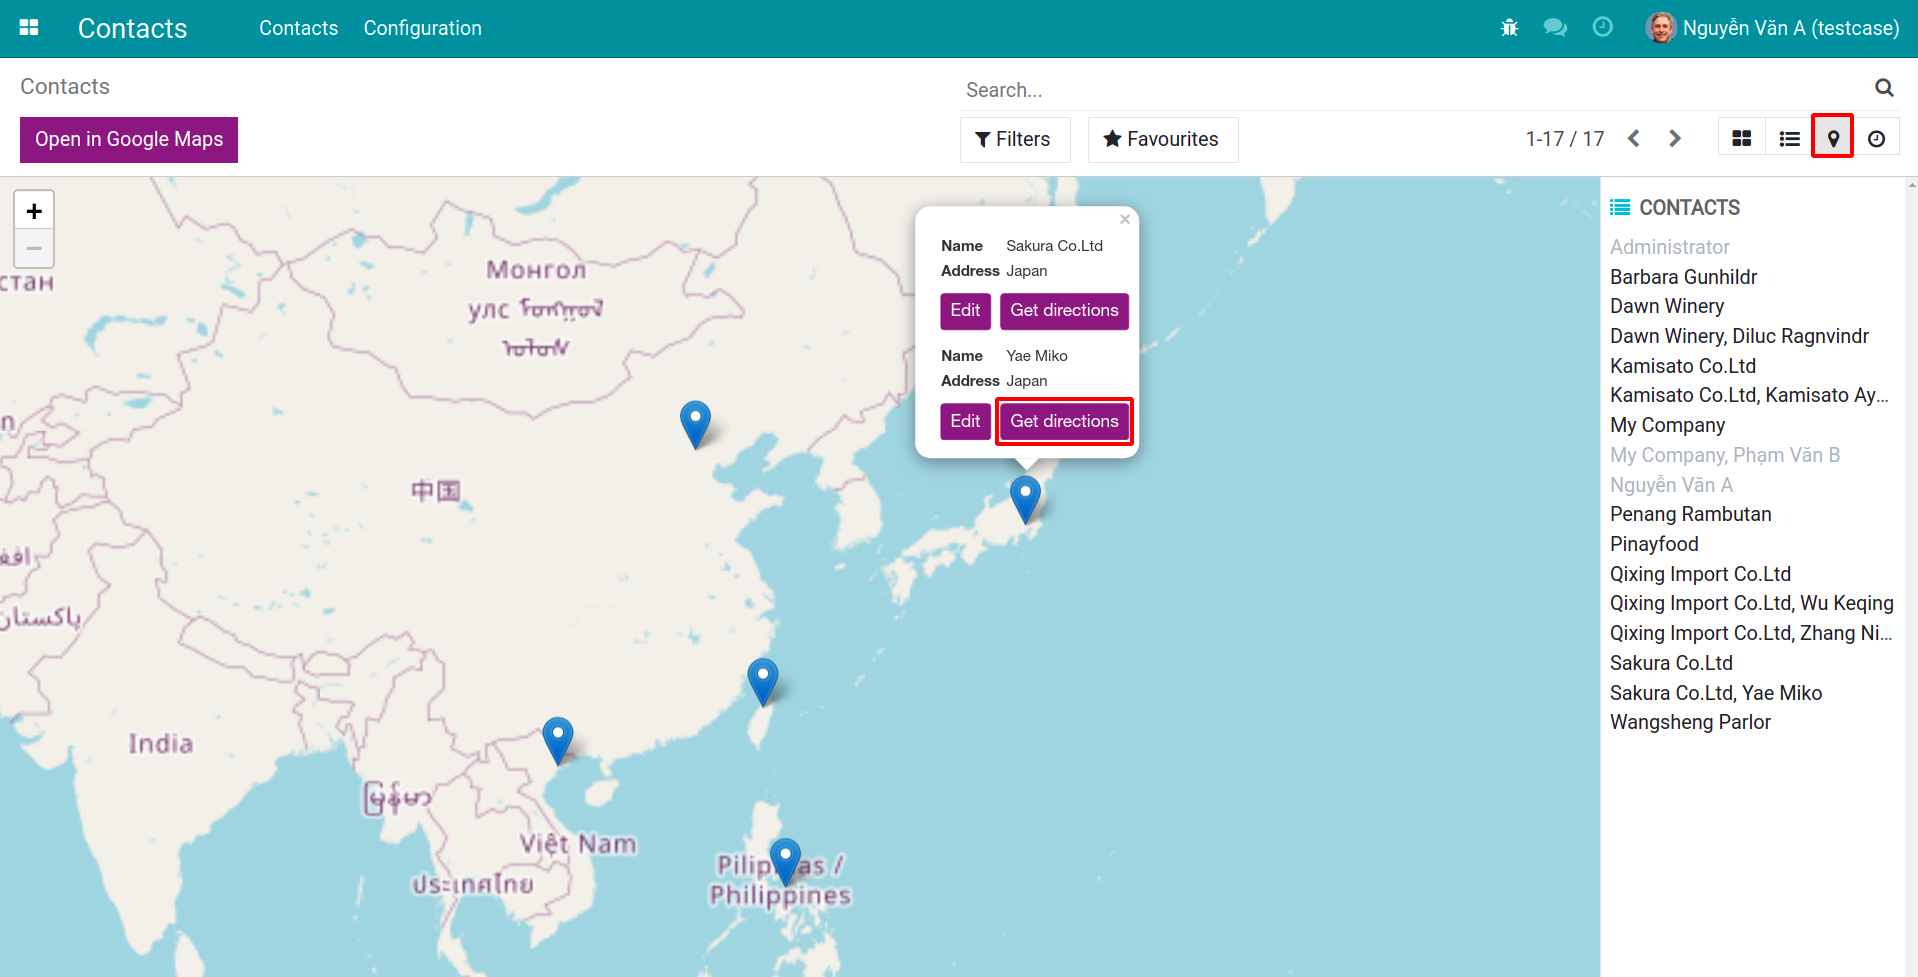
Map view
This view was developed to locate an object’s geographical position on an actual map. For example: In the Contacts app, you can choose to convert the form to a map format. The contacts will now be distributed according to their countries. If you click on the Get directions button, the contact’s address will be shown directly on Google Maps.
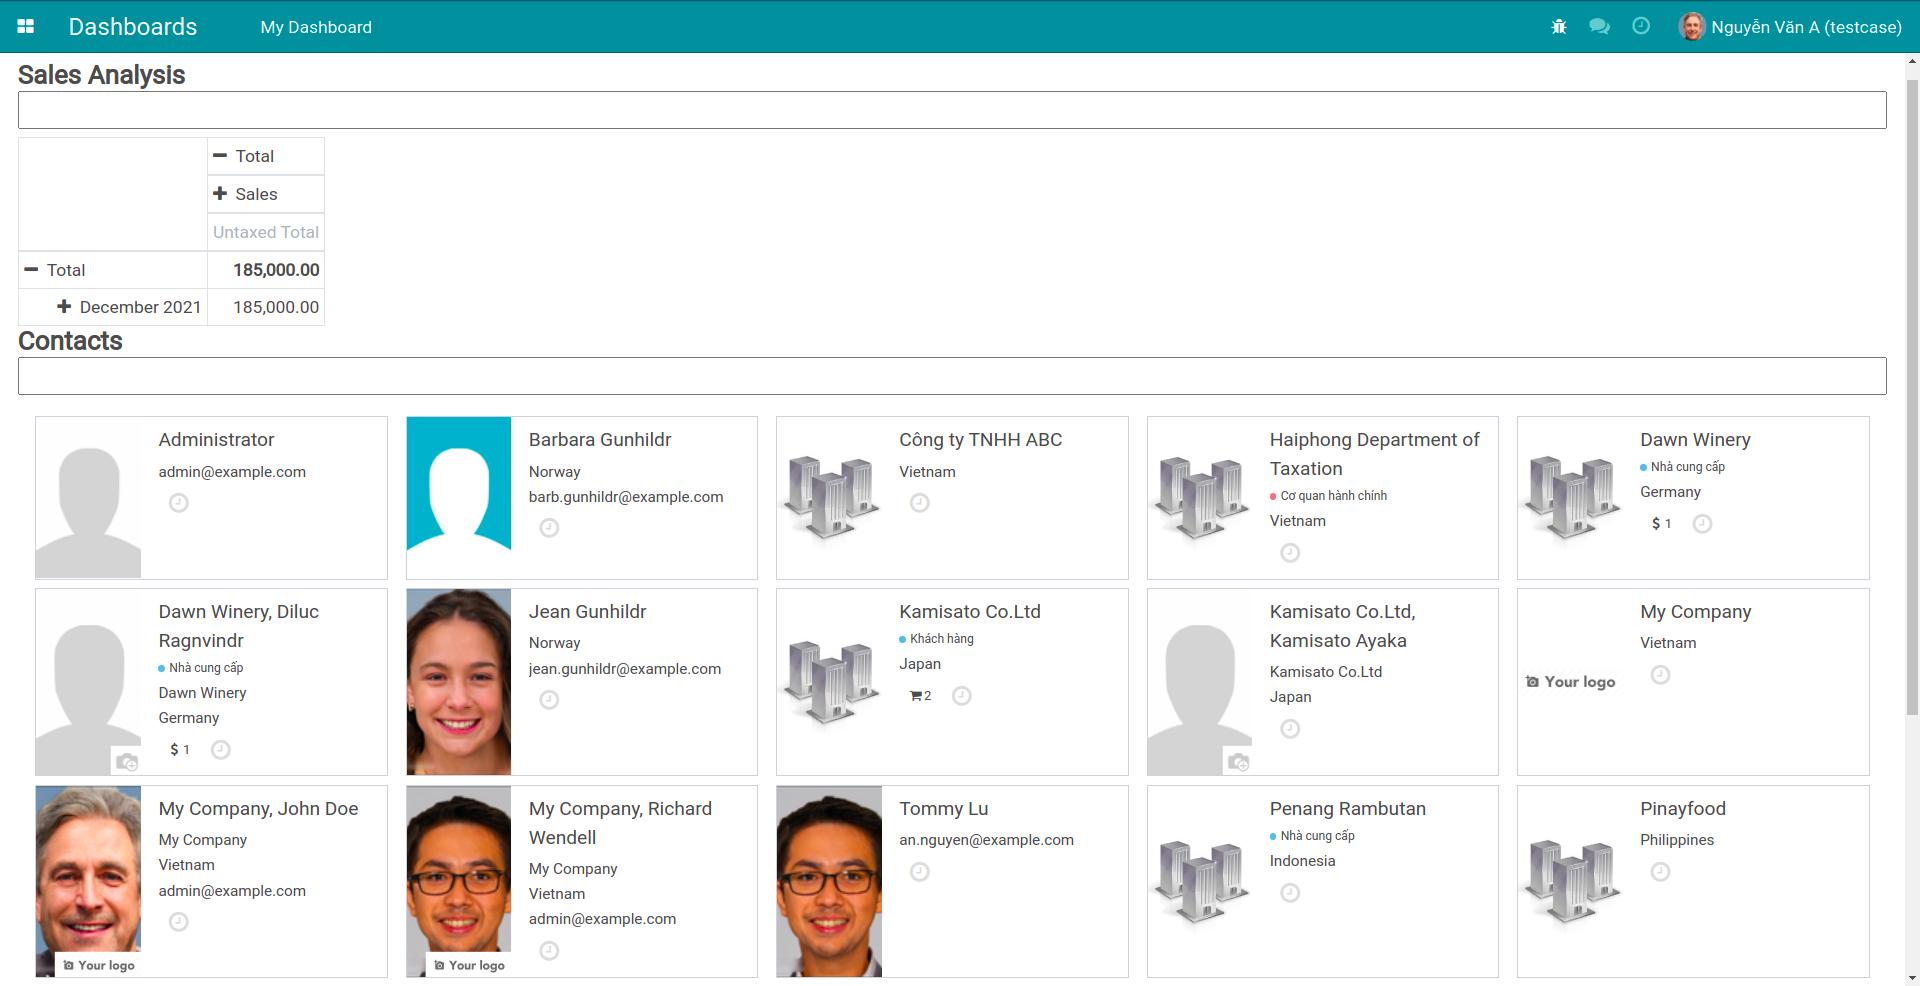
Dashboard view
The Dashboard view is an all-in-one type of view that contains data presented in other view types. The purpose of this is to aggregate necessary information into the same view, users can monitor many customized information without having to access different menus.
For example: In Viindoo software, you can use Dashboard view with Dashboard application. This application aggregates all reports or records that you have favourited (access to any list of records or reports, press Favorites > Add to my Dashboard).
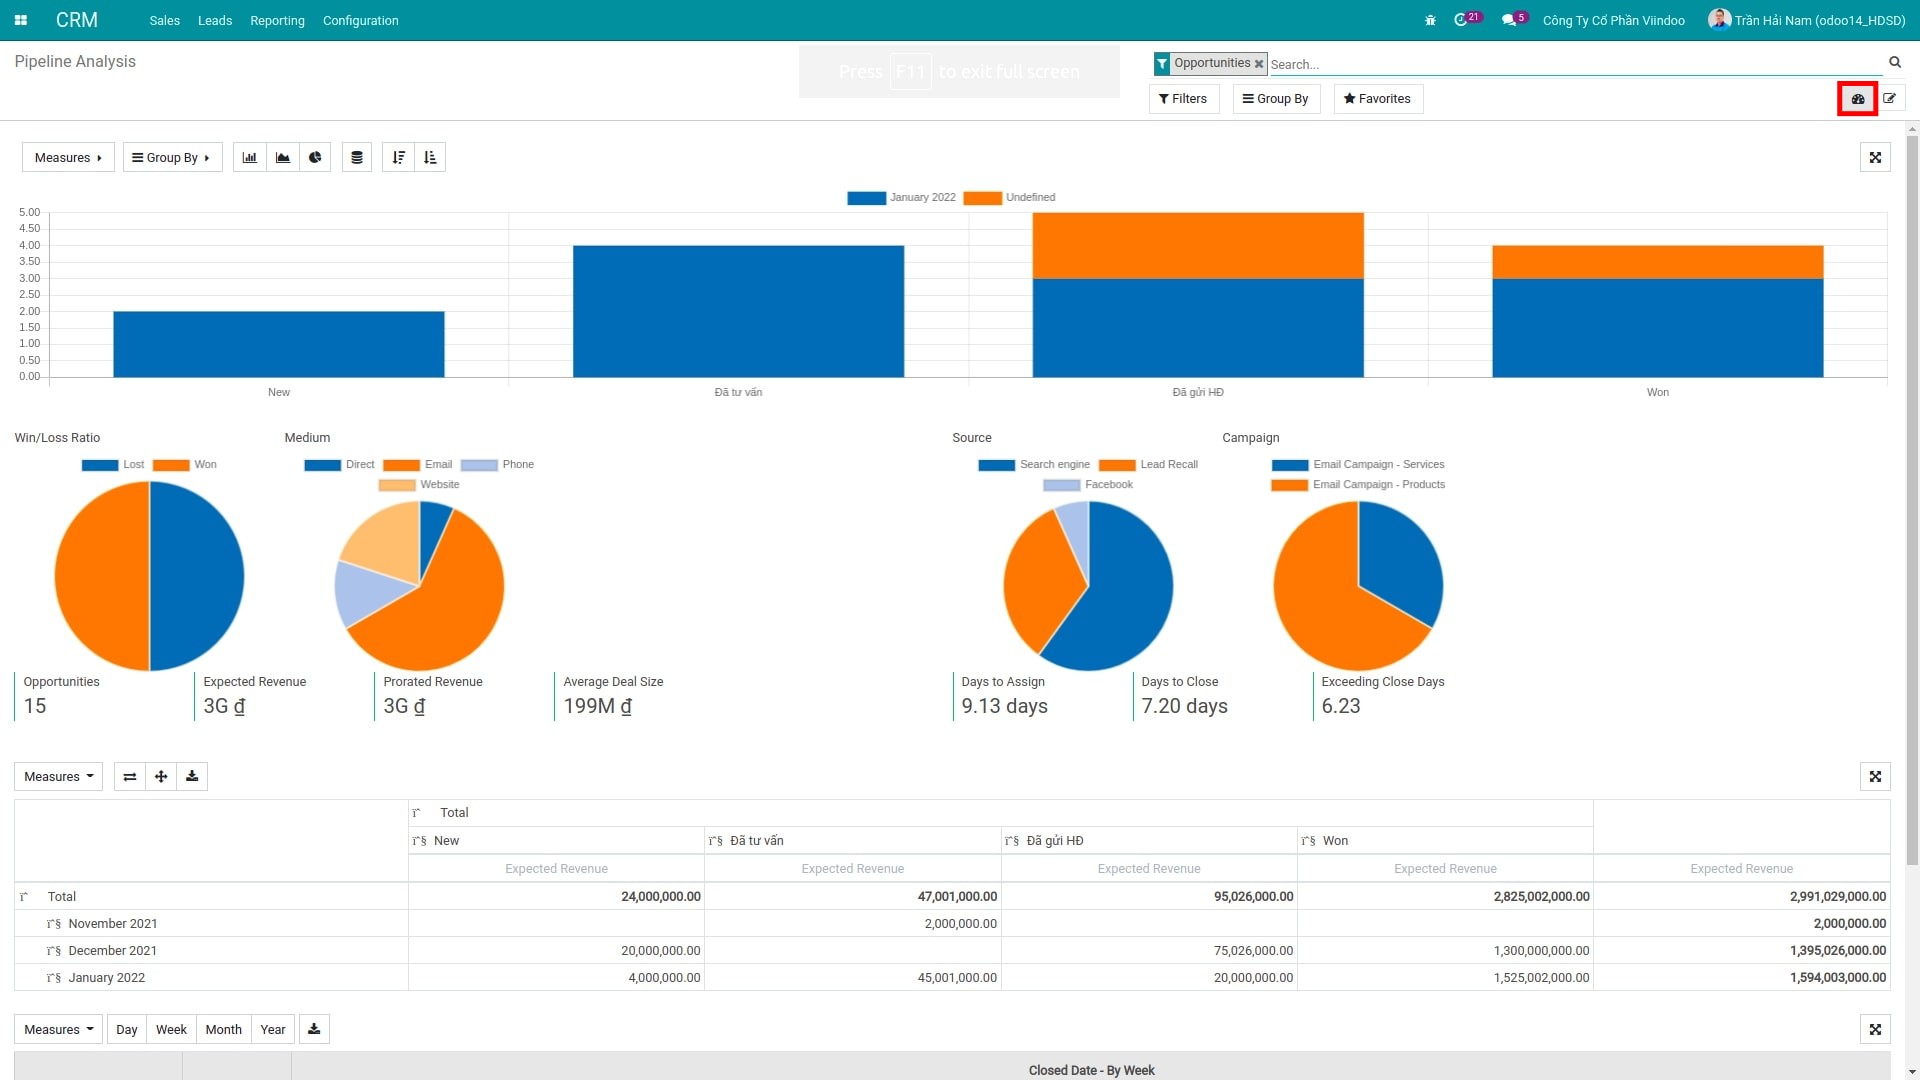
Besides, this view is also used to report for some other applications such as CRM:
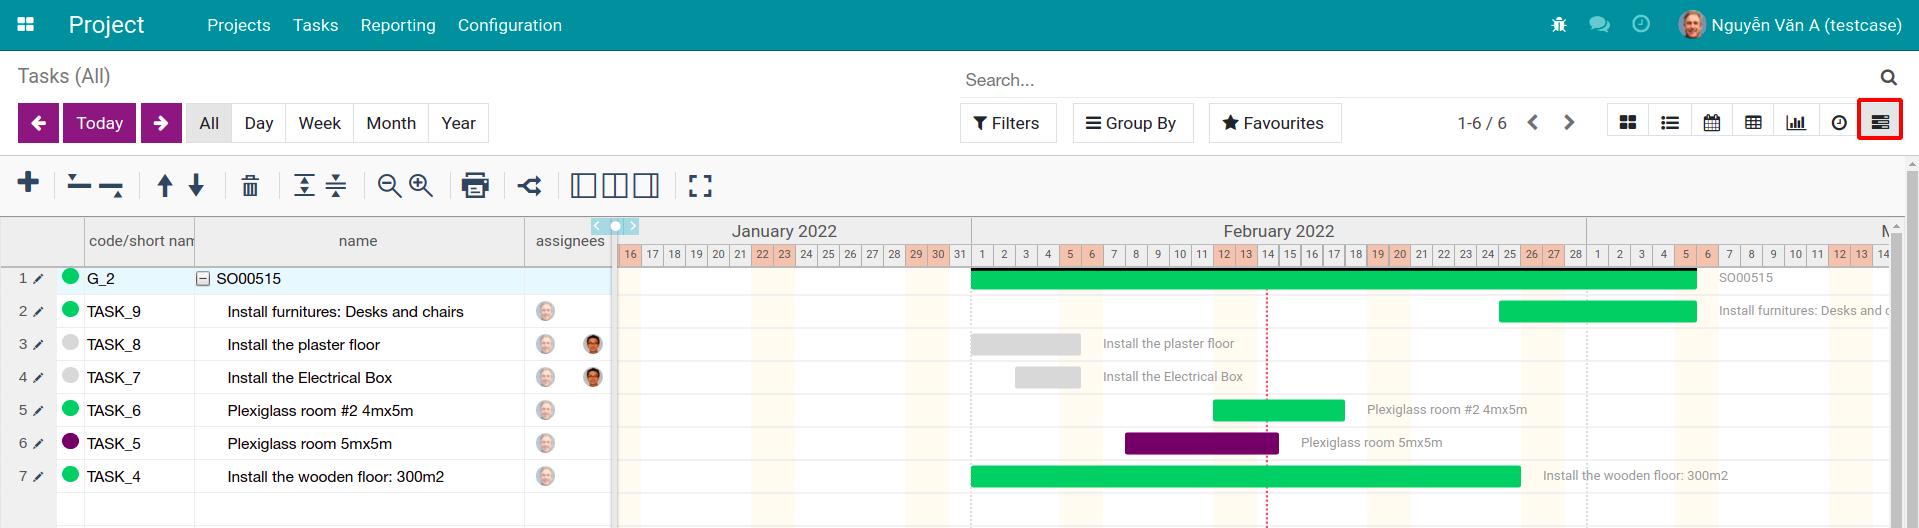
Gantt Chart view
Gantt chart allows users to track the progress of tasks and projects in a time chart form. For example: Navigate to the Projects app. If you installed the Gantt chart module, you could see the view switch button is at the top right corner of the screen. Click the button to switch to the Gantt chart view.
Organization chart view
This view allows you to arrange records in the form of an organization chart, applicable to hierarchical records such as OKRs.