Maintenance Reporting
Viindoo’s Maintenance application helps you track the number of maintenance requests by devices, technicians, or time-consuming.
Currently, Viindoo supports the following types of reports:
Graphs like bar, stack, line, pie;
Pivot table;
List;
Calendar.
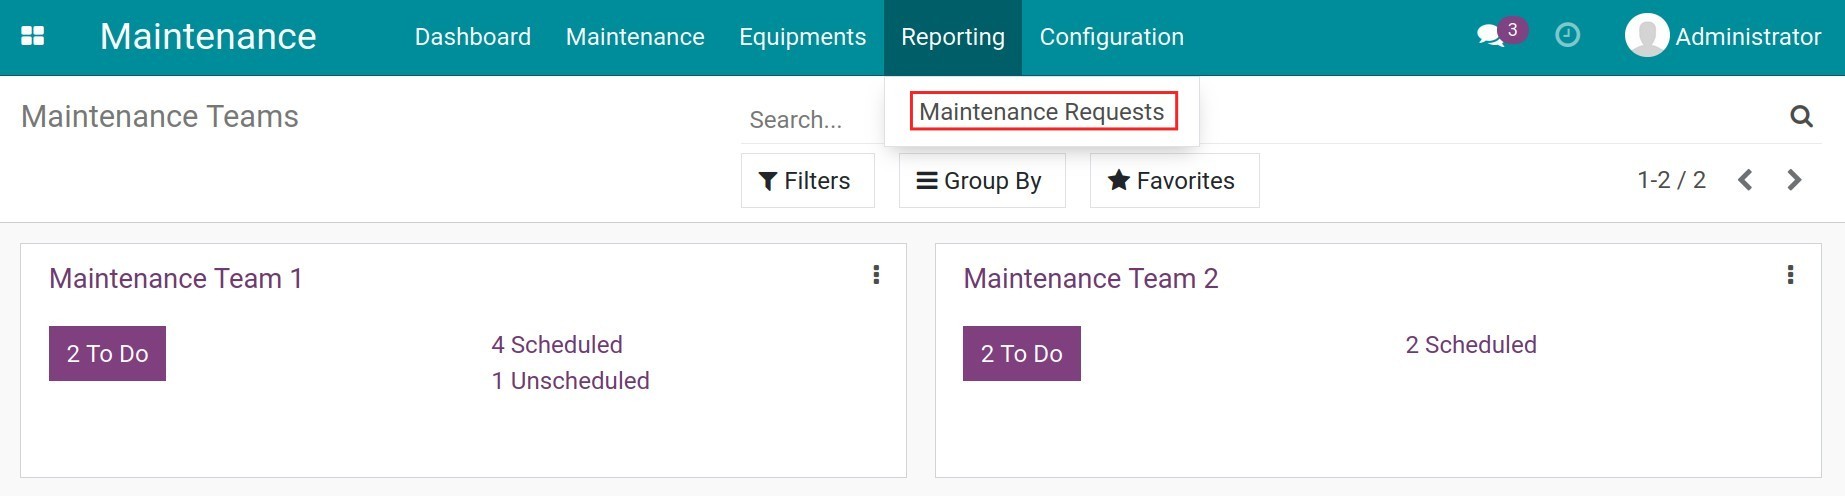
Report in graph
Navigate to .
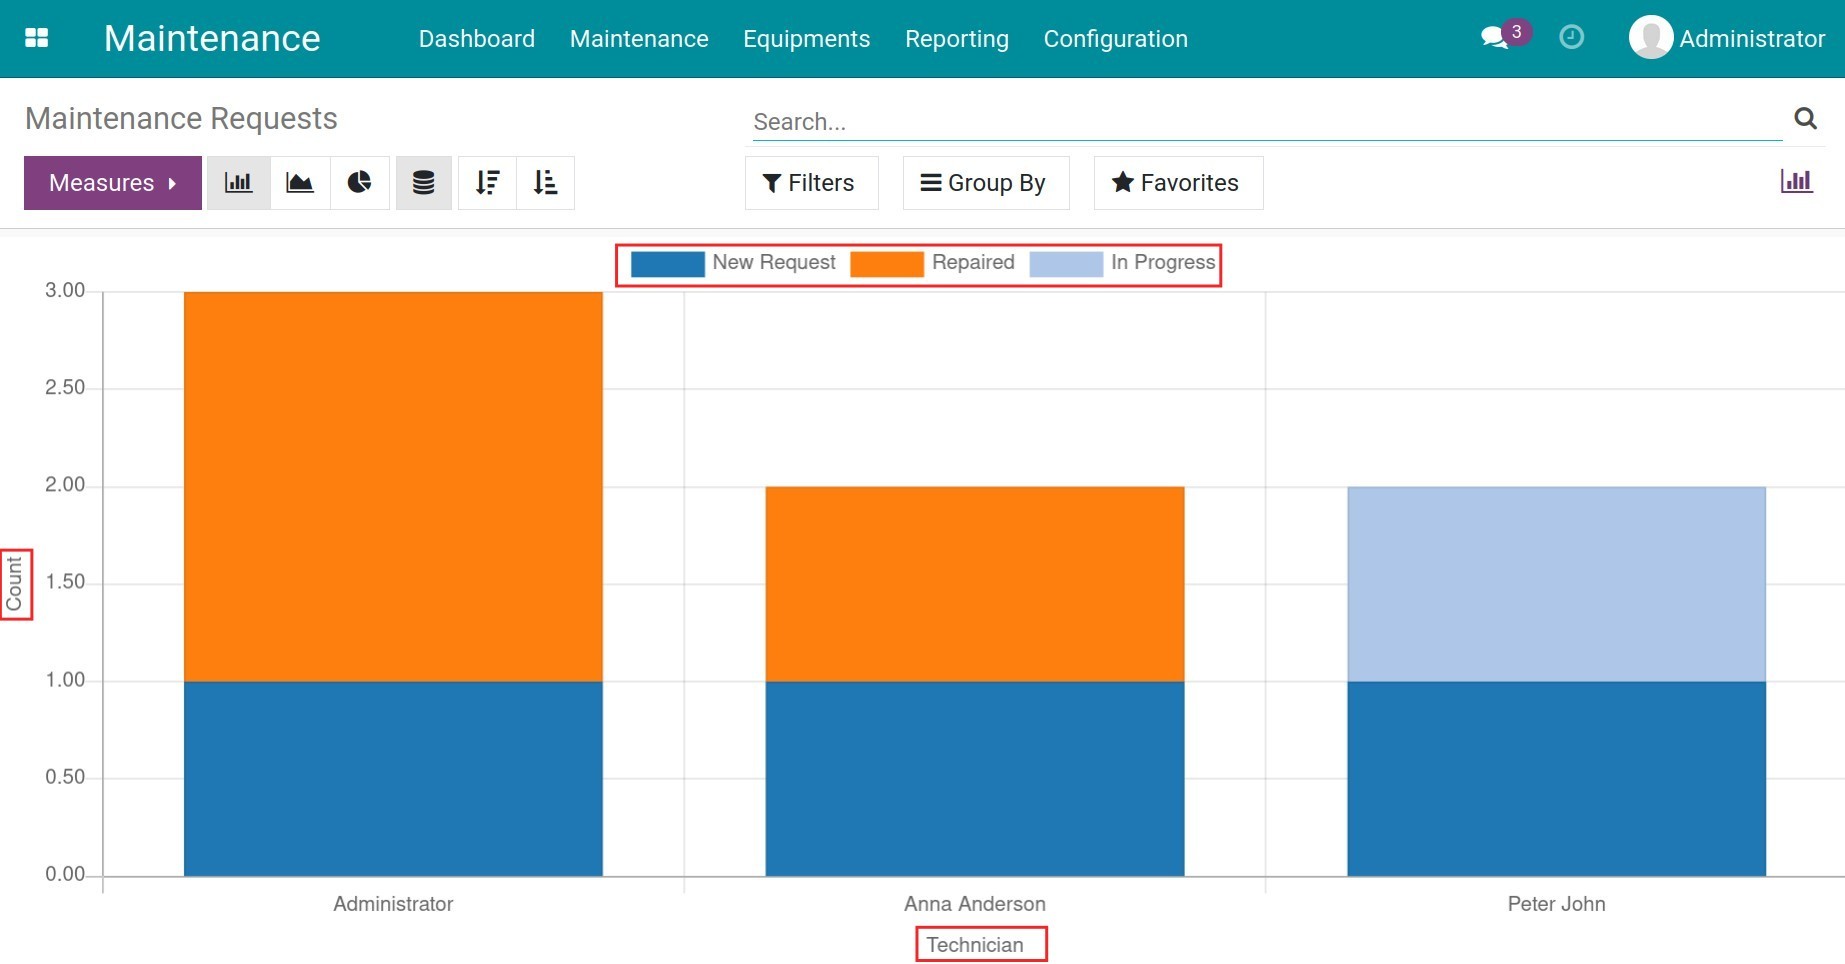
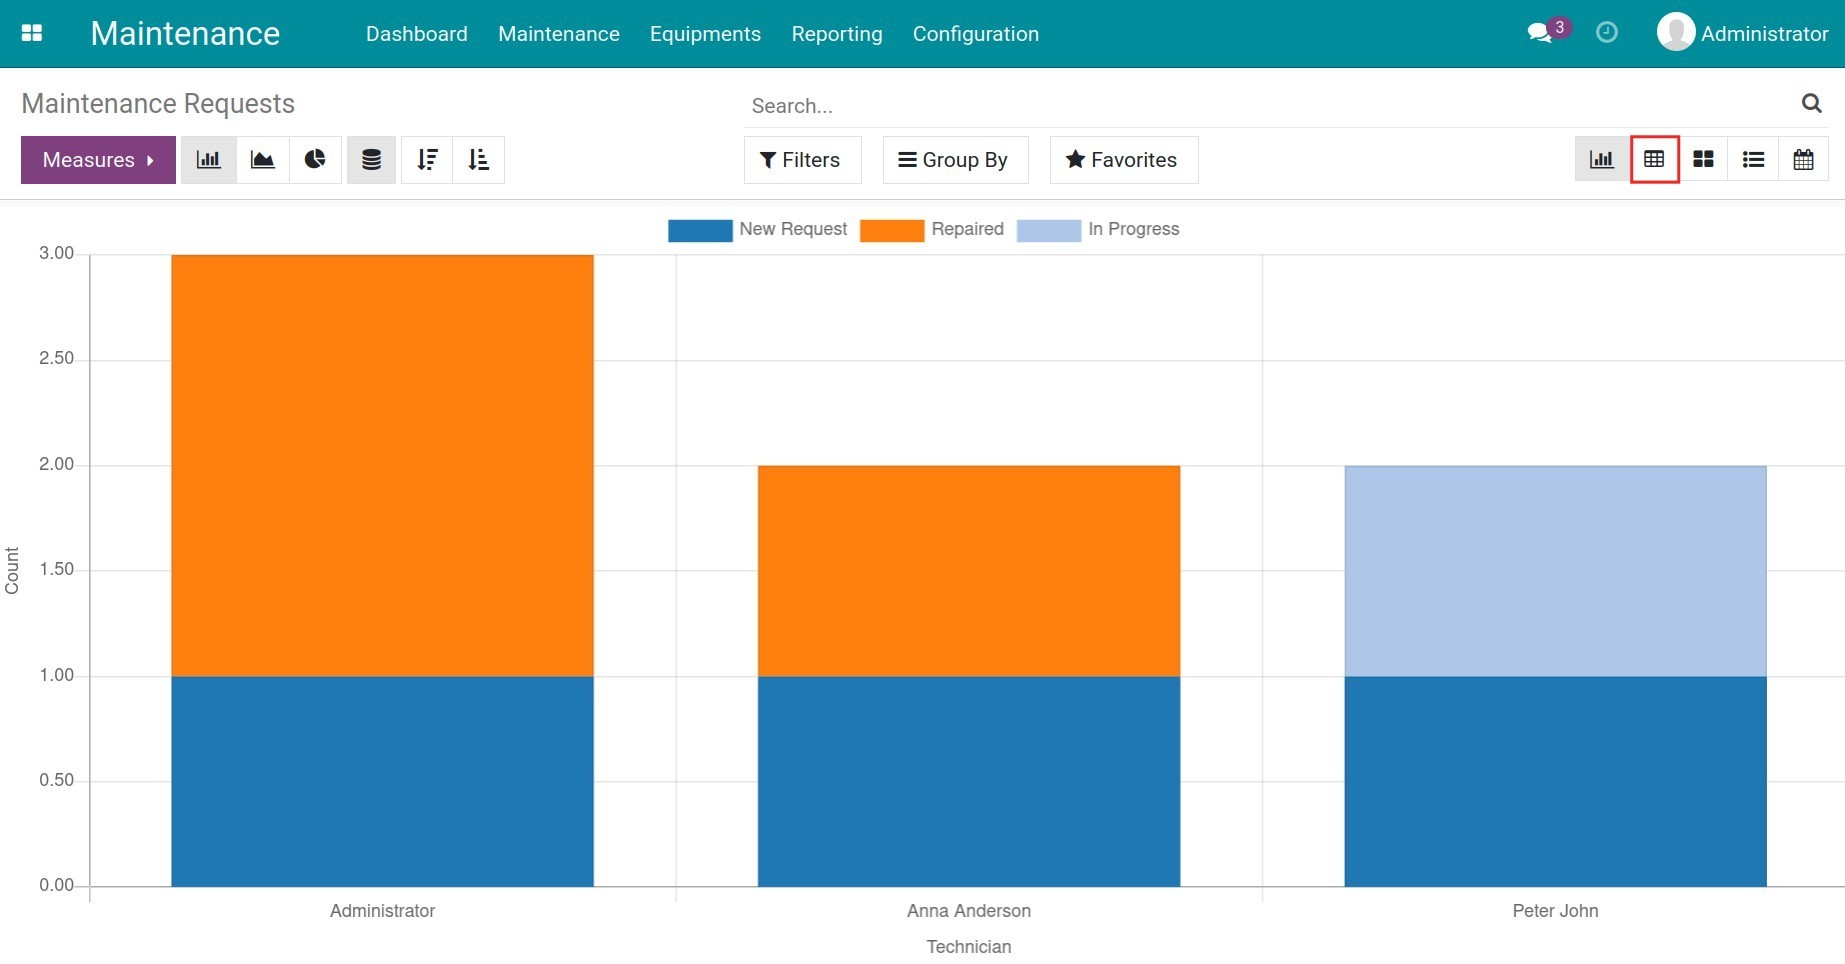
By default, the system displays the bar chart in stacked columns with the criteria in the Measurement according to the number of maintenance requests (Count). That corresponds to the criteria in the vertical axis. The criteria of the horizontal axis are classified by each Technician and stage. This chart allows you to track the totally new, in-progress, and repaired maintenance requests by employees.
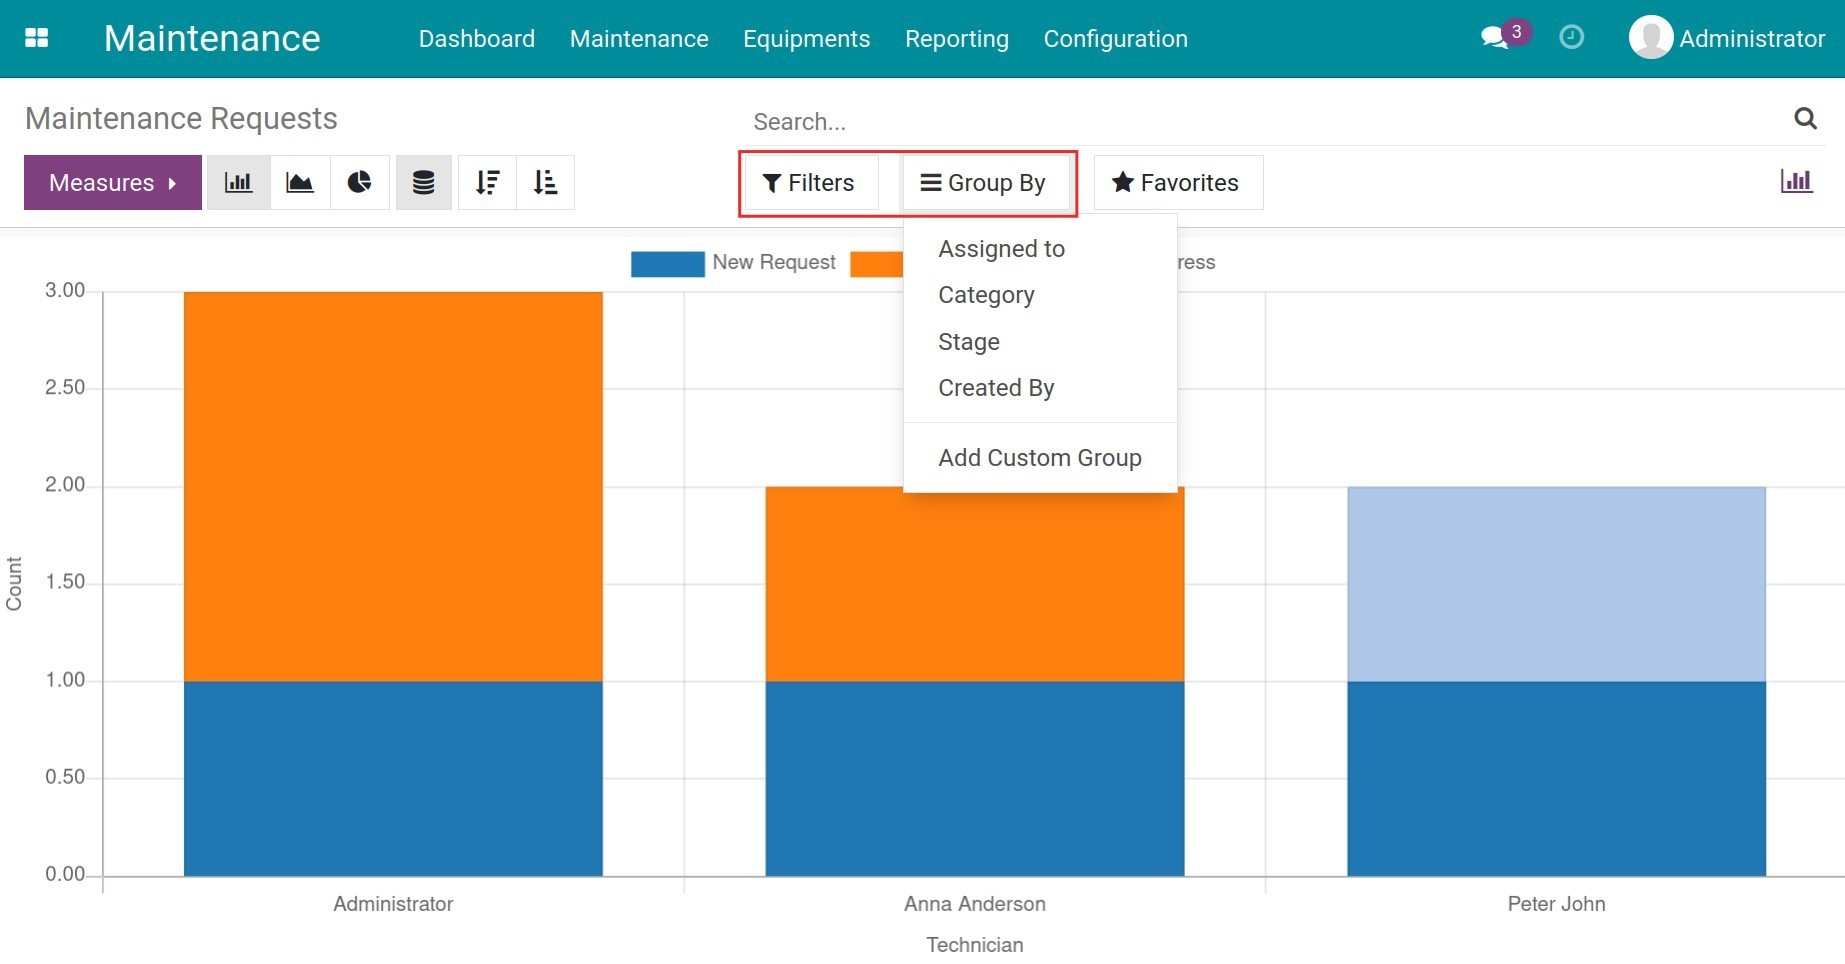
You can change the vertical axis in the Measures section and use the Group by feature to change the horizontal axis value, for example, group by Device, Stage, etc. Refer to Filter, Groups and Search use cases article about the Filter/Group By features.
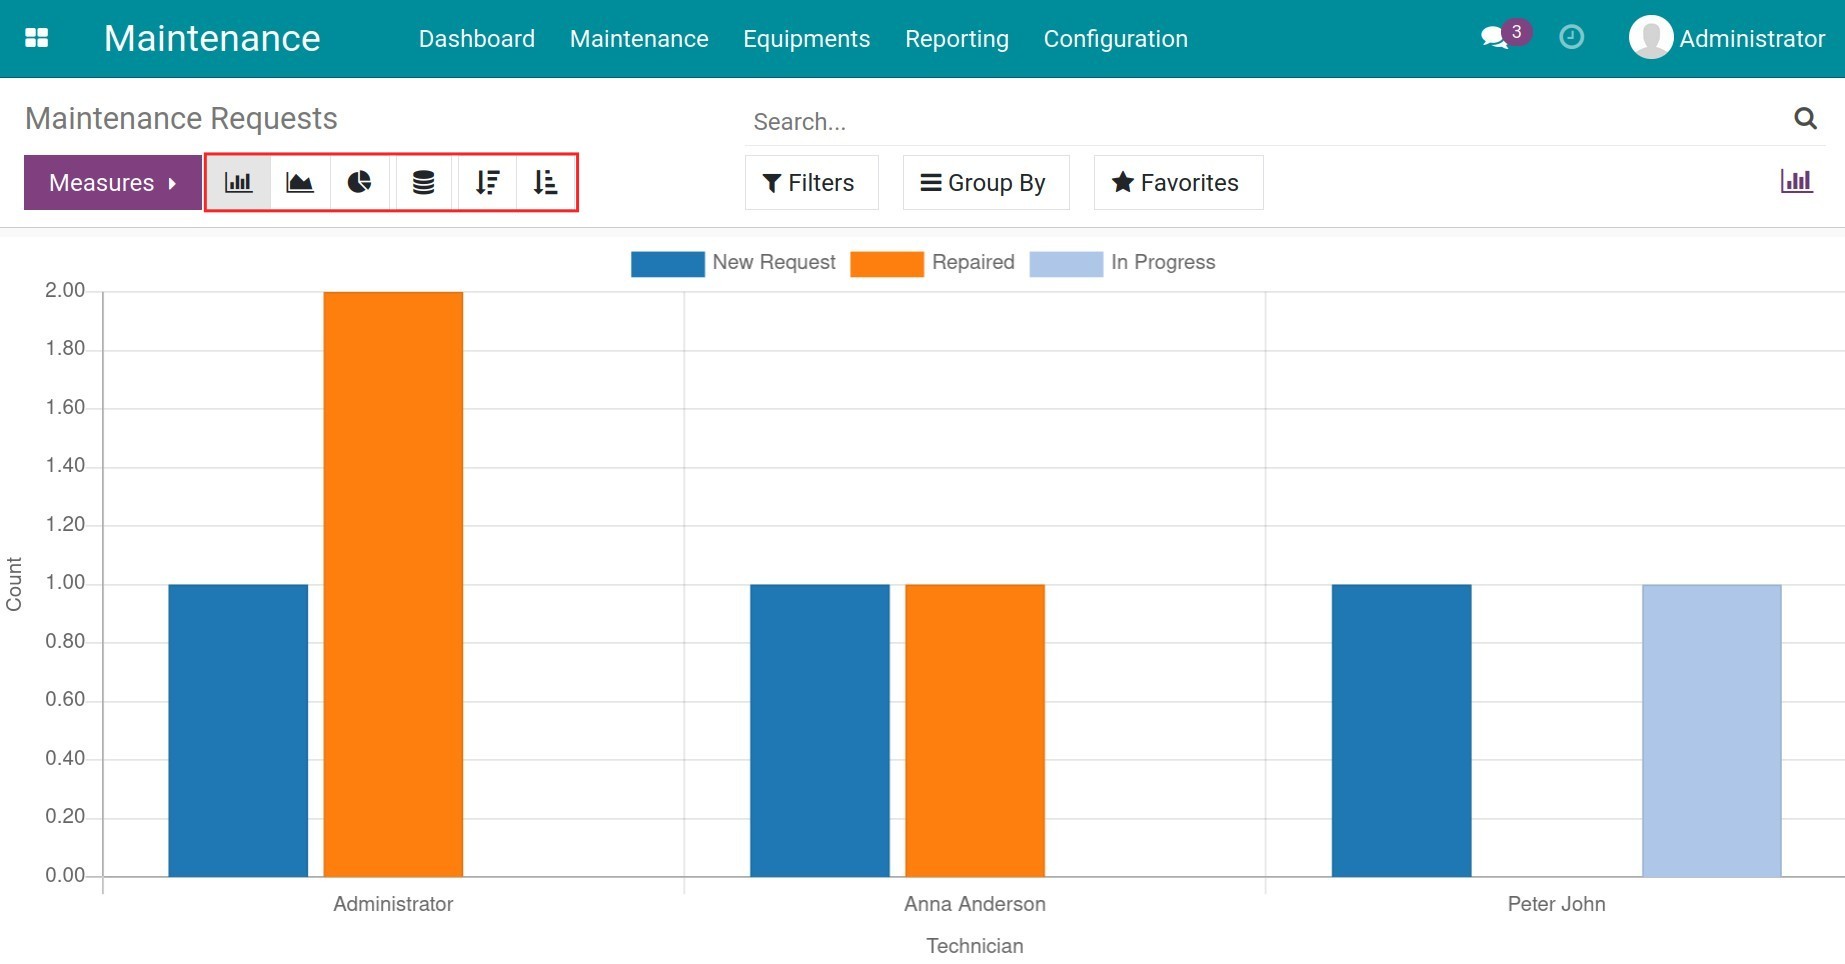
In addition, the software supports other chart interfaces such as pie or line charts. You click on the corresponding icons to switch to other reports and can sort the horizontal axis values in ascending or descending.
Report in pivot table
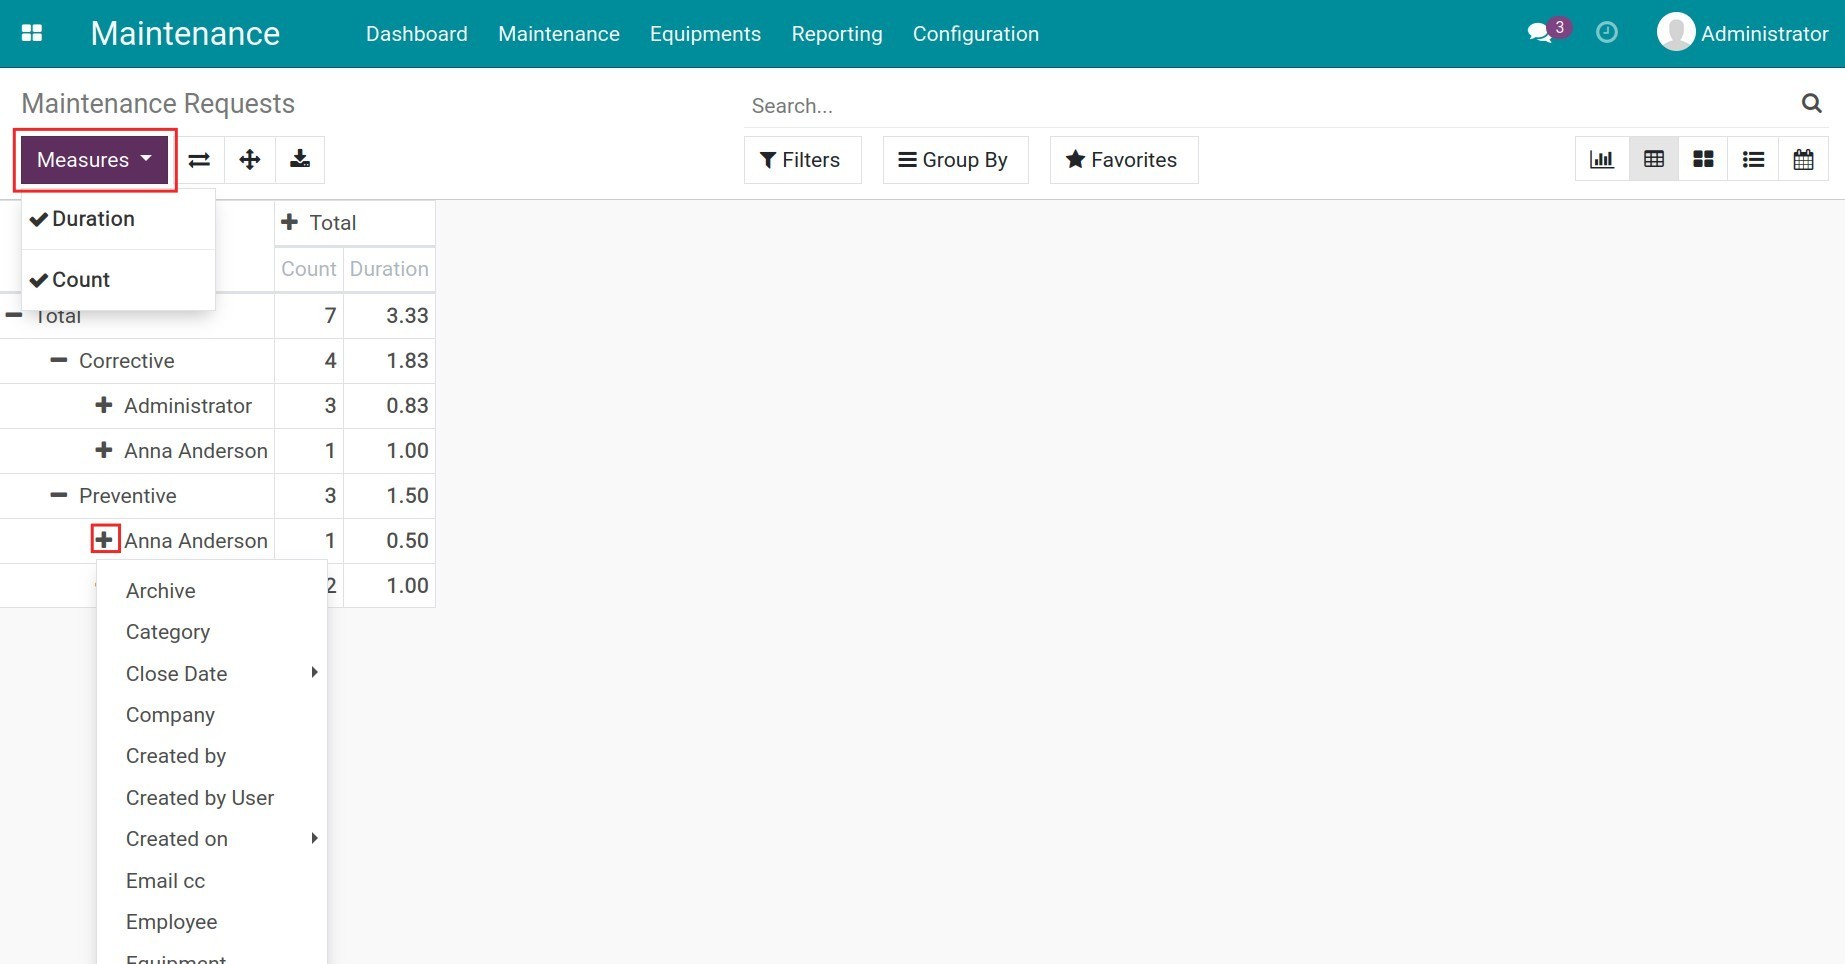
The pivot table shows the specified analysis data according to the maintenance requests of the employees. Click on the table icon in the right corner to switch to this report.
By default, the system displays the Measurement by Count. The pivot table allows you to combine multiple metrics at once. Click on + to select the desired criteria, for example, by Technician, Equipment, Maintenance Type, etc.
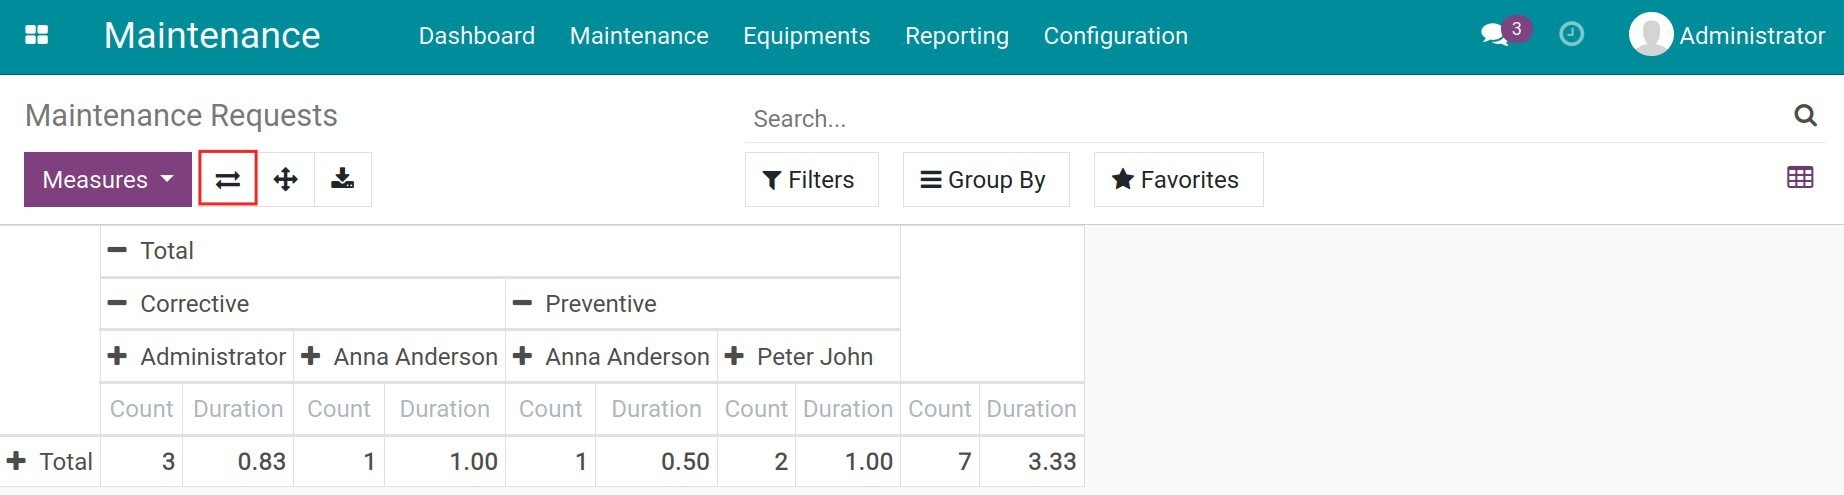
Moreover, you can swap the positions of columns and rows.
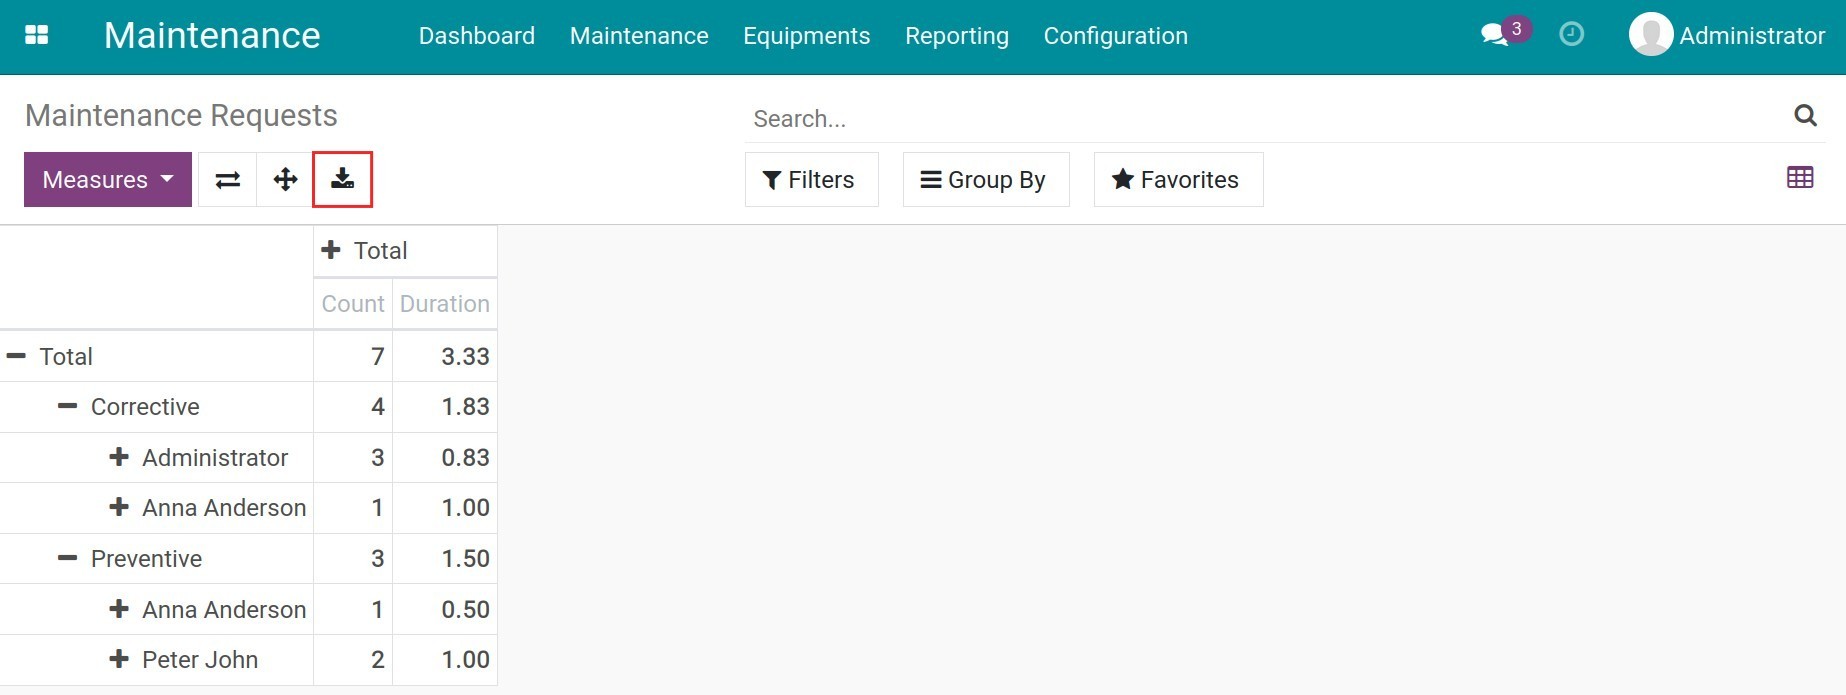
The system not only supports viewing the report directly, but you can also export the report with the selected criteria to excel by clicking the Download xlsx button.
Other reports
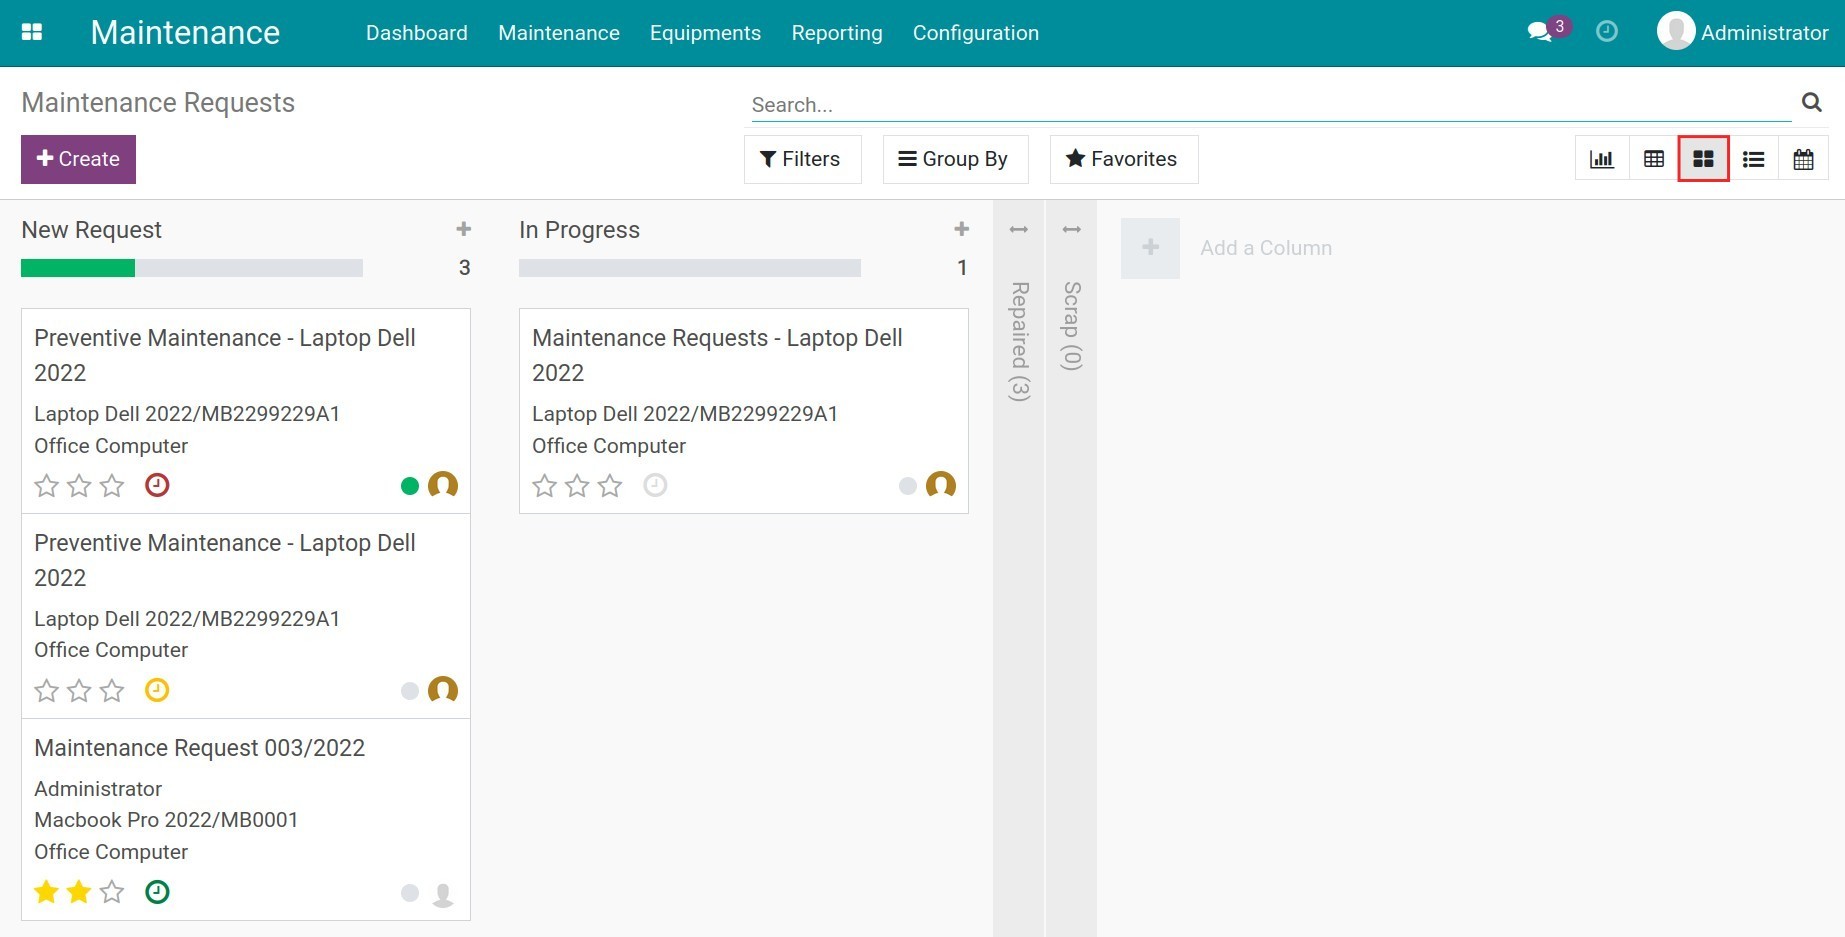
To switch to other reports, you click on the corresponding icons. With the Kanban view, the system will display the maintenance requests with the configured stages.
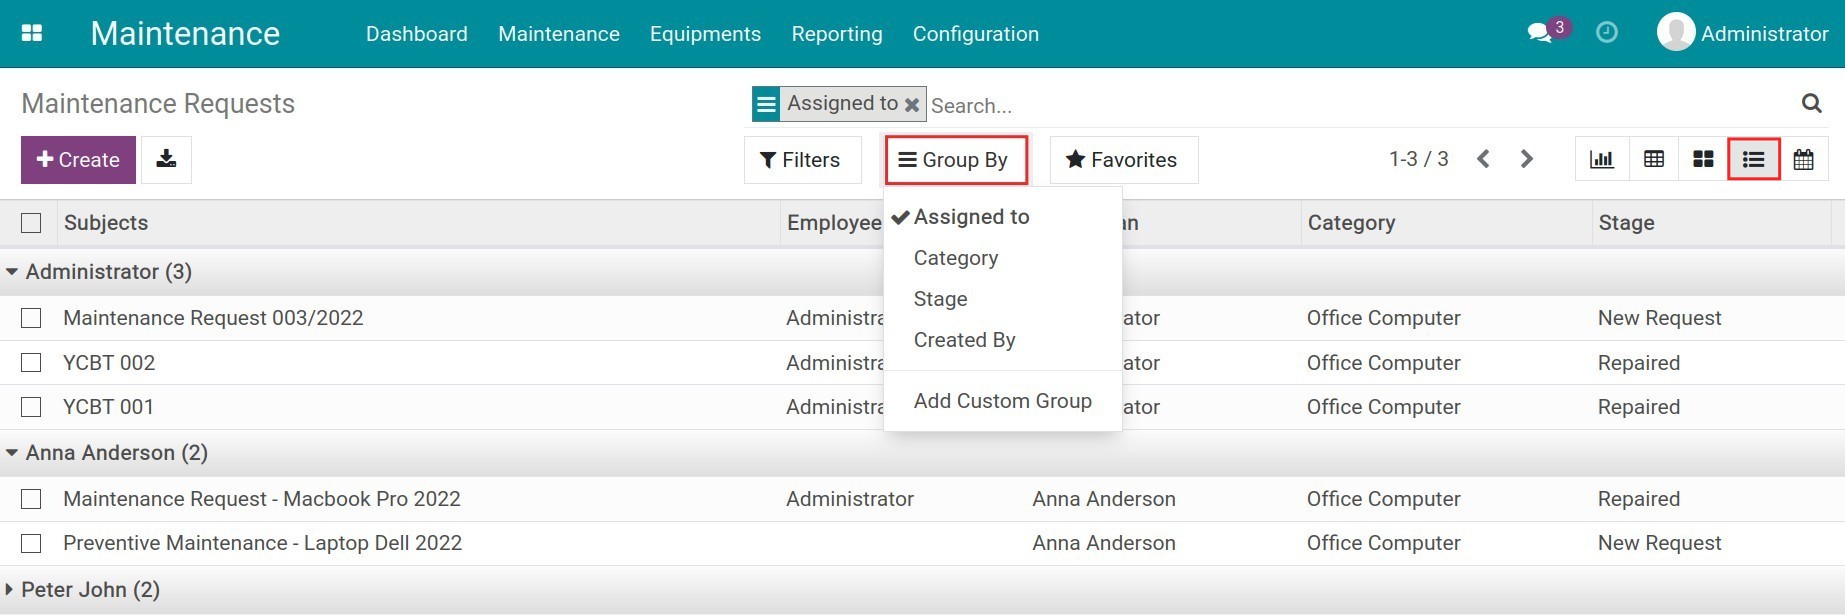
With the List view, you use the Filter/Group By features to customize the report, see more at Filter, Groups and Search use cases. With this view, you can also export to excel.
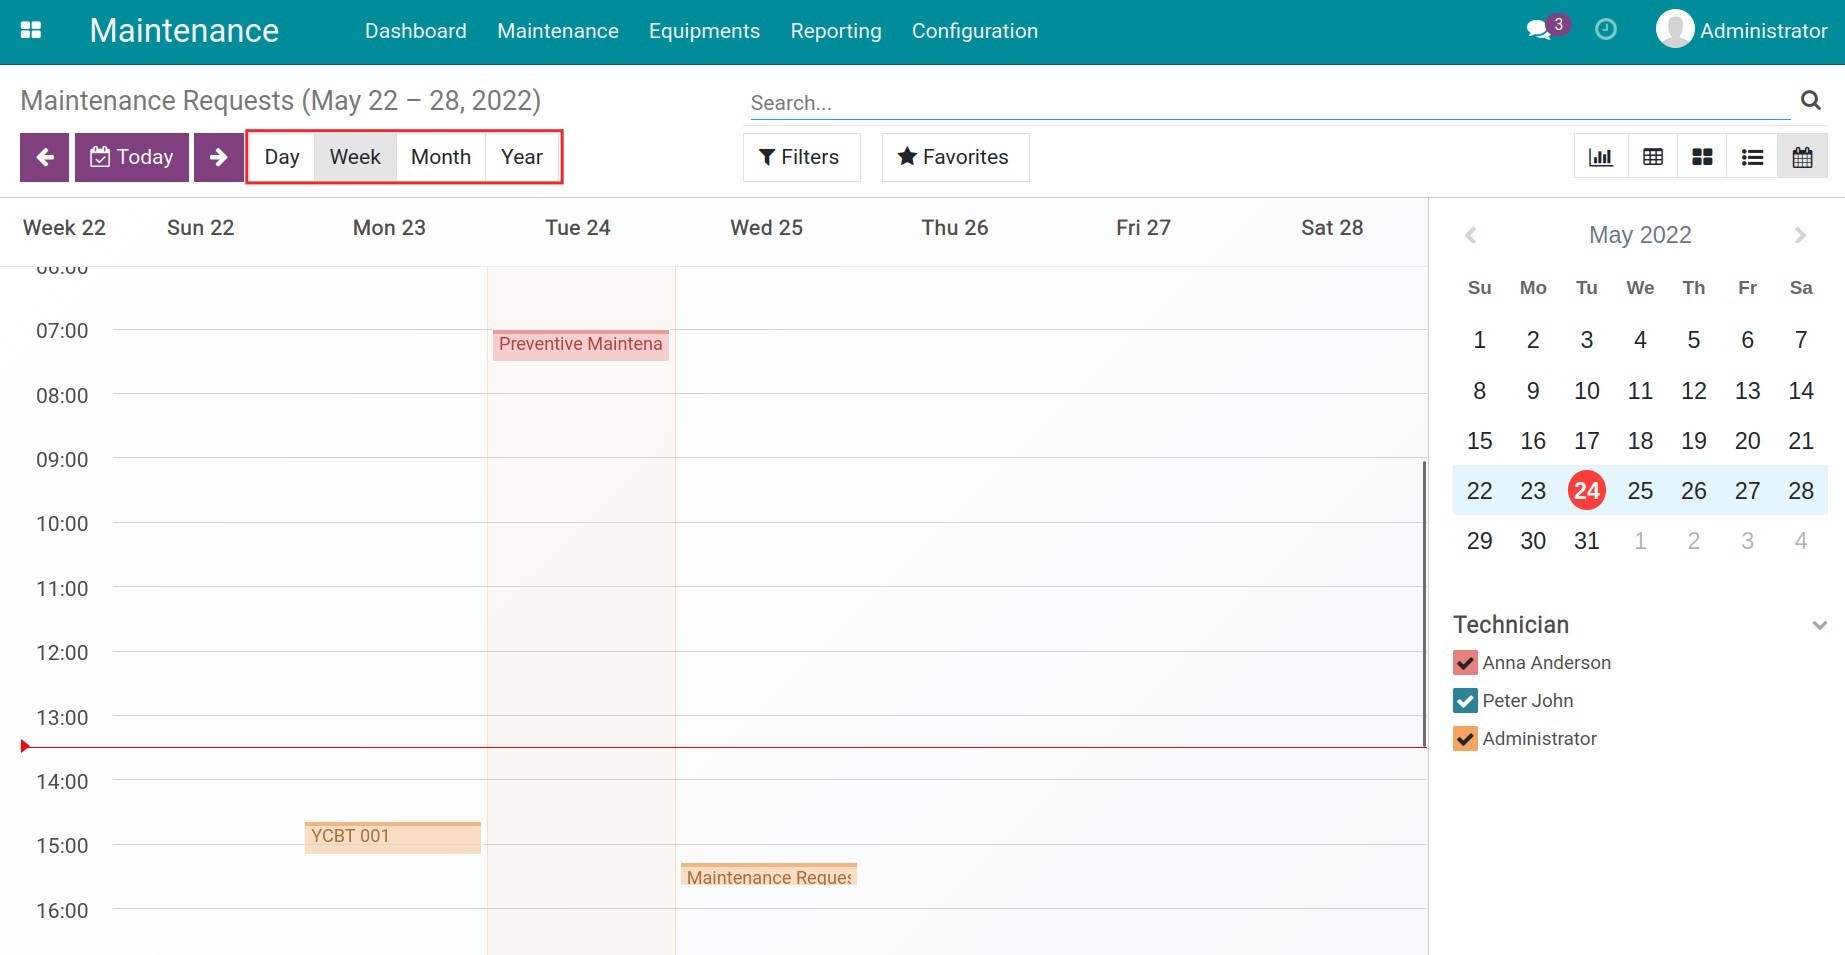
With the Calendar view, you can see the maintenance plans of all technicians by Day/Month/Year to get an overview of which technicians are busy at the specified time.
See also