Understand ECO reports
Viindoo Product Lifecycle Management (PLM) app supports you to view the report of the product’s engineering change orders (ECO).
First of all, you need to have the ECOs. To learn how to create ECO, refer to What is an engineering change order.
To view the report, navigate to .
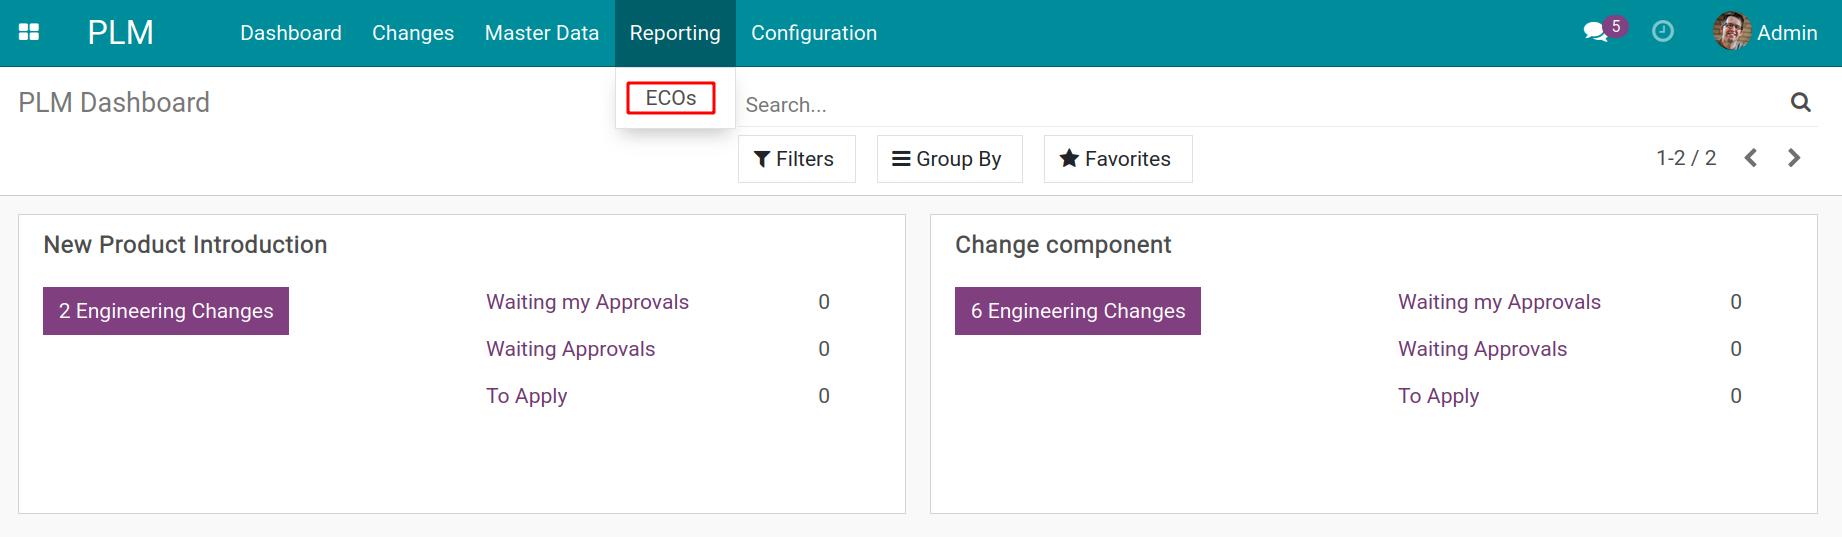
You can view the report in pivot or graph:
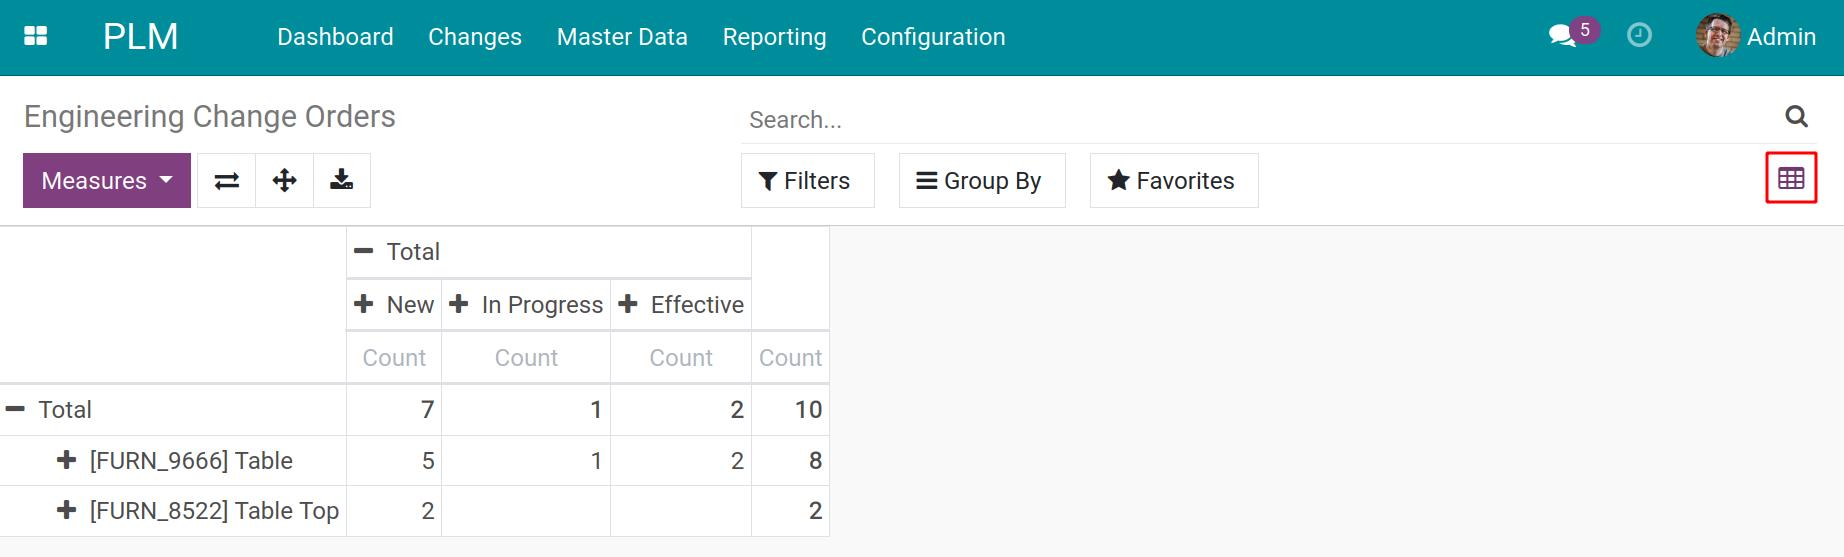
Pivot view: With the default setting, the system will display the pivot report.
![Pivot ECO report]()
This report type provide the following measures:
Color;
BoM Revision;
Count.
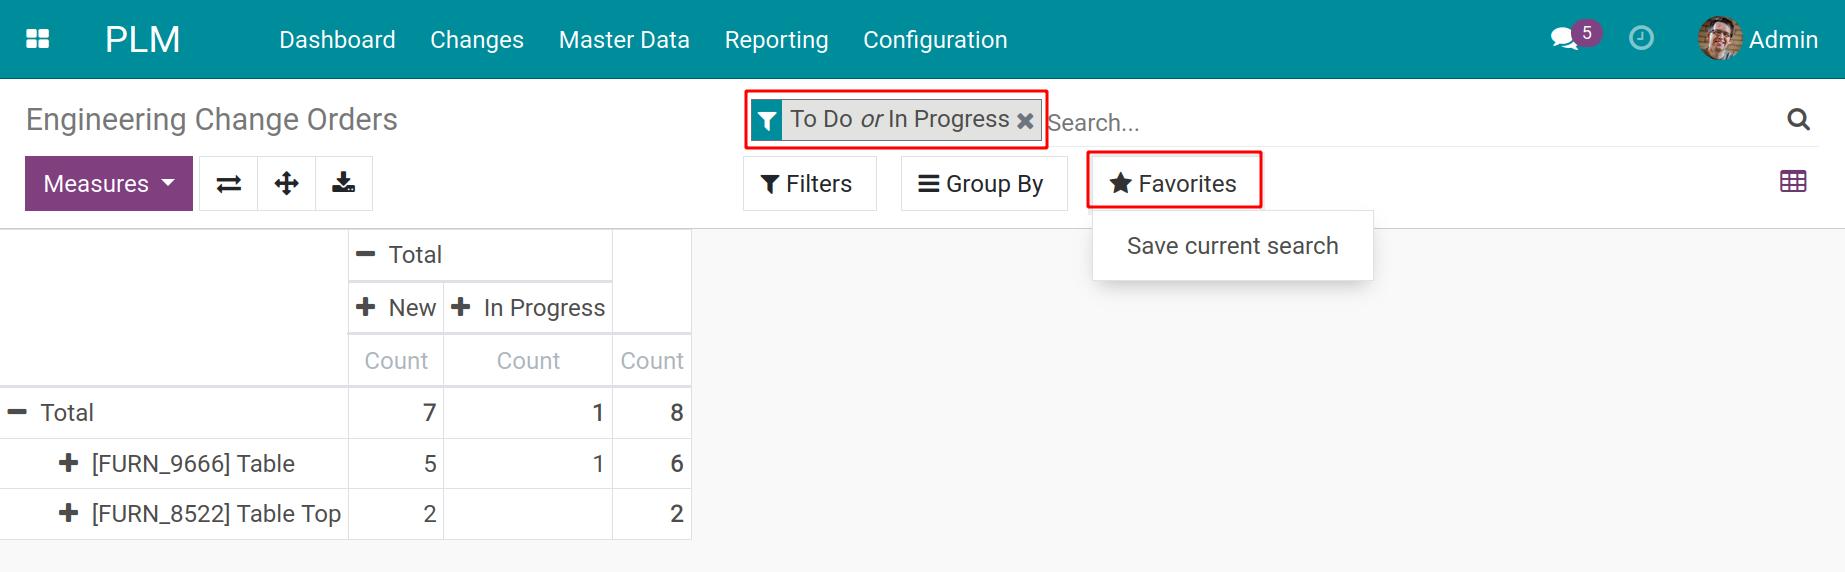
Here, you can analyze the ECOs based on stages, BoM Revision, you can also filter and group the needed information and save the current search to make it easier to track.
![Filter and group tools]()
Moreover, the pivot report can also be exported to an excel file to use.
Graph view: To switch to the graph view, you click on the graph symbol on the right corner of the screen.
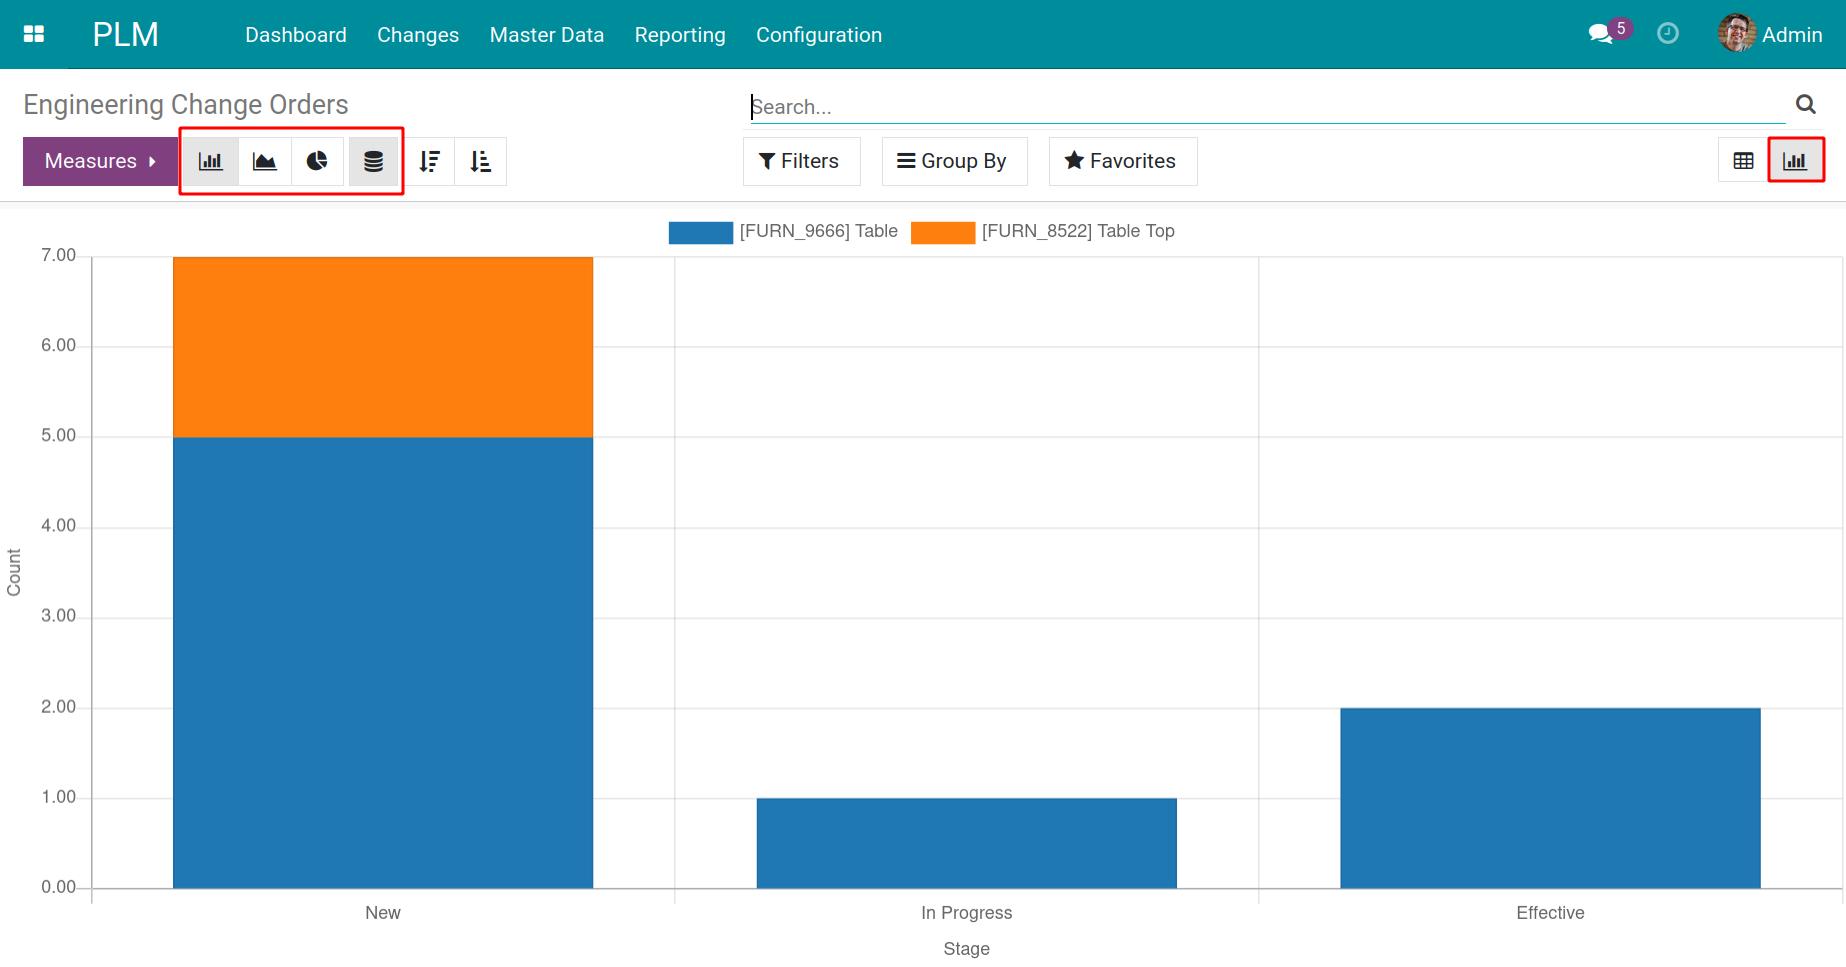
With the graph report, you can:
View the report with the same measures as in the pivot view.
View the report with different charts such as Bar Chart, Line Chart, Pie Chart, Stacked.
See also