Customize the PDF reports
With Customize, you can edit existing PDF reports (e.g., orders and quotations) or create new ones.
Requirements
This tutorial requires the installation of the following applications/modules:
Default layout
By default, Viindoo will provide you with some report templates in PDF format. Access Settings > Companies > Document Layout.
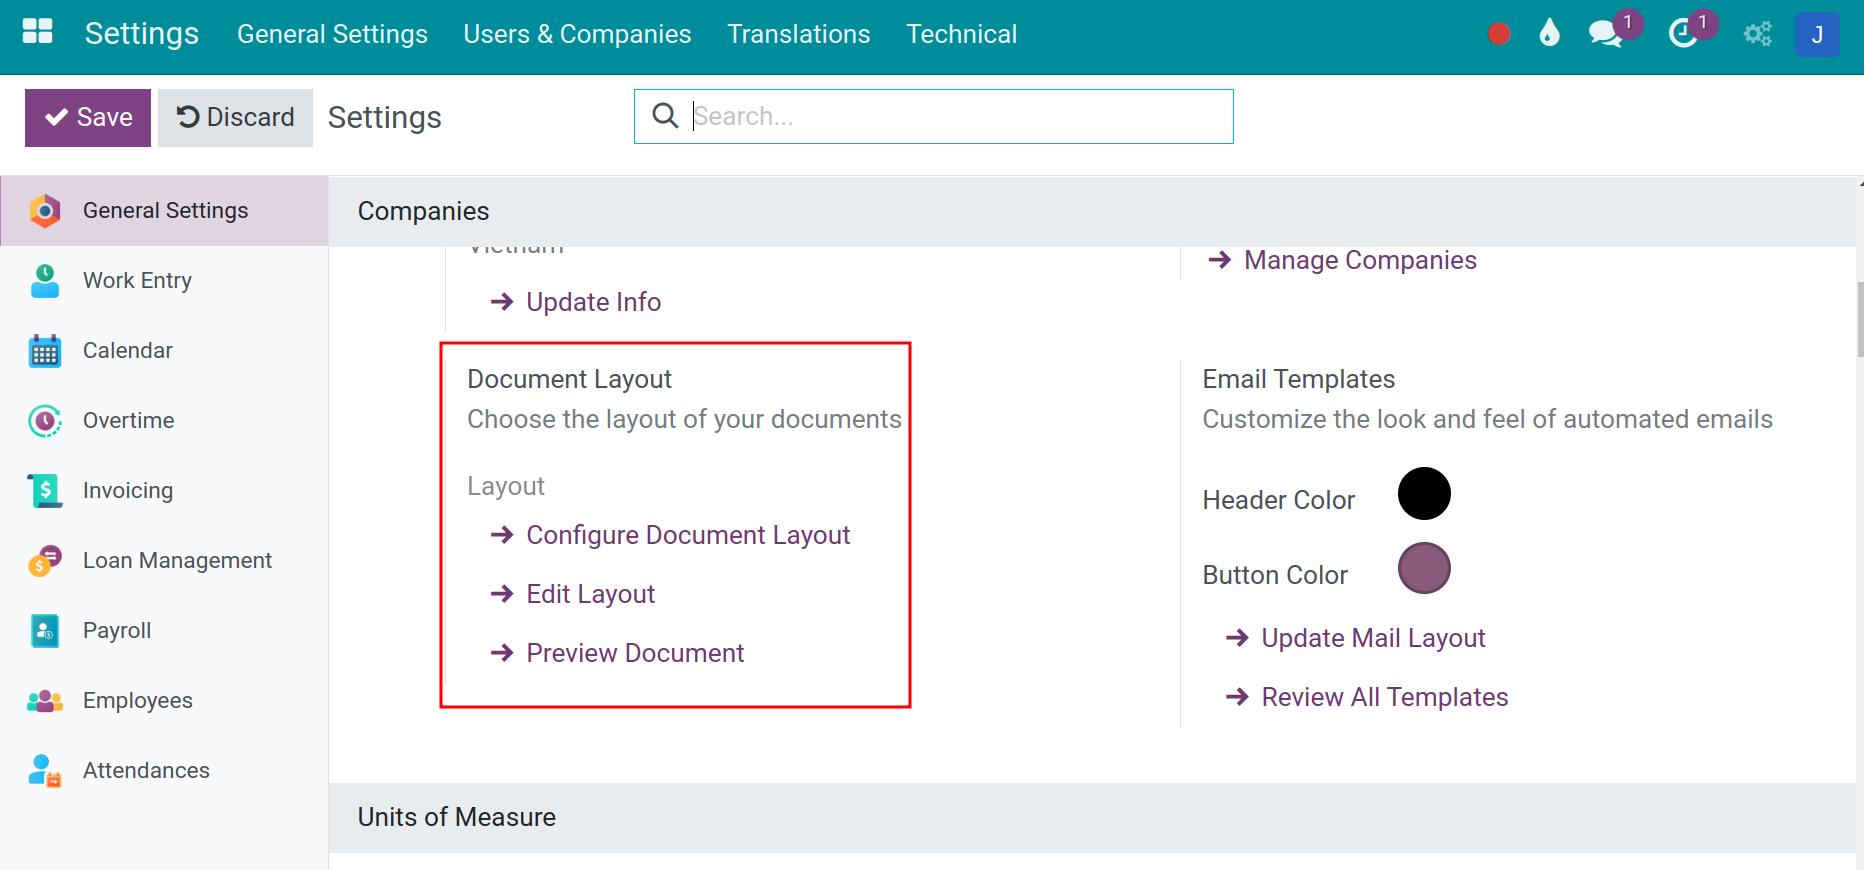
And select Configure document layout to view and set up report templates. The formatting applied here will be applied to all reports.
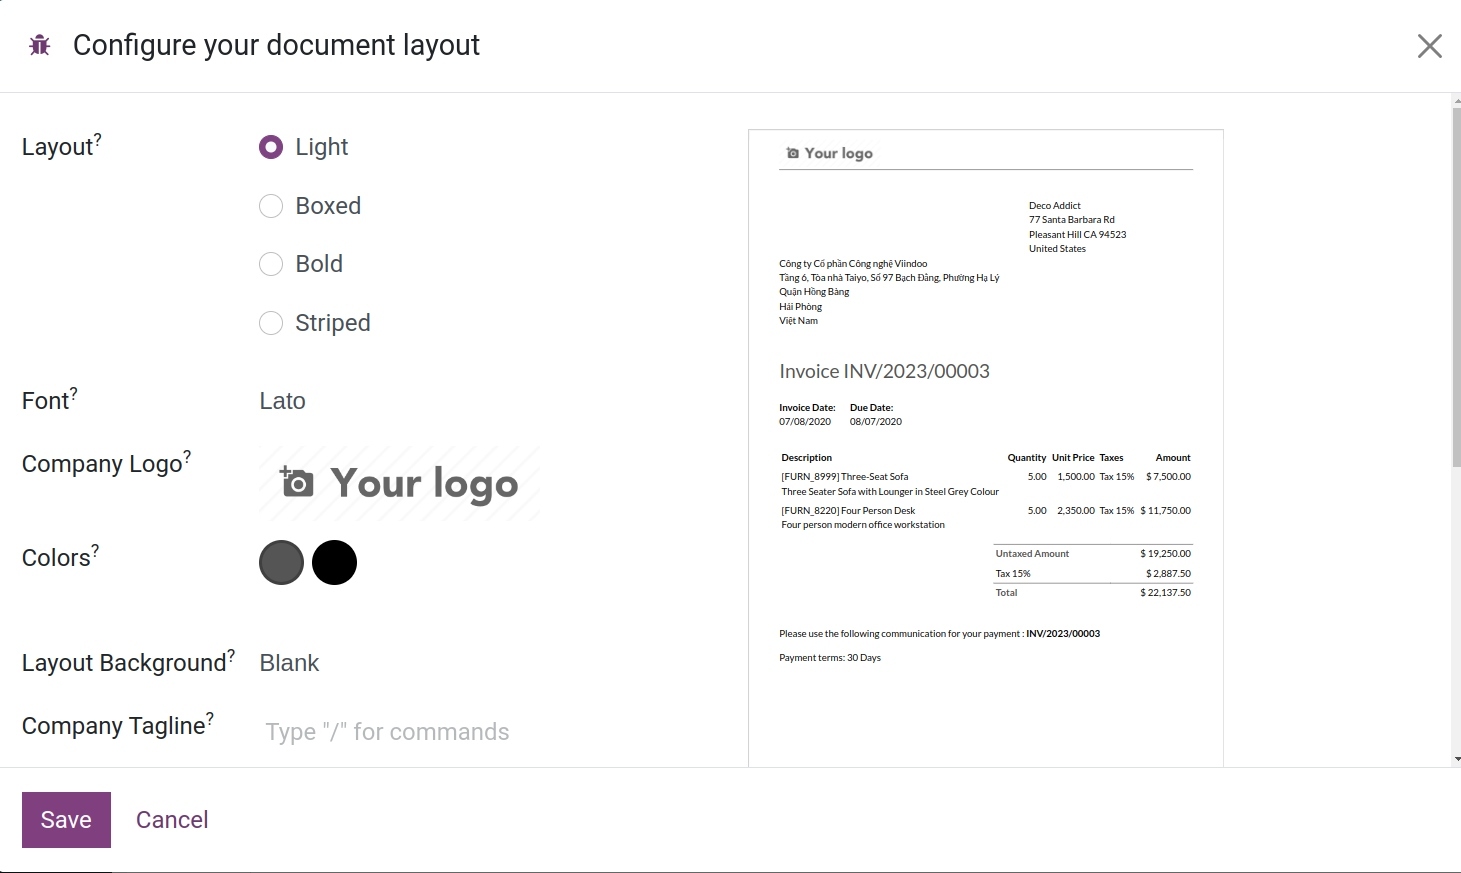
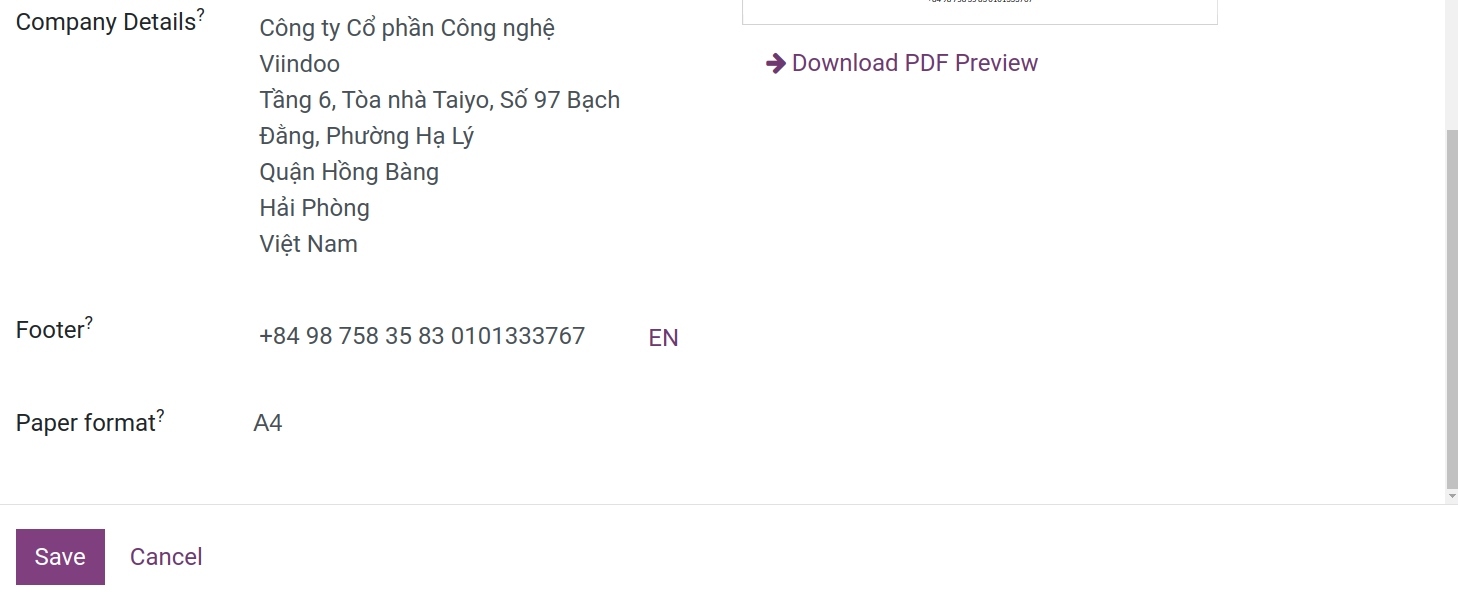
The report configuration includes the following information. (For example, in this article about sales invoices).
Layout: Four layouts are available:
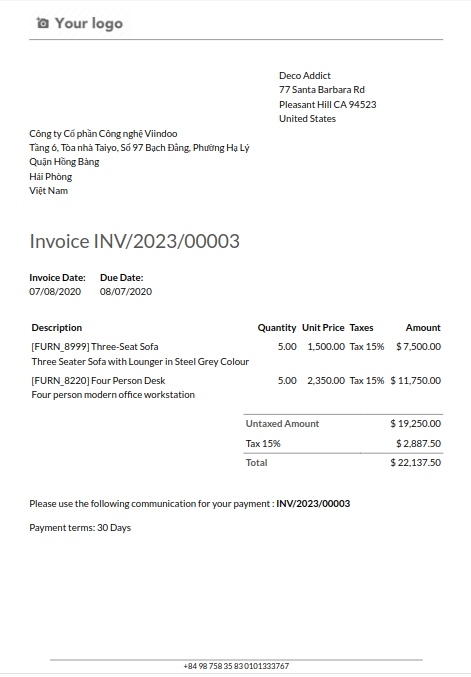
Light
![Light report layout sample]()
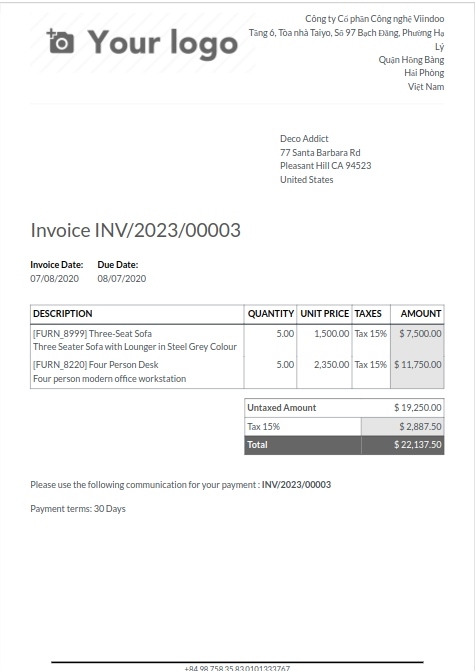
- Boxed
![Boxed report layout sample]()
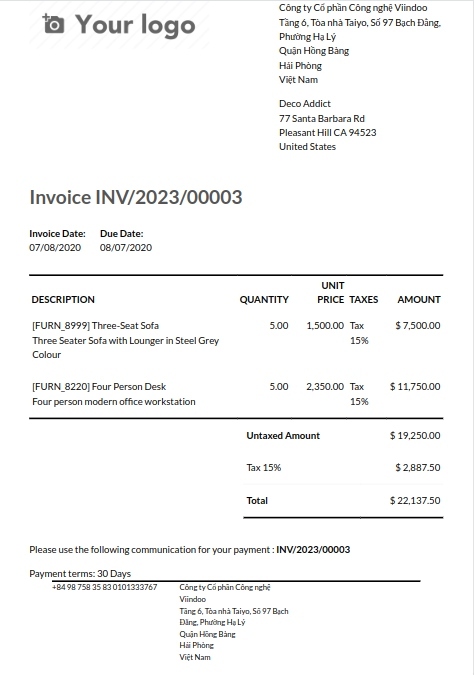
- Bold
![Bold report layout sample]()
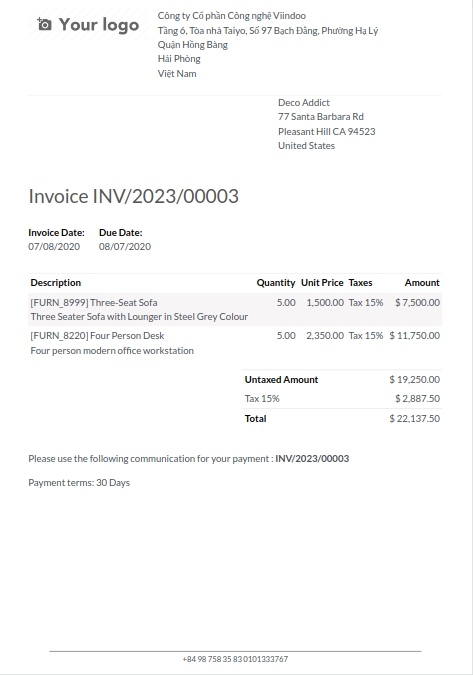
- Striped
![Striped report layout sample]()
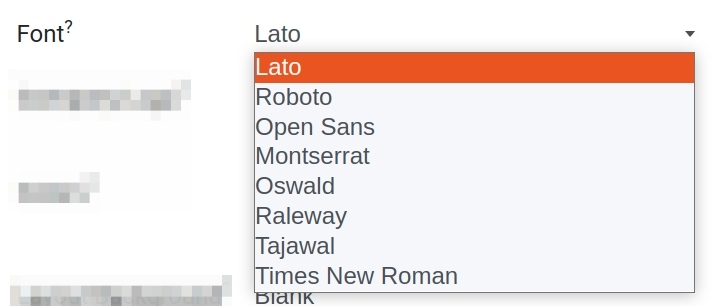
Font: The software comes with 8 available fonts.
Company logo: Click the Edit button to upload or change the logo. This adds the logo to the company’s record on the Company model, which you can access by going to Settings and then clicking Update Info in the Companies section.
Colors: Change the primary and secondary colors used to structure reports. The default colors are automatically generated based on the colors of the logo.
Layout background: The following backgrounds are available:
Blank: nothing is displayed.
Geometric: an image featuring geometric shapes is displayed in the background.
Custom: upload a custom background image.
Company tagline: This is displayed in the header. You can add multiple lines of text.
Footer: This text is used in the footer of external reports. You can add multiple lines of text.
Paper format: Define the default paper size of reports. The software provides 5 available formats.
Customizing PDF reports
In addition to using the available report templates, you can customize the default report templates as follows. Using the sales order as an example, perform the following steps.
On the sales order interface, select the gear icon.
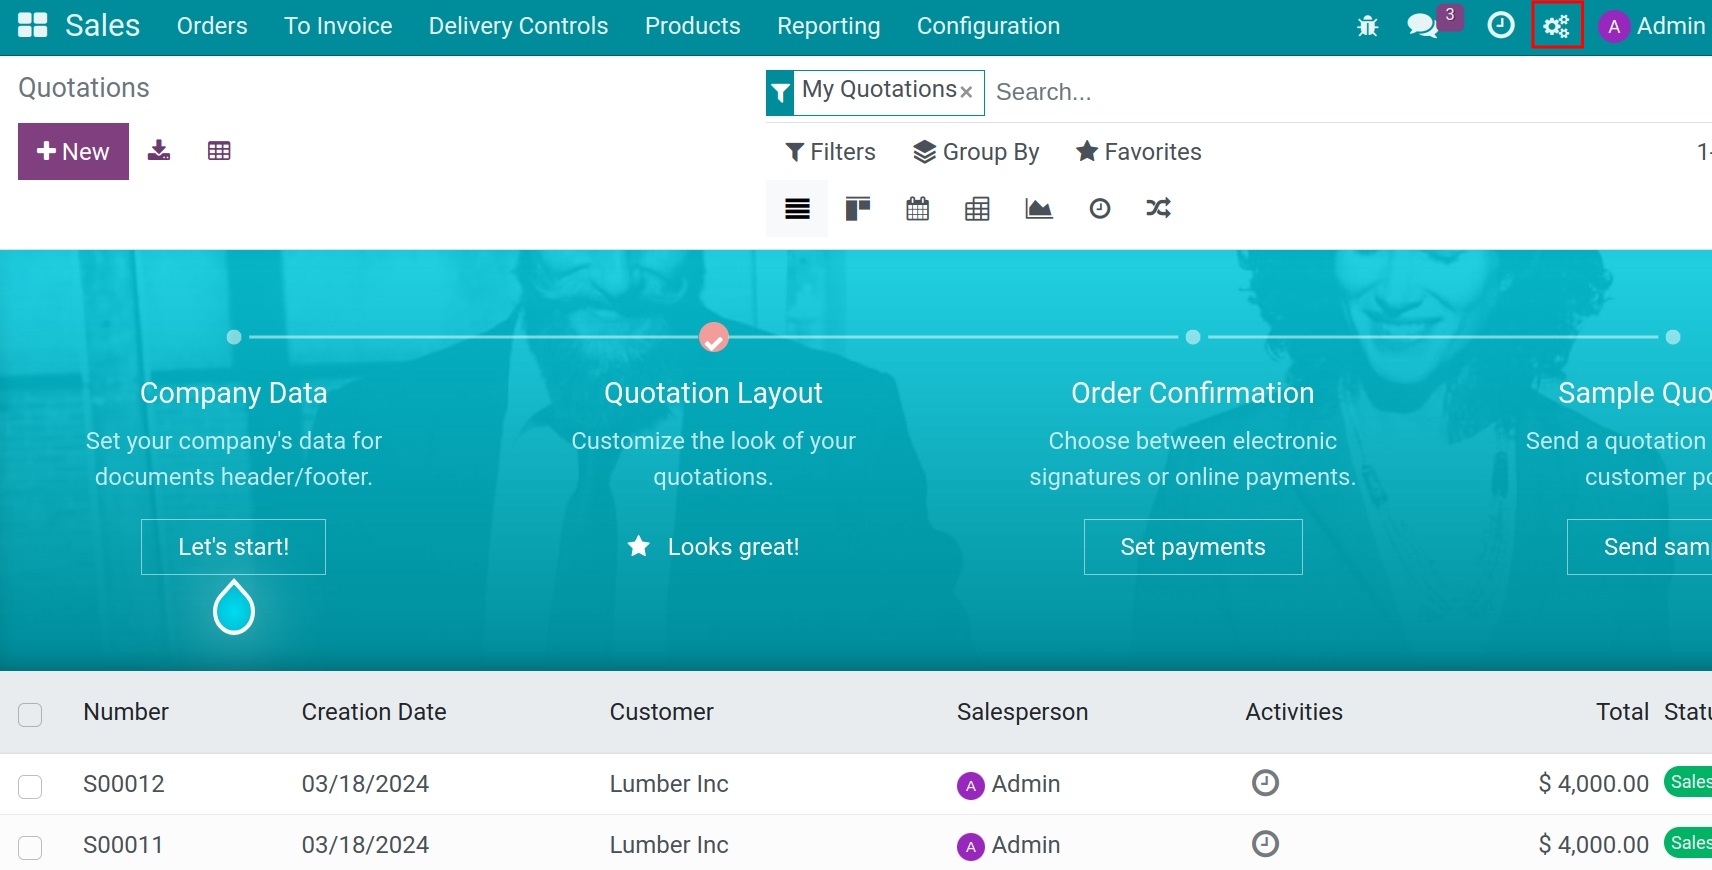
The application switches to the editing interface, then select Reports.

Choose the Reports that need to adjust. The system will navigate to the form of the chosen reports, go to the Add tab to add or edit elements. The elements are organized into three categories: Block, Inline and Data table.
Block:
Row: Add more row to the report. This row will consist of 12 grids and fit the width of the report. Row is a tool that helps you organize and align elements and data fields in the user interface, creating a neat, easy-to-understand, and user-friendly layout.
Column: Add more column to the report. This column can not stand alone, it have to be next the exist column of report.
Field: Add the value of the exist field to the report. This value could be dynamic base on each records.
Block Text: Add the block text to the report. Block Text is a component used to display text as a separate block, not directly linked to data fields. This type of field is used to present static text or descriptions that do not require the user to input any data.
Image: Add the image to the report.
Inline:
Inline Text: Inline text is text that is inserted directly into a part of content or data fields without creating a clear separation or paragraph break. It is displayed within the same line or area as other elements, rather than being placed in a separate section
Inline Field: Inline Field is a data field that is inserted directly into a part of the content without creating a clear separation, similar to inline text, but it contains values or data from existing fields in the system or report.
Data table:
Dynamic Table: This feature allows users to create a table whose content can be changed or updated automatically based on the value of each chosen fields.
Table Column: Allow users to insert more columns to the exsiting table.
Add more Row
To add a new row into the report, press into the Row, drag and drop at the desired position.
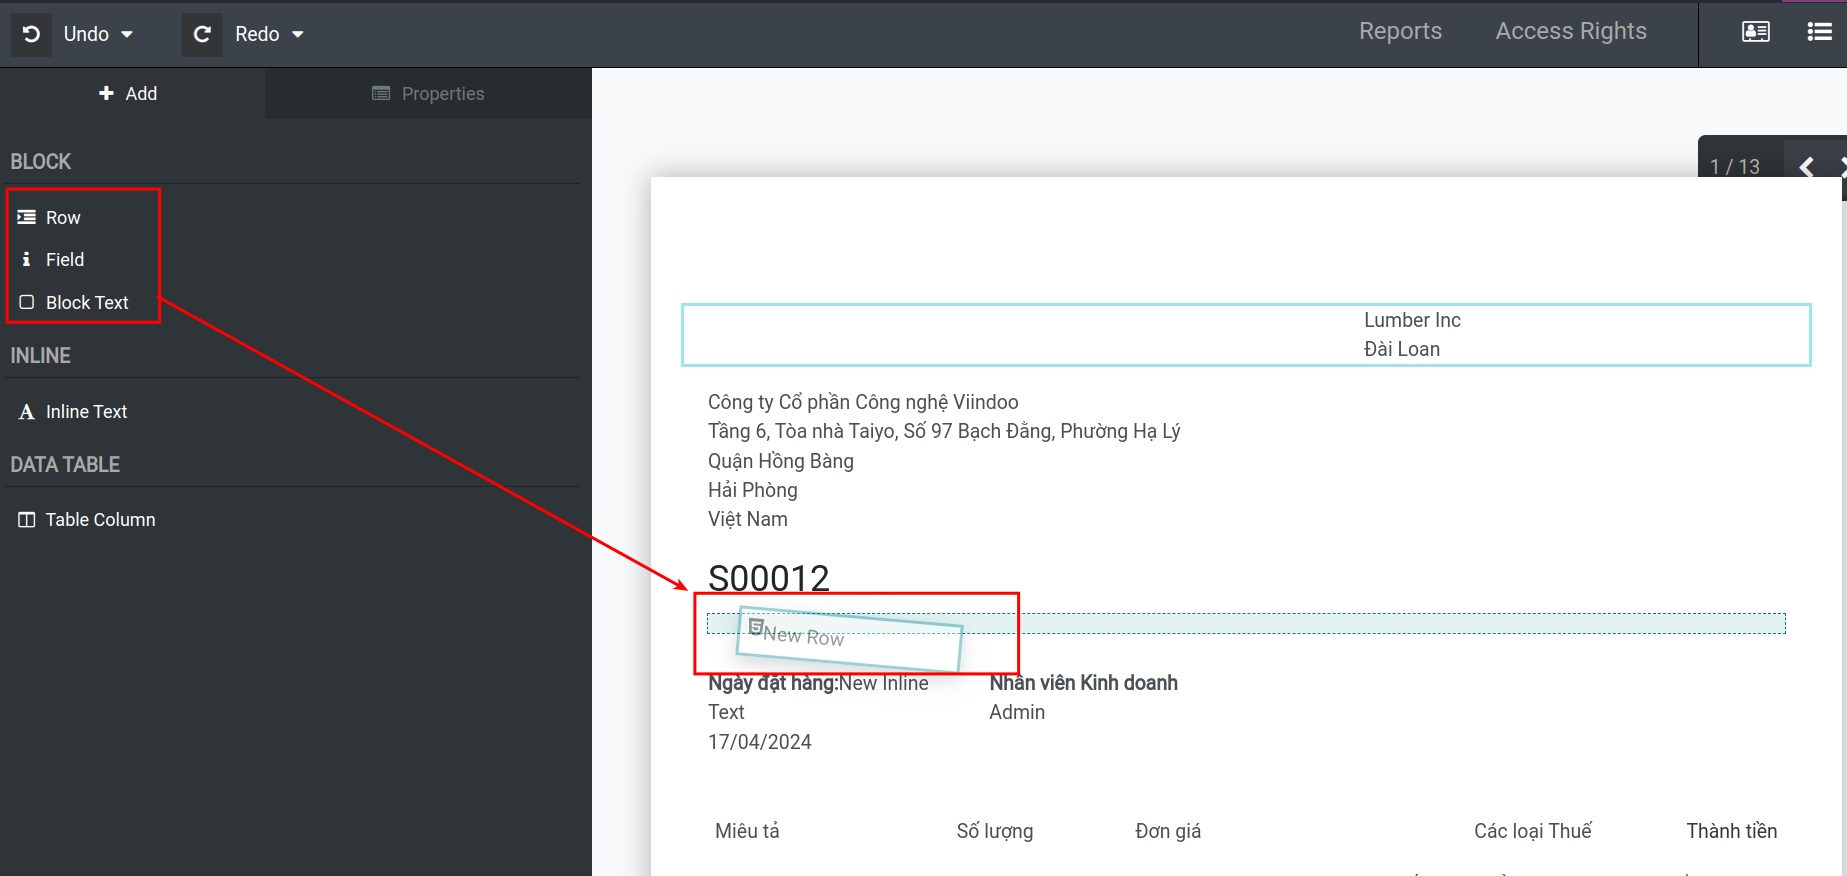
You can choose how many columns you want to separate the row:
One column: One row, one column.
Two columns: One row, two columns.
Three coumns: One row, three columns.
Manual: One row, the number of columns is the number input.

Based on the number of columns you chose, the width of the column will be evenly distributed. But you can adjust the width of the columns by pressing to the needed column and change the size of the column.
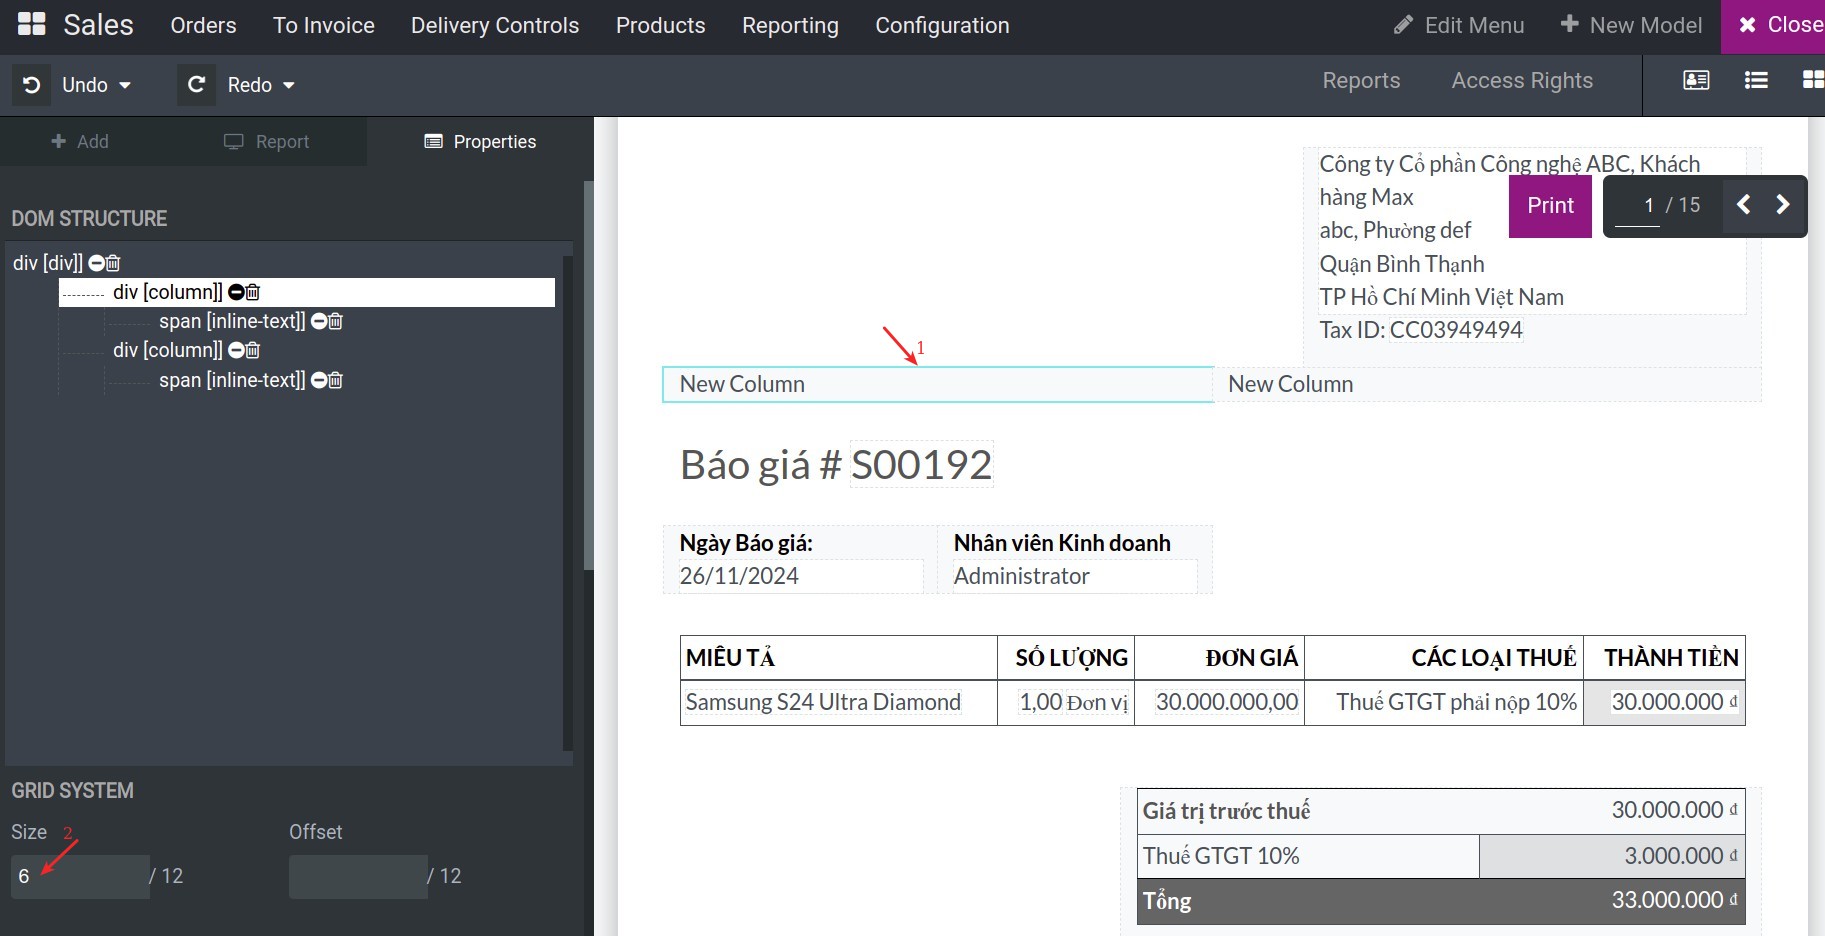
Note
You also put the number of grid you want to remove on the Offset field. If you use Offset feature, you need to change the size of the column, make sure the total of grid of the row is 12.
Add more Column
The process of adding more columns to the report is the same as adding rows to the report. To add a new column to the report, click on the Column, then drag and drop it to the desired position. The newly inserted column will fill the width of the row it is placed in.
Add more Field
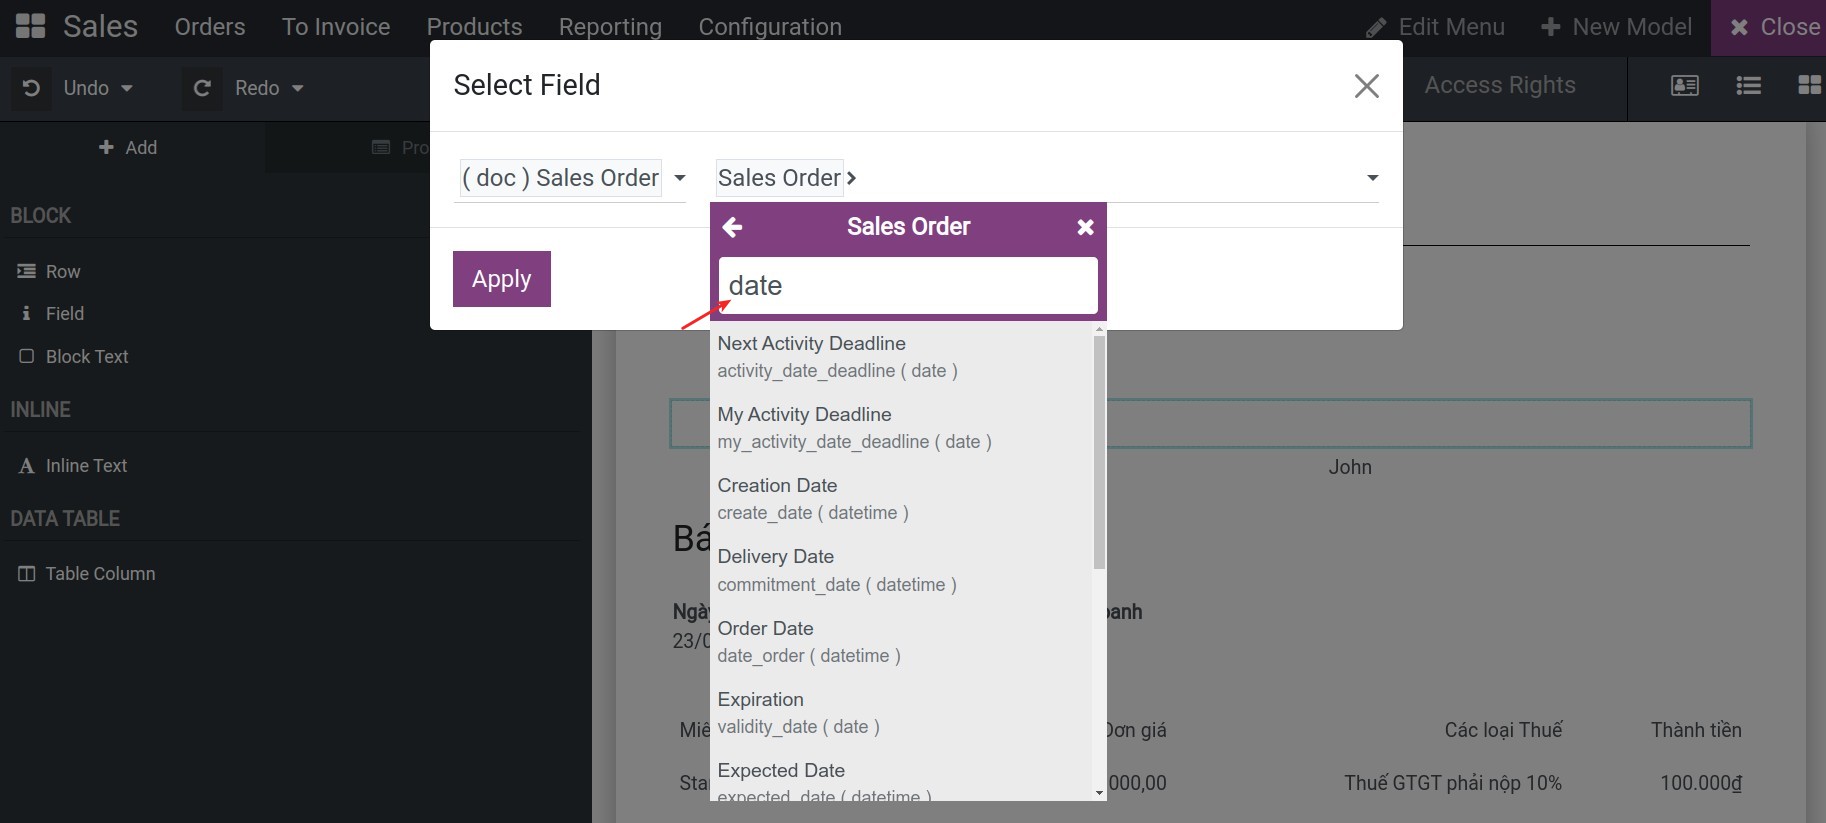
To add the value of an existing field on the report, you press into the Field, drag and drop at the desired position. Noted that, the value in this field will be dynamically displayed on the report based on the inputted data in the form view.

Then, you can select the value for this field.
Add more Block Text
To add the block text on the report, you press into the Block Text, drag and drop at the desired position.

You also can modify the display of these texts or change their contents.
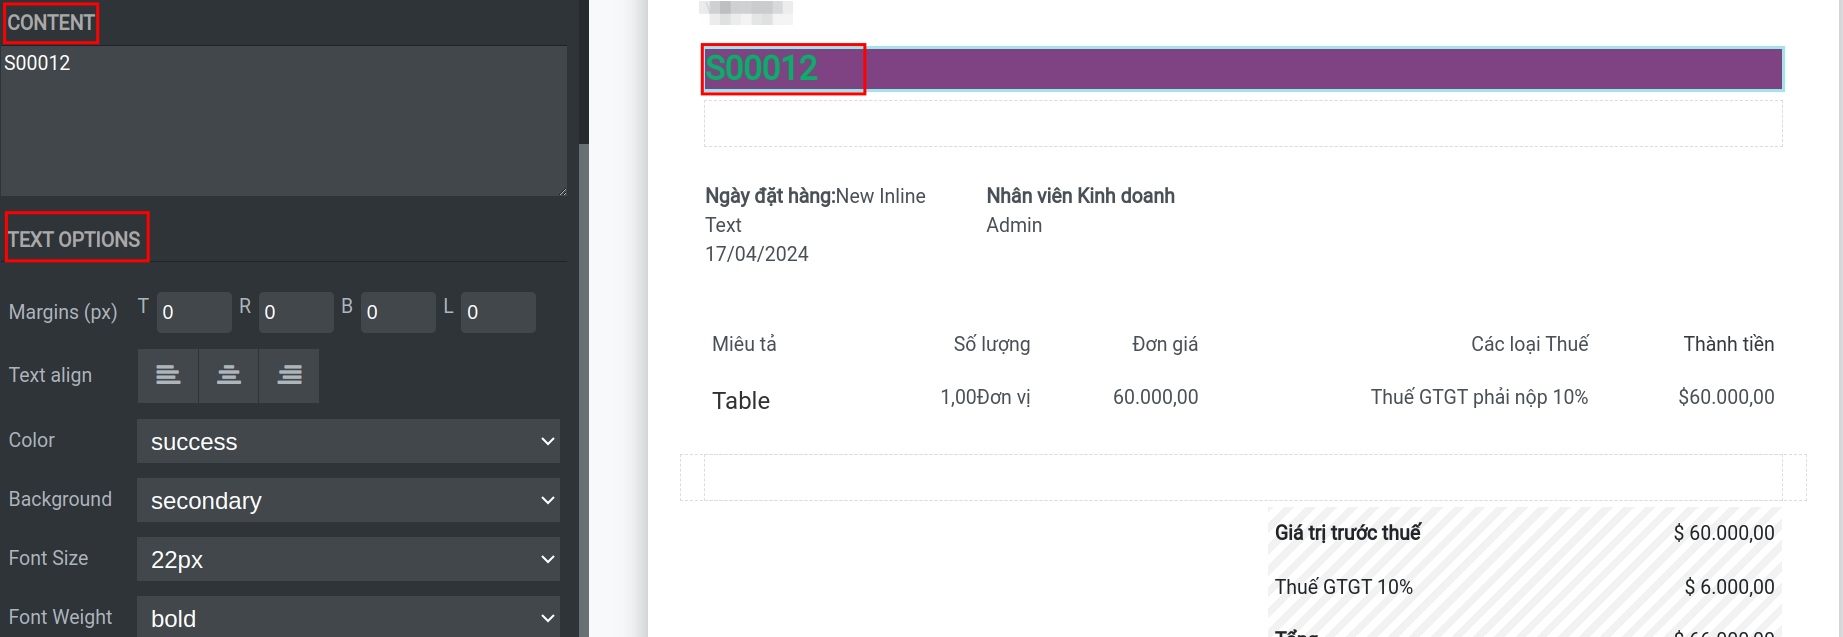
Margins: add spacing at the top, right, bottom, and left of the element.
Text align: align the element to the left, center, or right of the report.
Colors: change the font’s color.
Background: change the background color.
Font style: use one of the default font styles.
Font Weight: bold, italicize, and underline the font.
Add more Image
To add a new image to the report, click on the Image, then drag and drop it to the desired position. You can upload and choose the desired image.
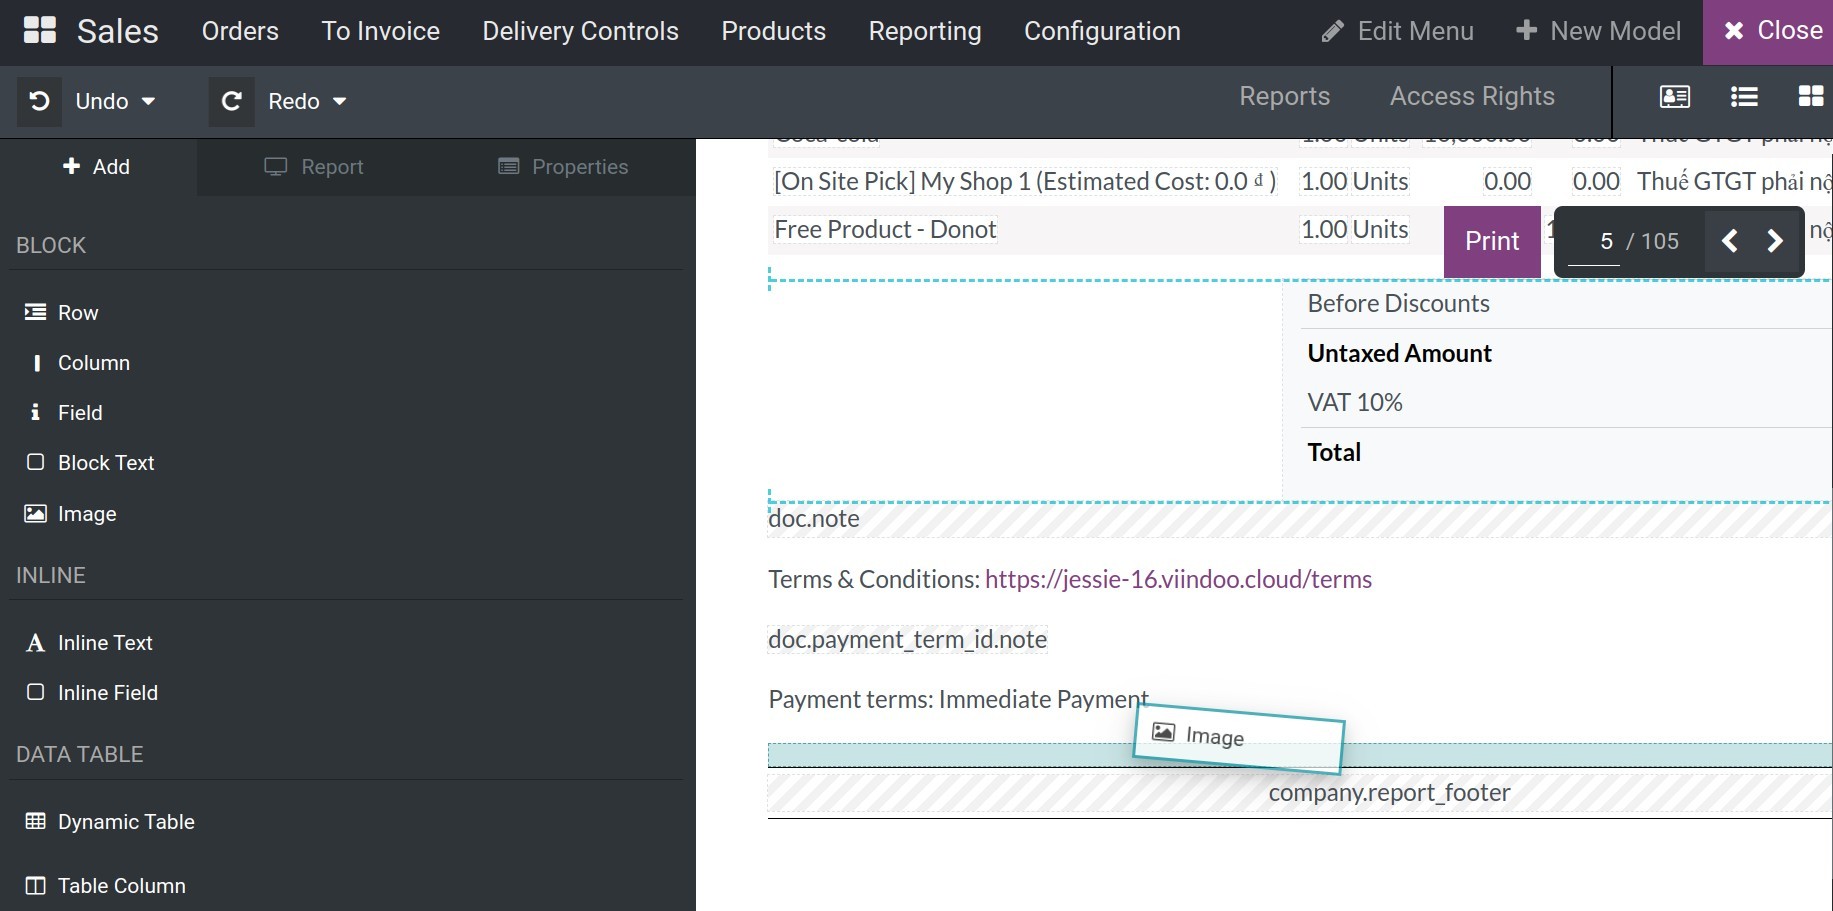
Note
This image will be the static data on the report.
If you want the image is dynamic for each record, you need to add more binary field on the user interface and then drag - drop this field to the report.
Add more Image
To add a new image to the report, click on the Image, then drag and drop it to the desired position. You can upload and choose the desired image.

Note
This image will be the static data on the report.
If you want the image is dynamic for each record, you need to add more binary field on the user interface and then drag - drop this field to the report.
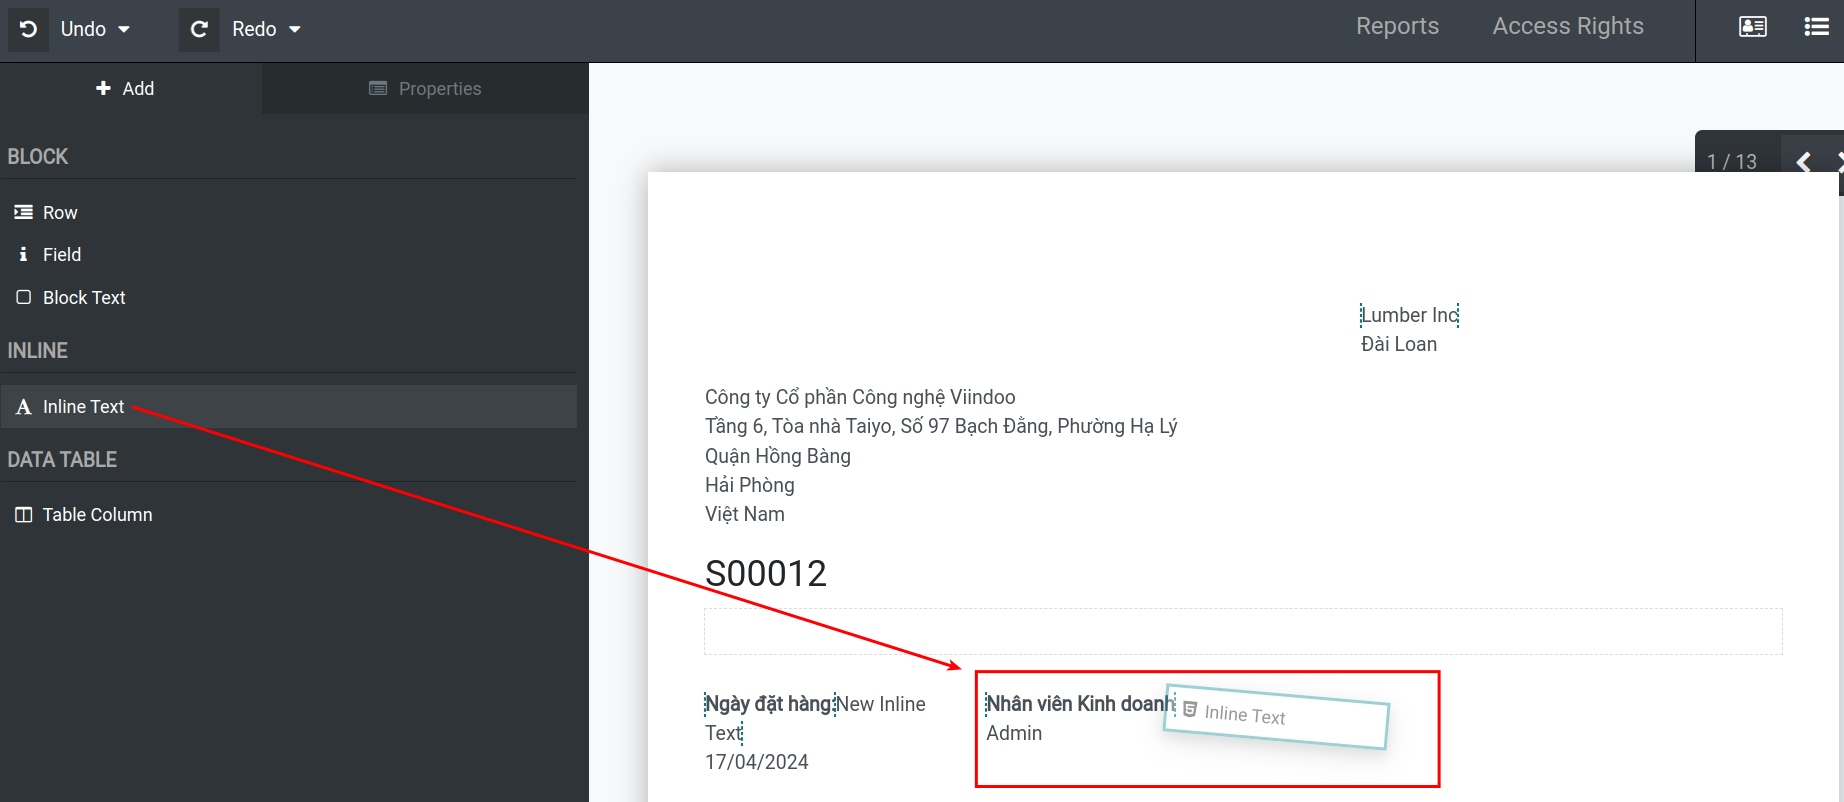
Add more Inline Text
Inline elements are used around other elements. They do not start on a new line and the width adapts to length of the content.
Add more Inline Field
To add a inline field to the report, click on the Inline Field, then drag and drop it to the desired position.
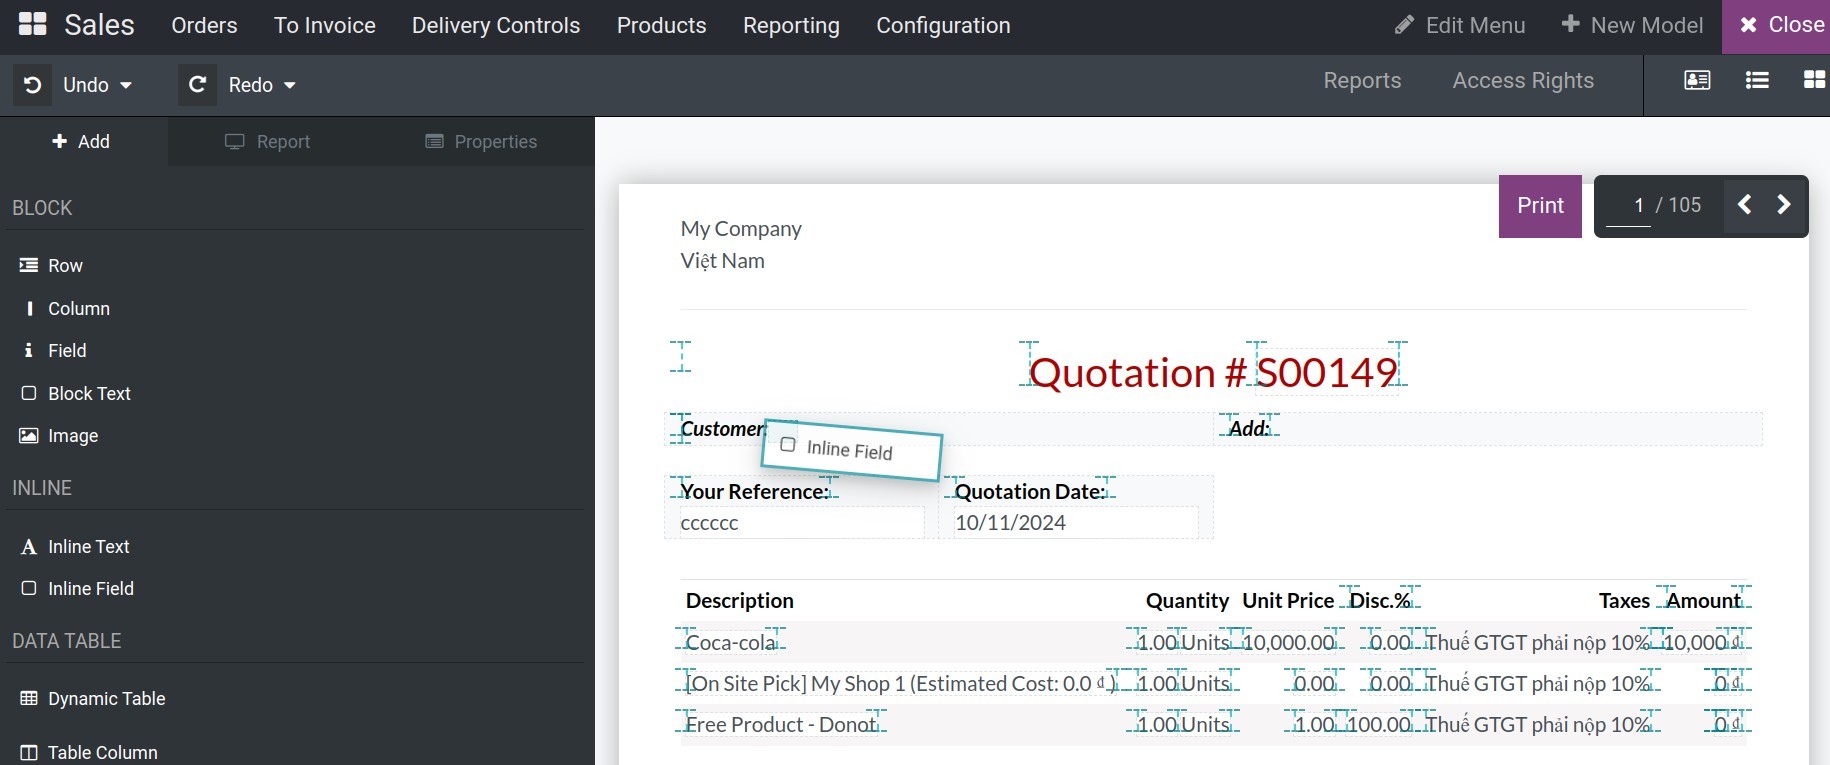
After landed the inline field, you need to choose the related field, and then press ENTER to finish.
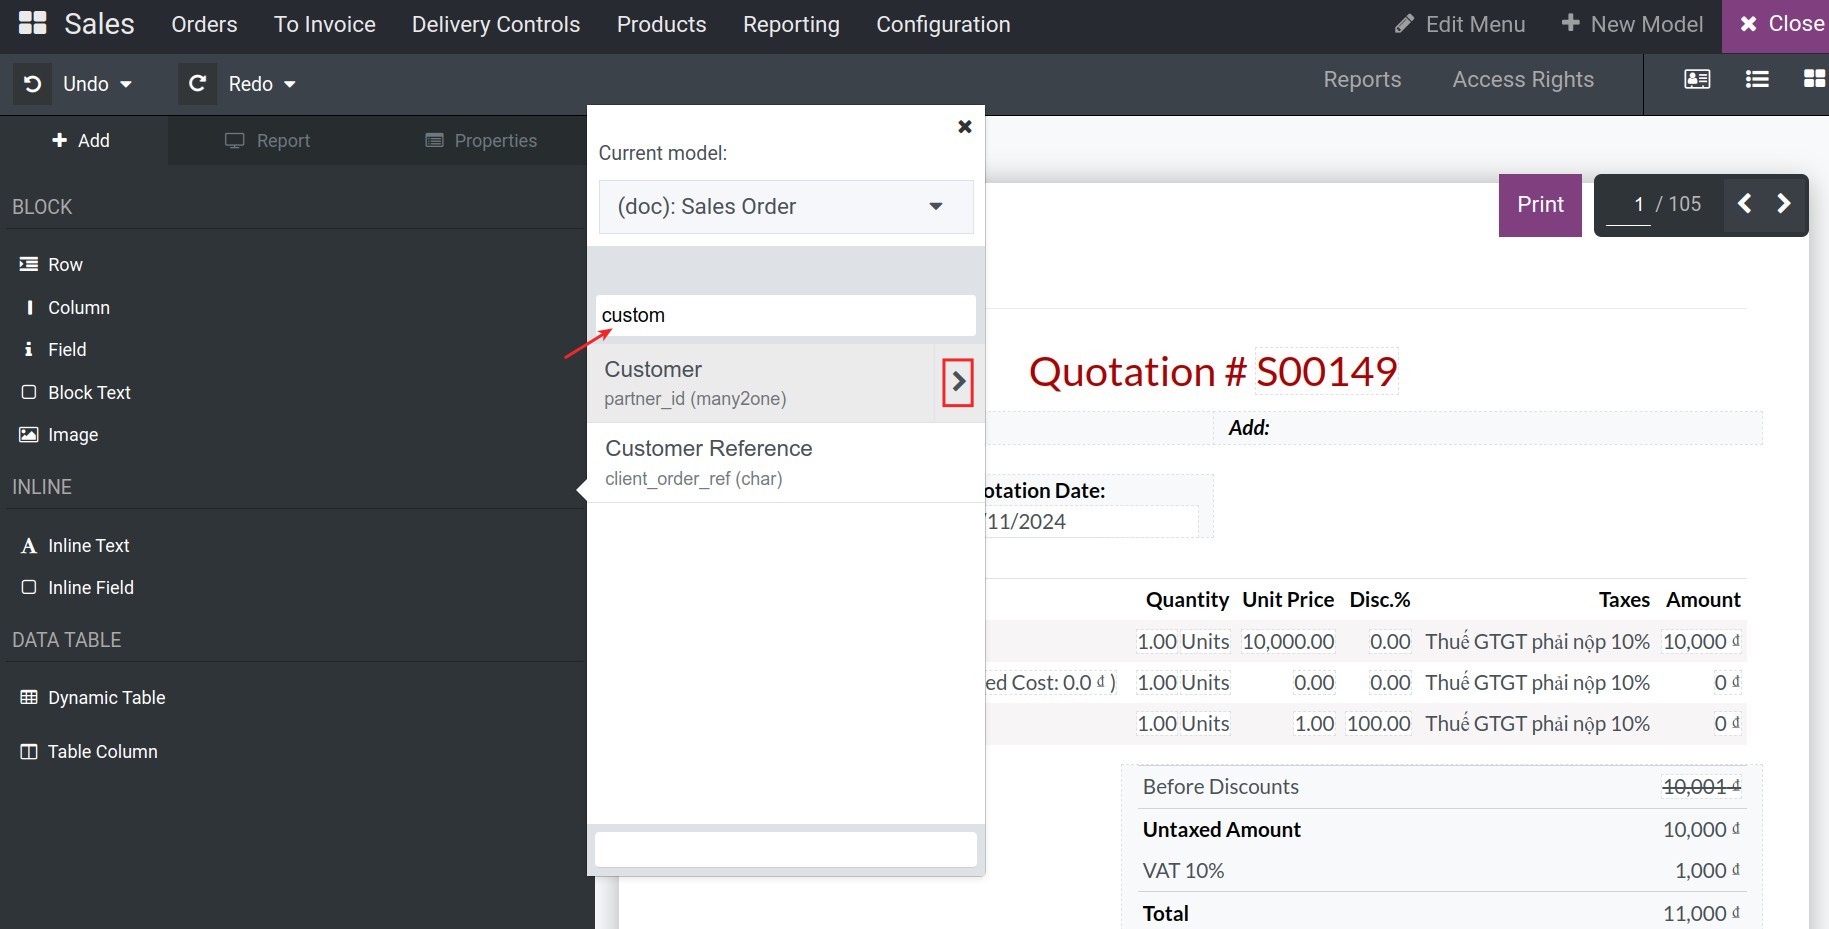
Add Dynamic Table
To add a table to the report, click on the Dynamic Table, then drag and drop it to the desired position.
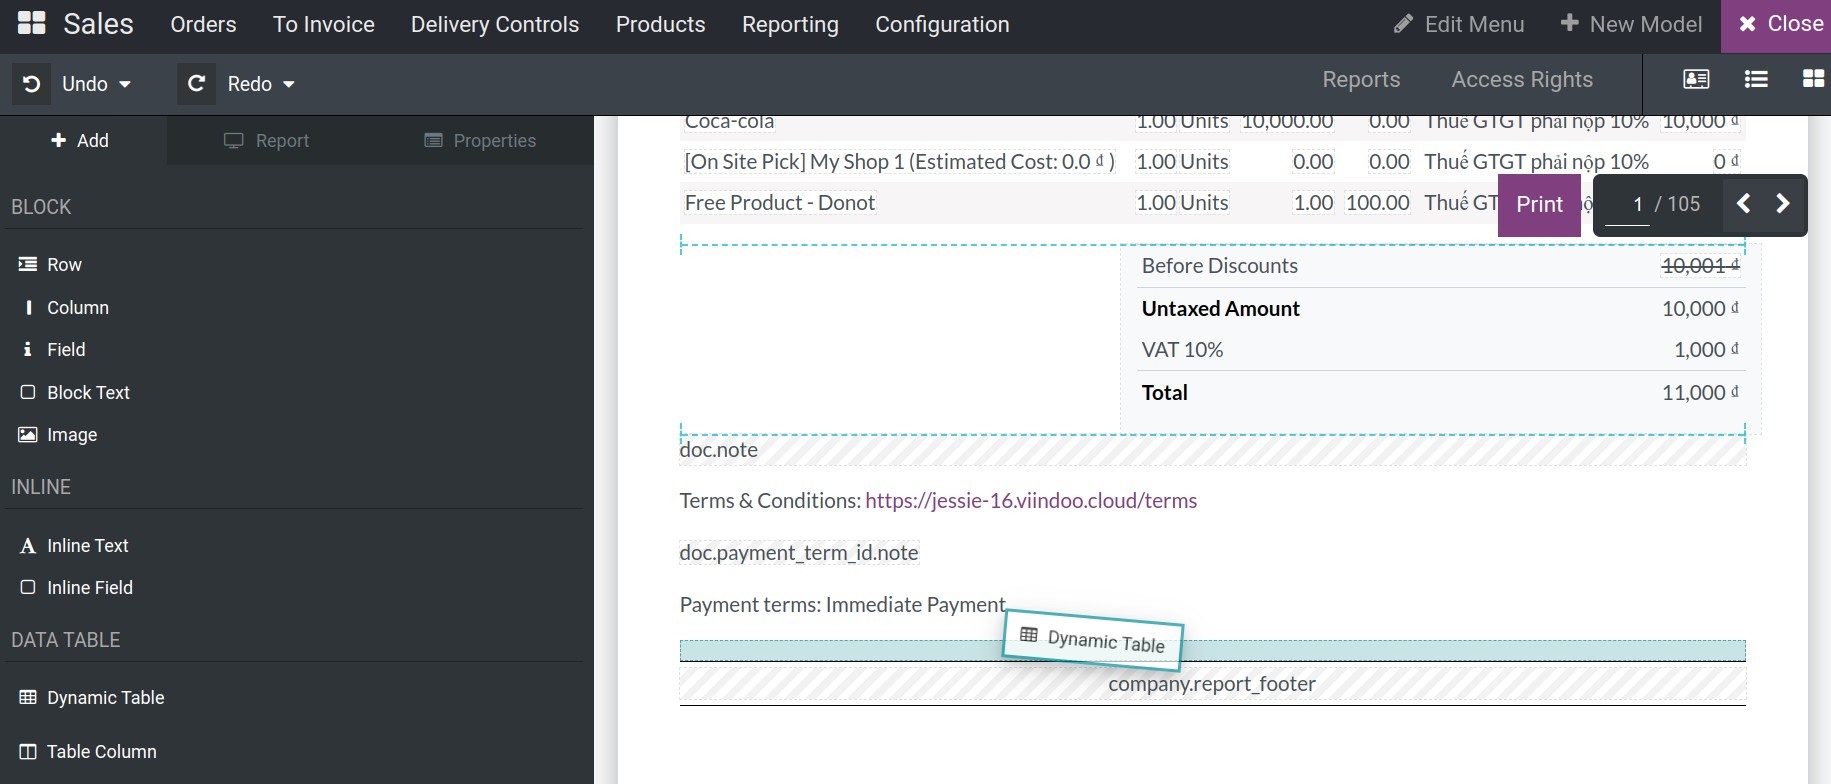
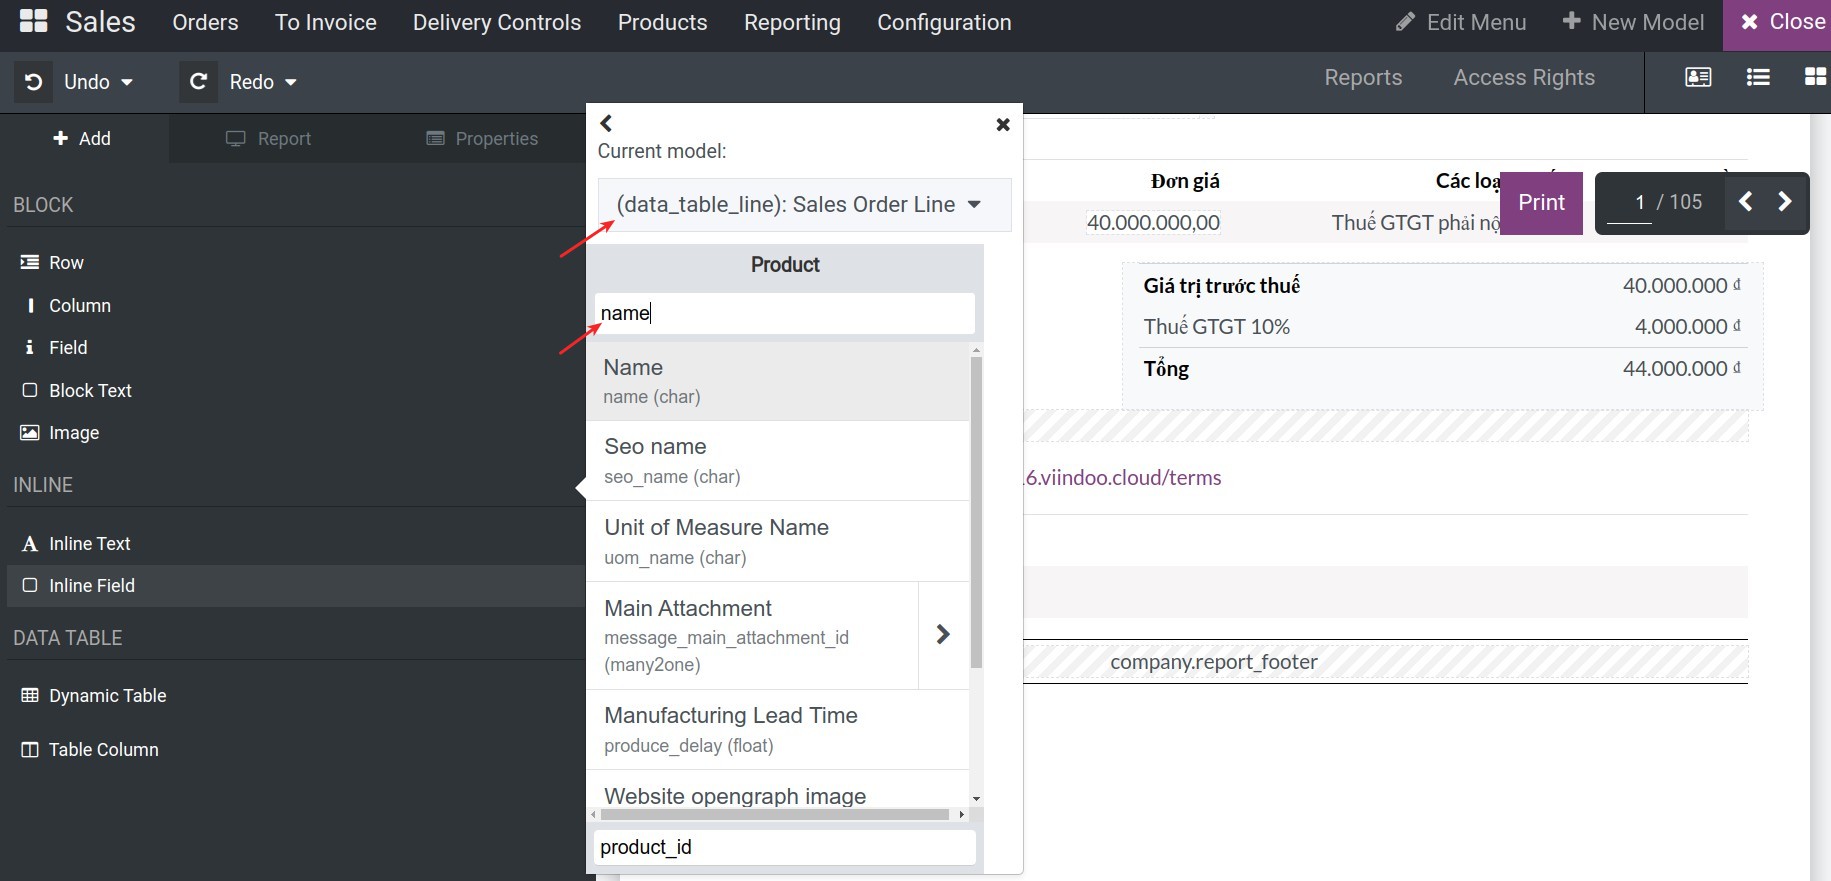
After landed at the desired position, you can choose the model and the first appropriate field, then press ENTER (or input some default text and then press ENTER).
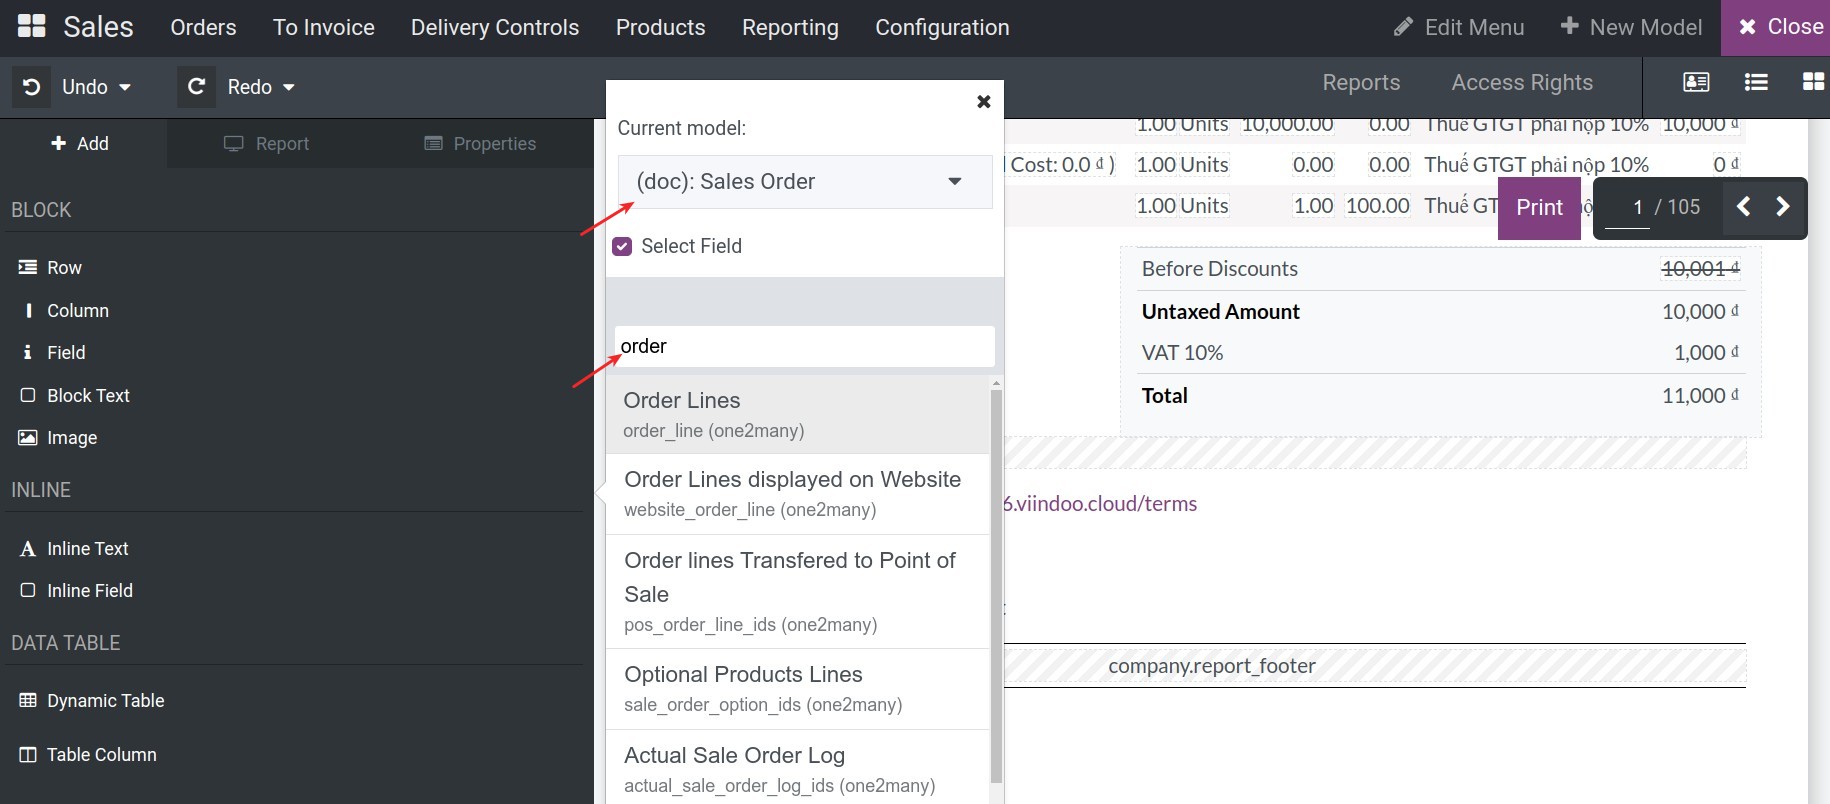
This process will create the first column of the table. Then, you can add more column to the table as follow.
Add more Table Column
To add a column to an existing table, press into Table Column, drag and drop into the disired position.
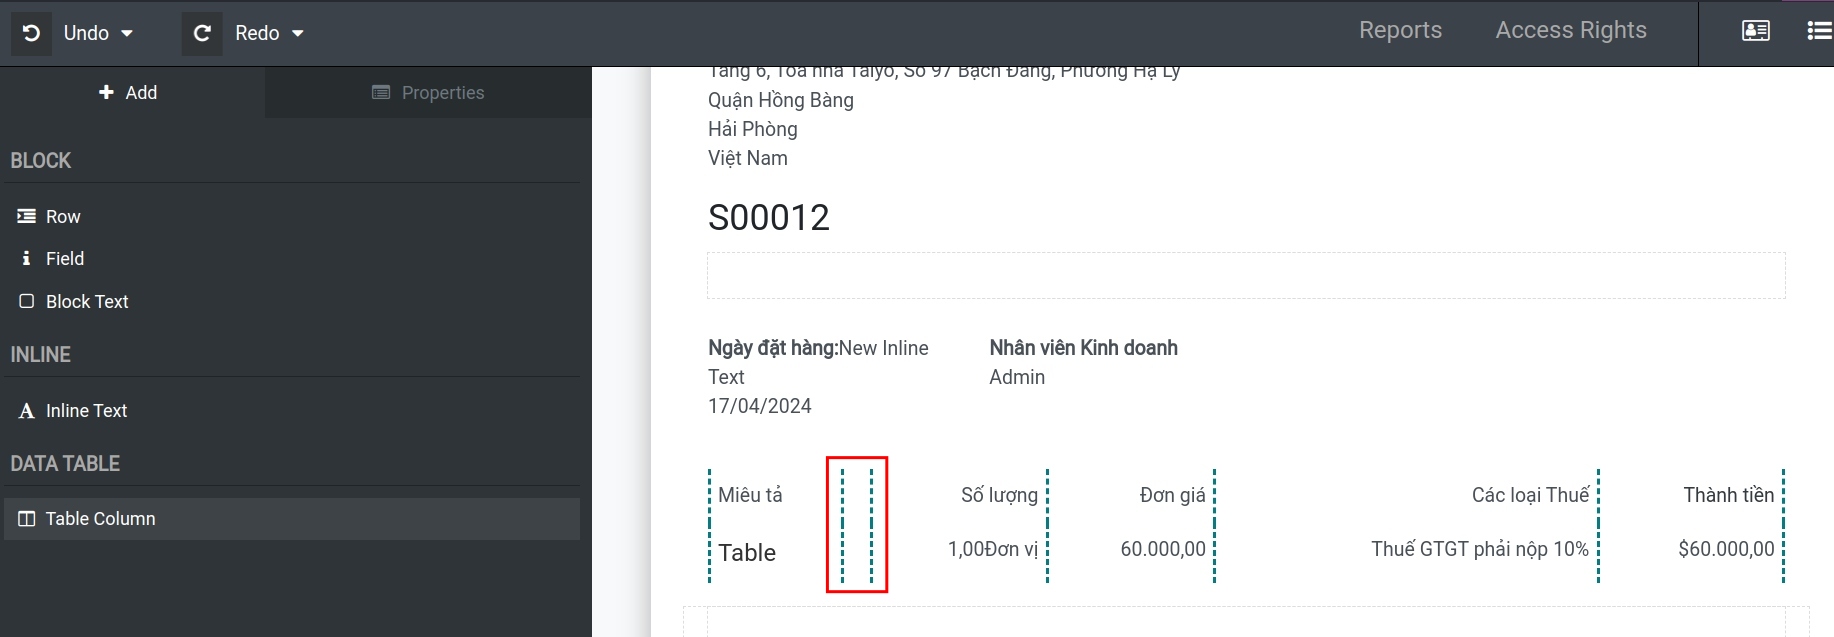
After landed at the desired position, you can choose the model and the appropriate field, then press ENTER (or input some default text and then press ENTER).
Once completed, the system will automatically save the modified information. You can then Close the window to proceed. At this point, you can use the new report template.
Delete the elements
To delete the elements on the report, you press into the specific element need to delete, go to the left slidebar, press to the delete icon.

Note
You can choose Redo to discard the changes. Select Undo to revert to the most recent action before.

See also
Related Article
Optional Module
