Vehicles Management Reports
Vehicle management reports are important tools that help businesses track and assess the condition of vehicle usage, operating costs, maintenance, and fleet performance. Through indicators such as mileage, fuel costs, maintenance frequency, and usage time, this report helps management make informed decisions on route optimization, cost reduction, and improving work efficiency.
Requirements
This tutorial requires the installation of the following applications/modules:
Vehicles List Management Report
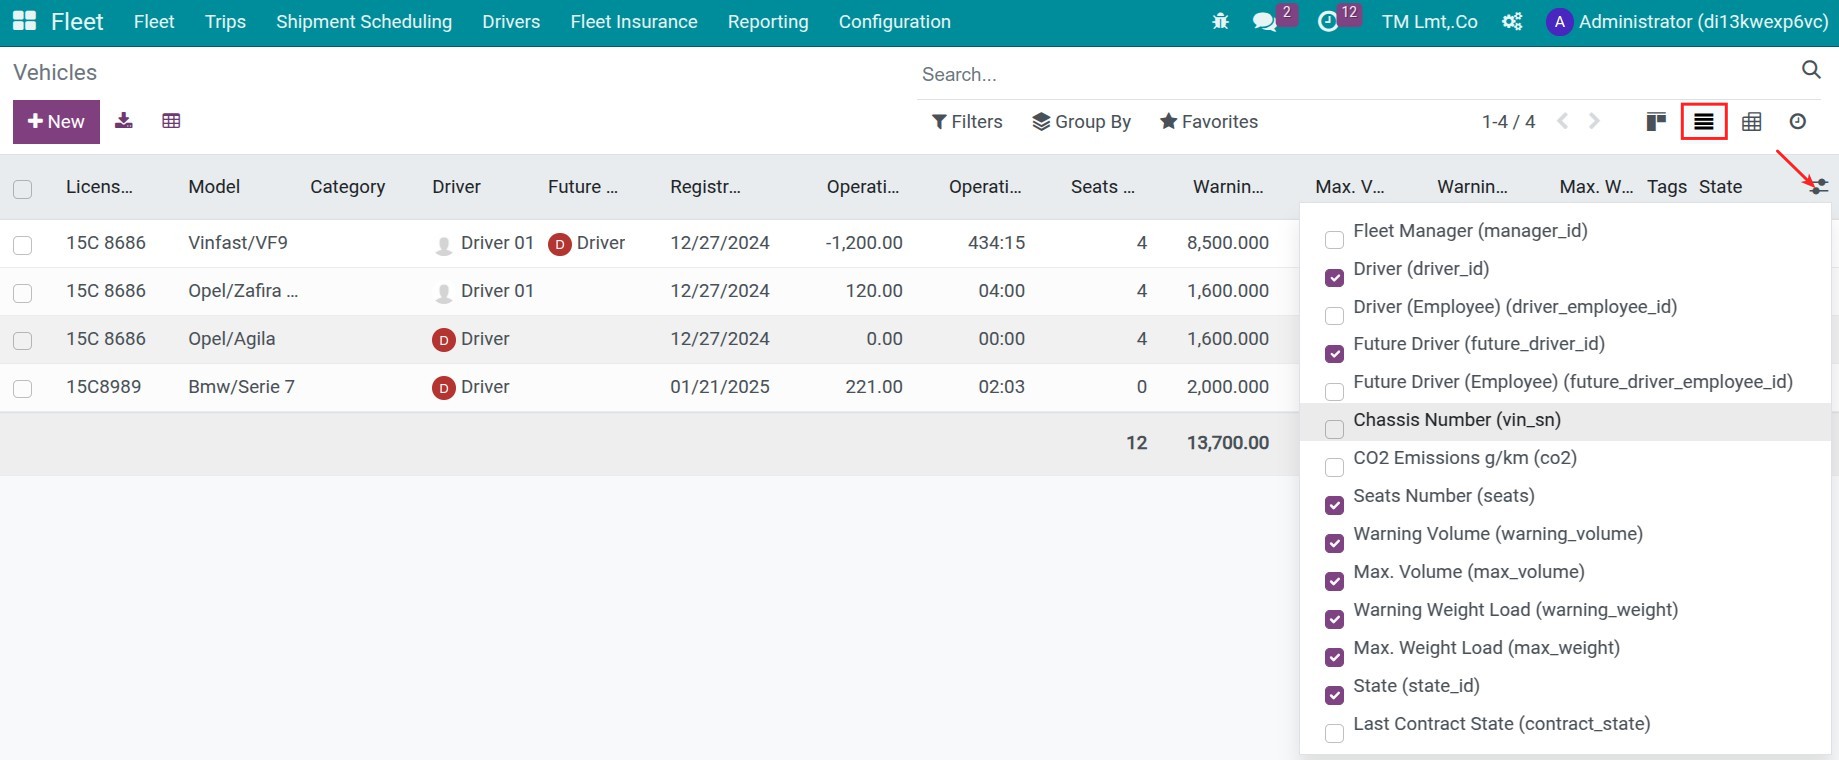
You can see the report of all vehicles’ information when navigating to Fleet > Fleet > Fleet, then move to List view or Piovt view to see.
List view: On the List view, you can see some default information. If you want some more, press to the expand icon and choose some information as your need.
Pivot view:
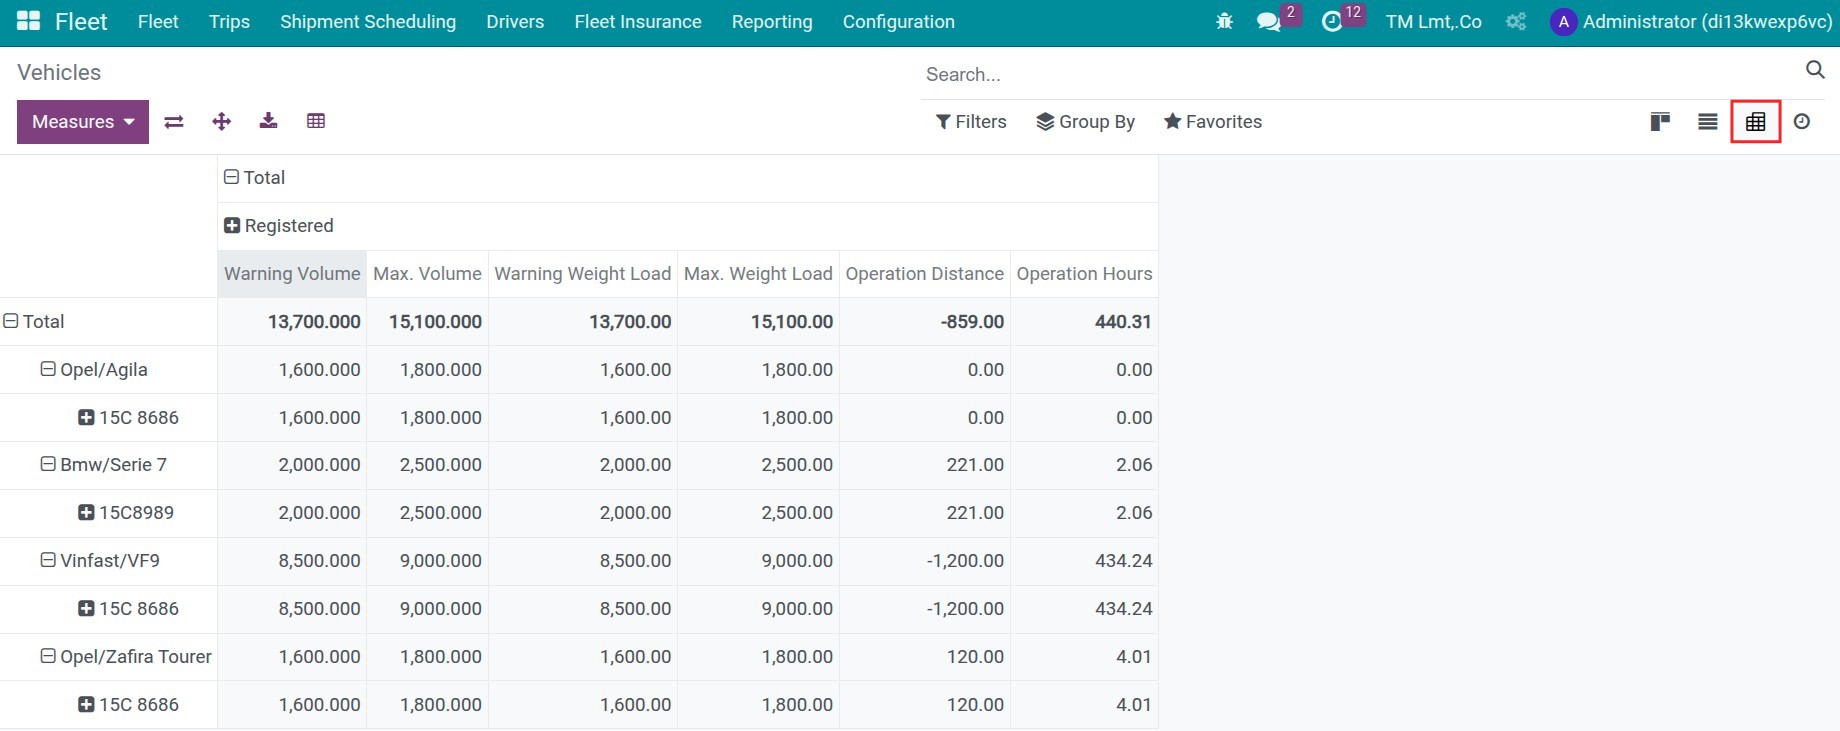
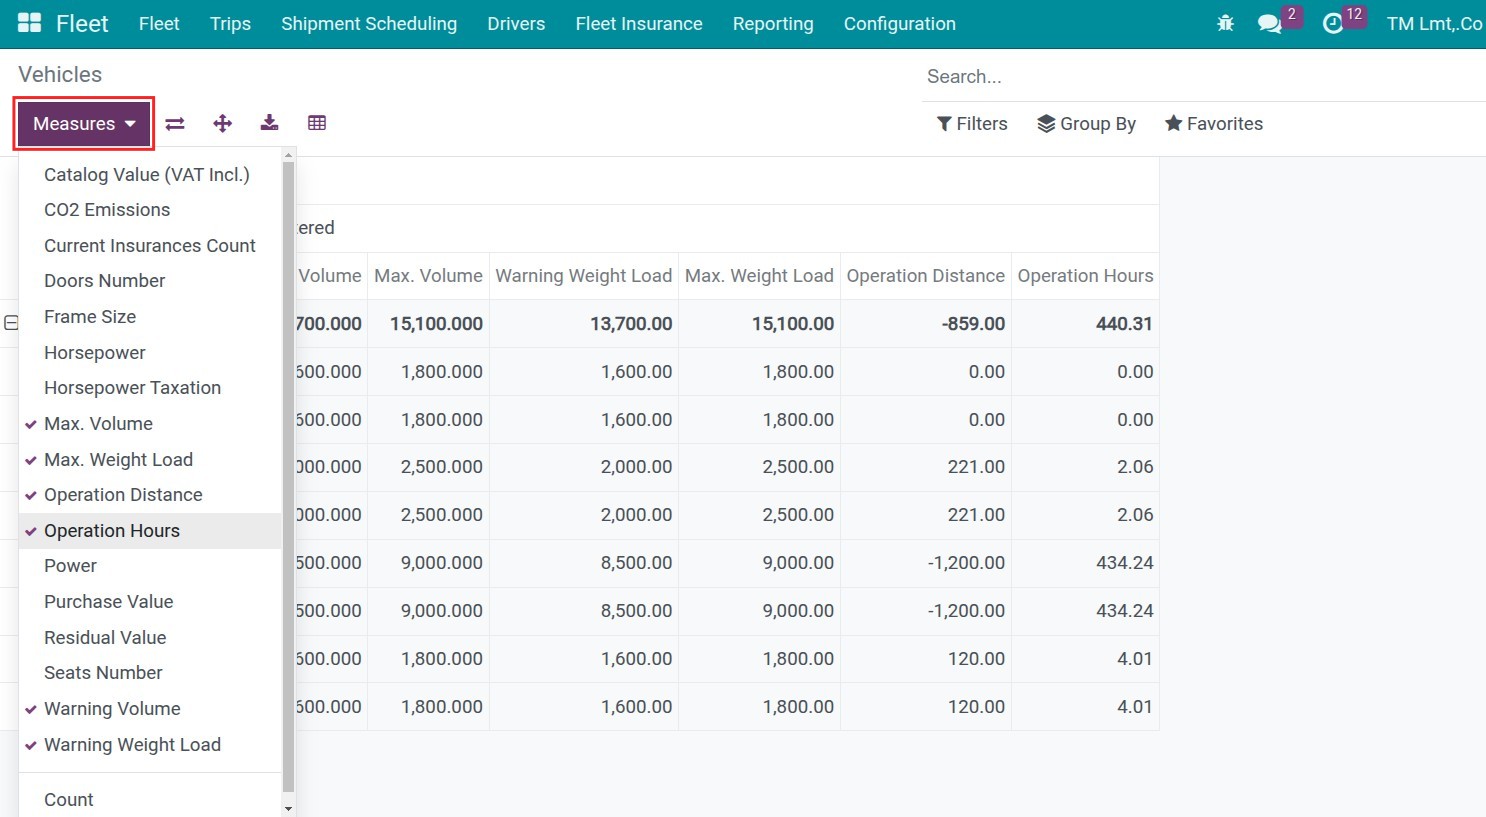
Choose the column value by pressing to Measures:
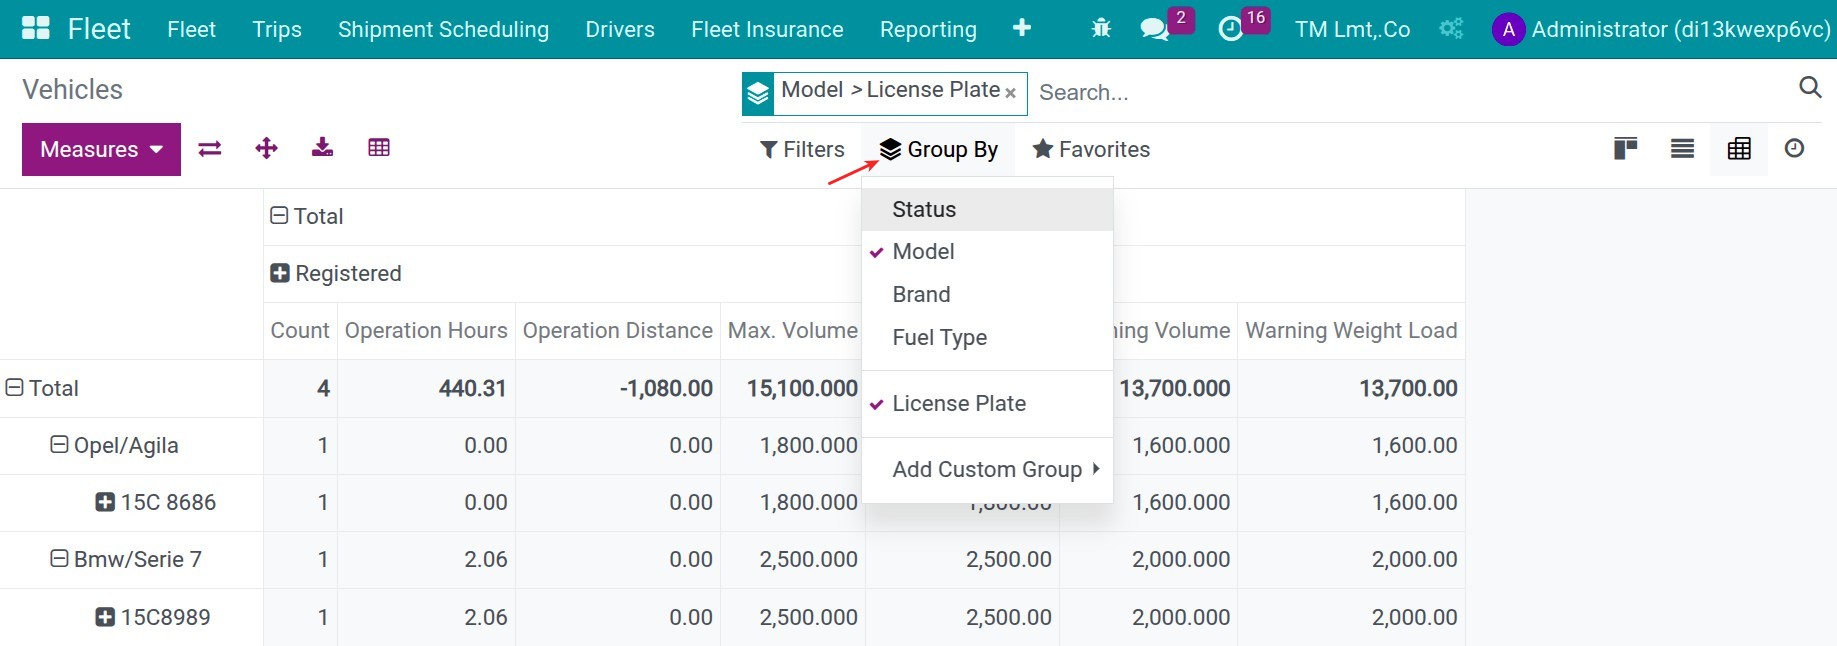
Choose the horizontal data by using Group By or Filters features:
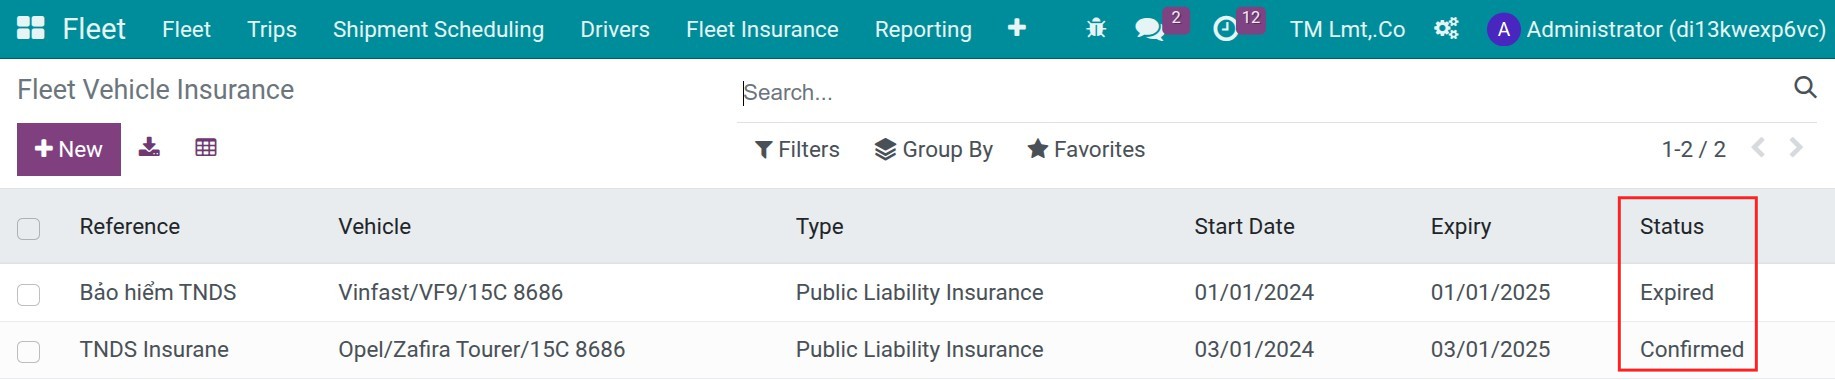
Manage the Vehicle Insurance Report
Navigate to Fleet > Fleet Insurance. Here you can see the status of vehicle’s insurances:
Trips Analysis Report
Navigate to Fleet > Reporting > Trips Analysis, choose the Pivot view:
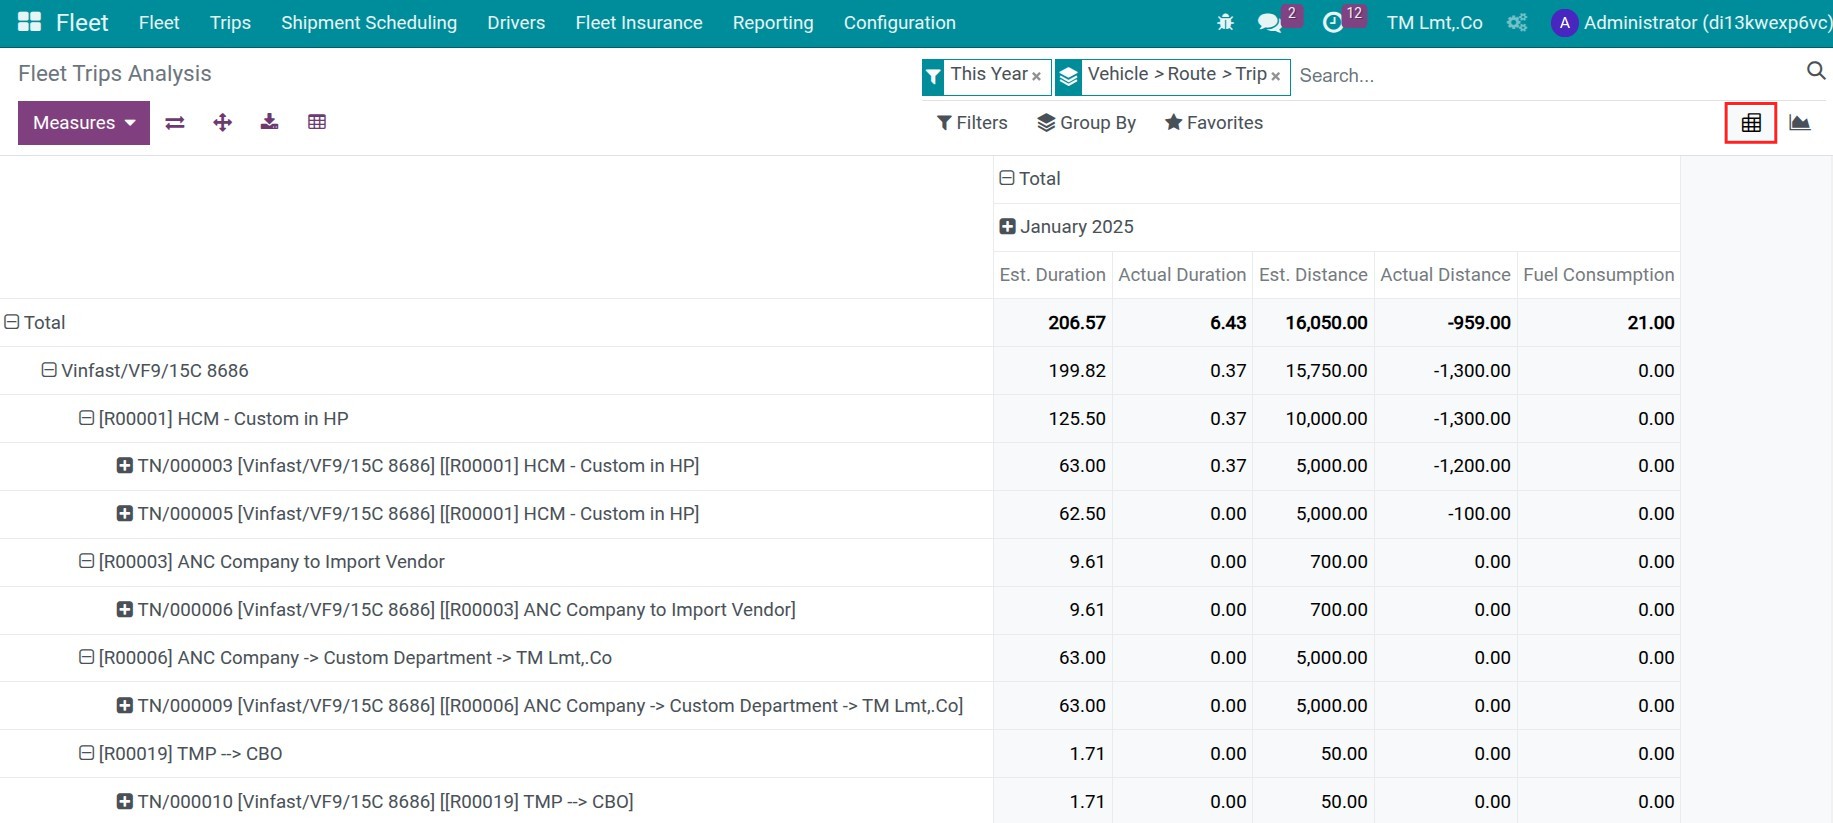
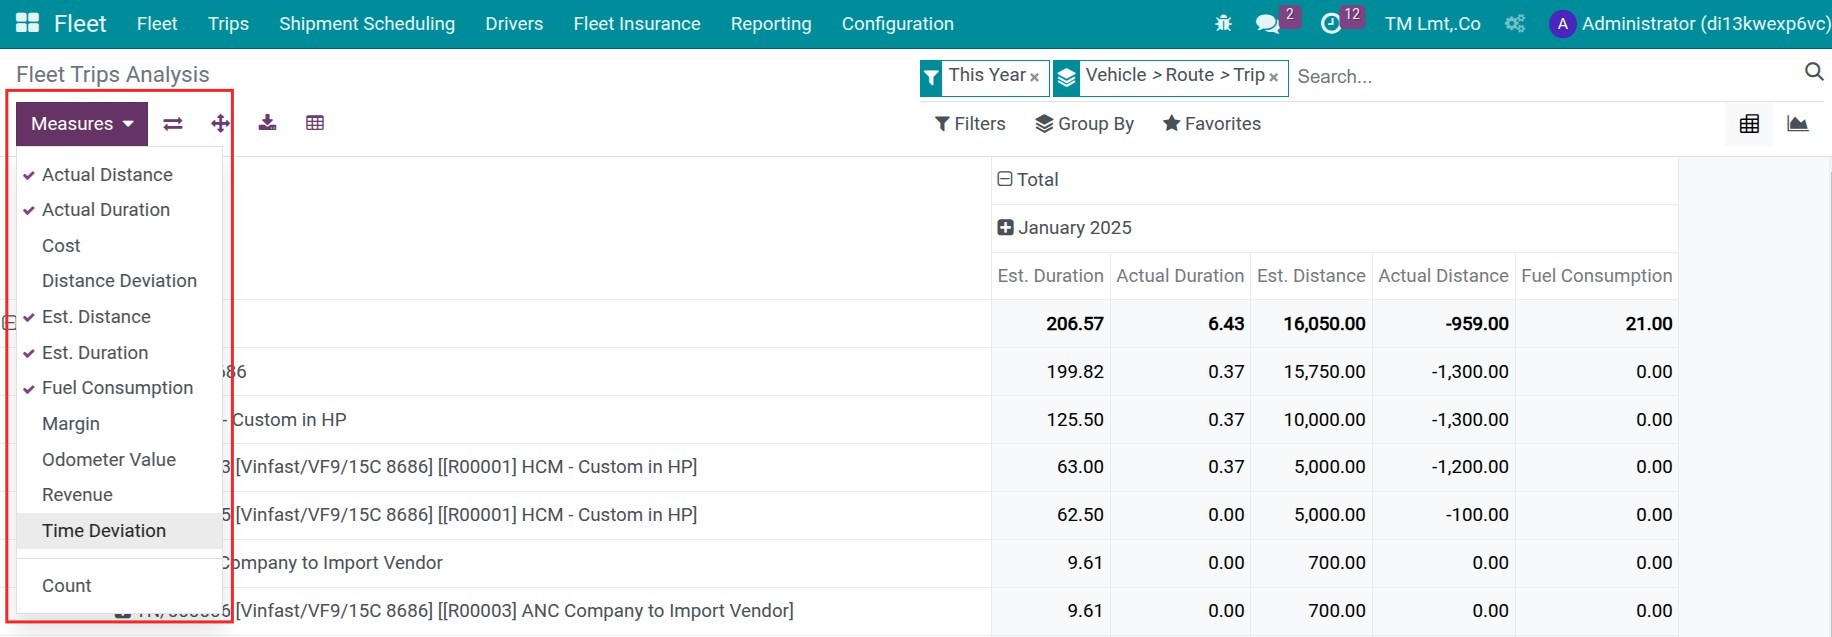
You can use some measures to see the vehicle using state as Est. Duration, Actual Duration, Est. Distance, Actual Distance, Fuel Consumption:
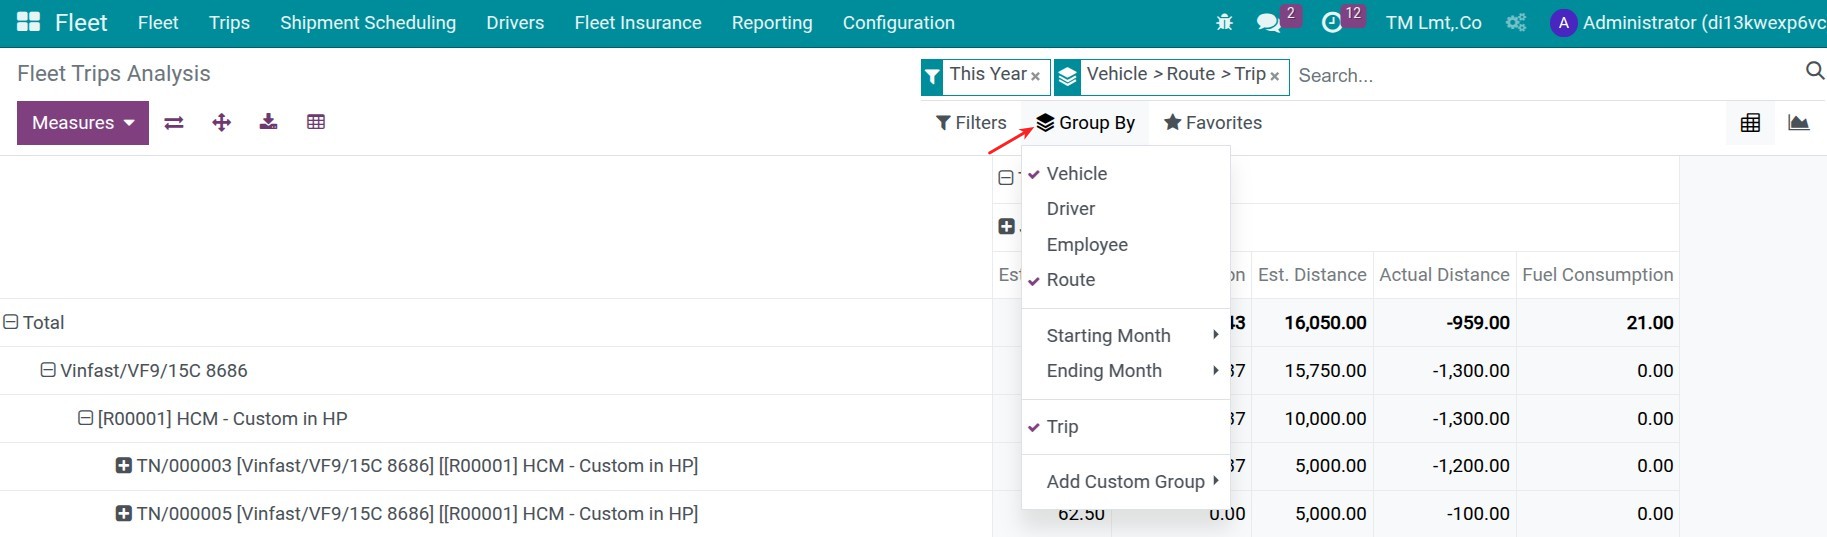
With the horizontal data, you can sequency group by Vehicle > Route > Trip:
Revenue and Costs Analysis Report
Vehicle Margin Analysis Reports
Navigate to Fleet > Reporting > Trips Analysis, choose the Pivot view:
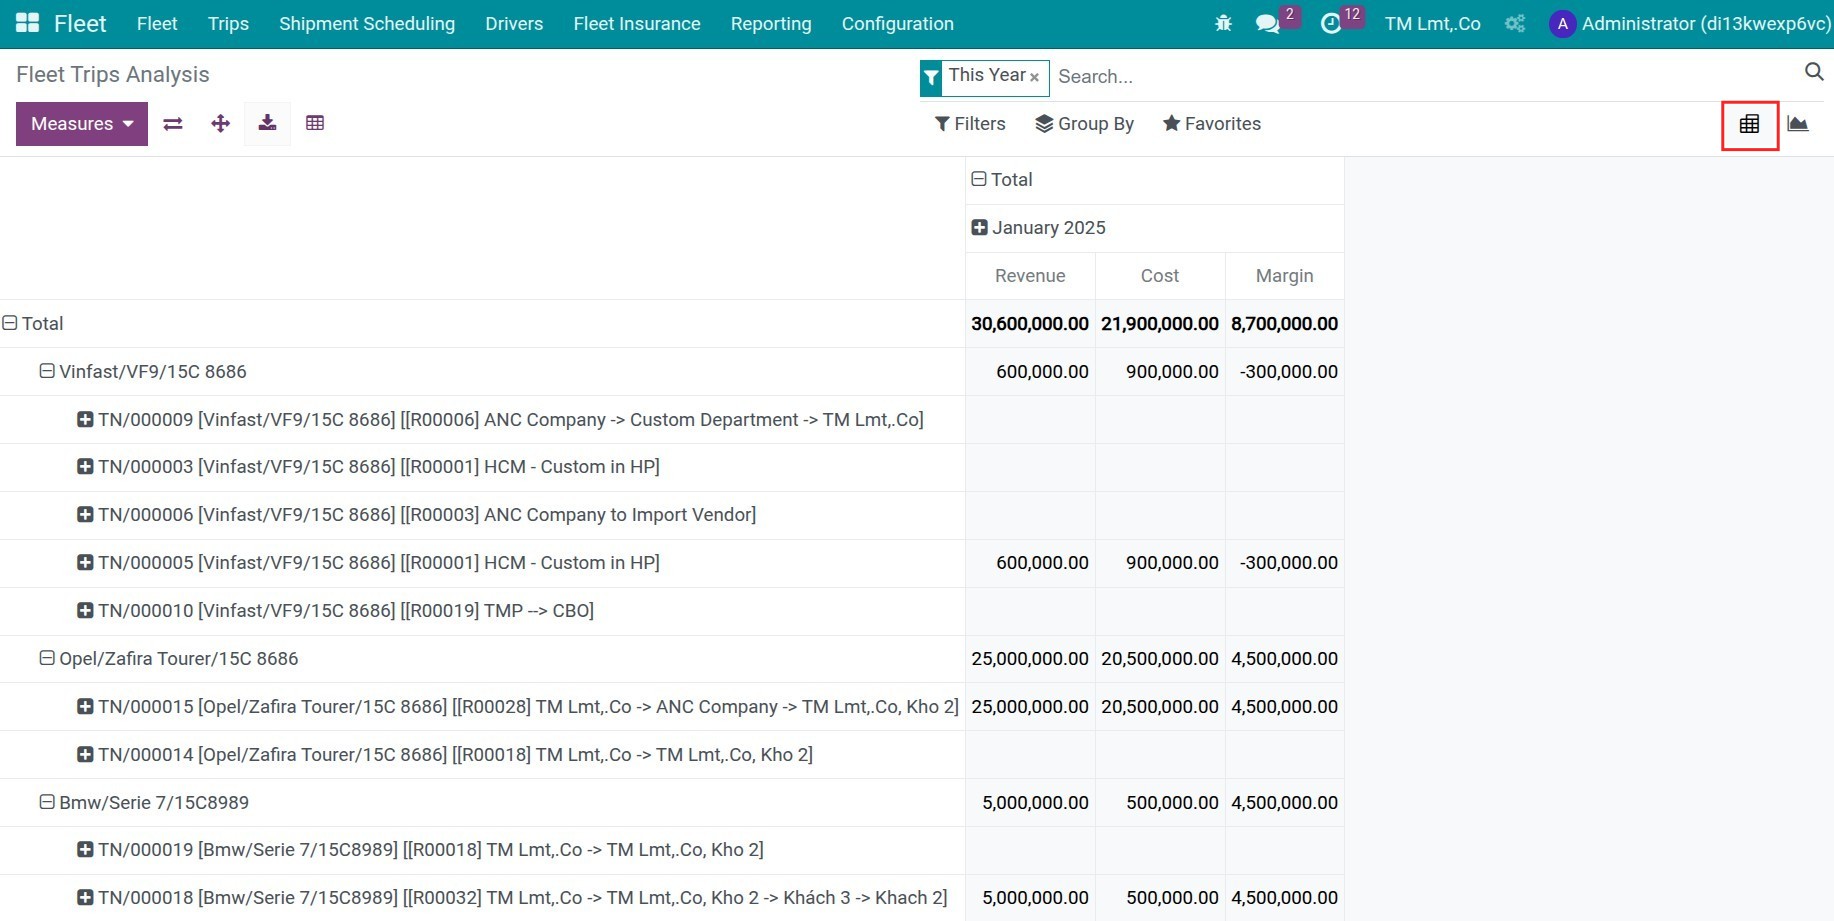
You can use some measures to see the vehicle’s revenues and cost operations as Cost, Revenue and Margin. With the horizontal data, you can sequency group by Vehicle > Trip:
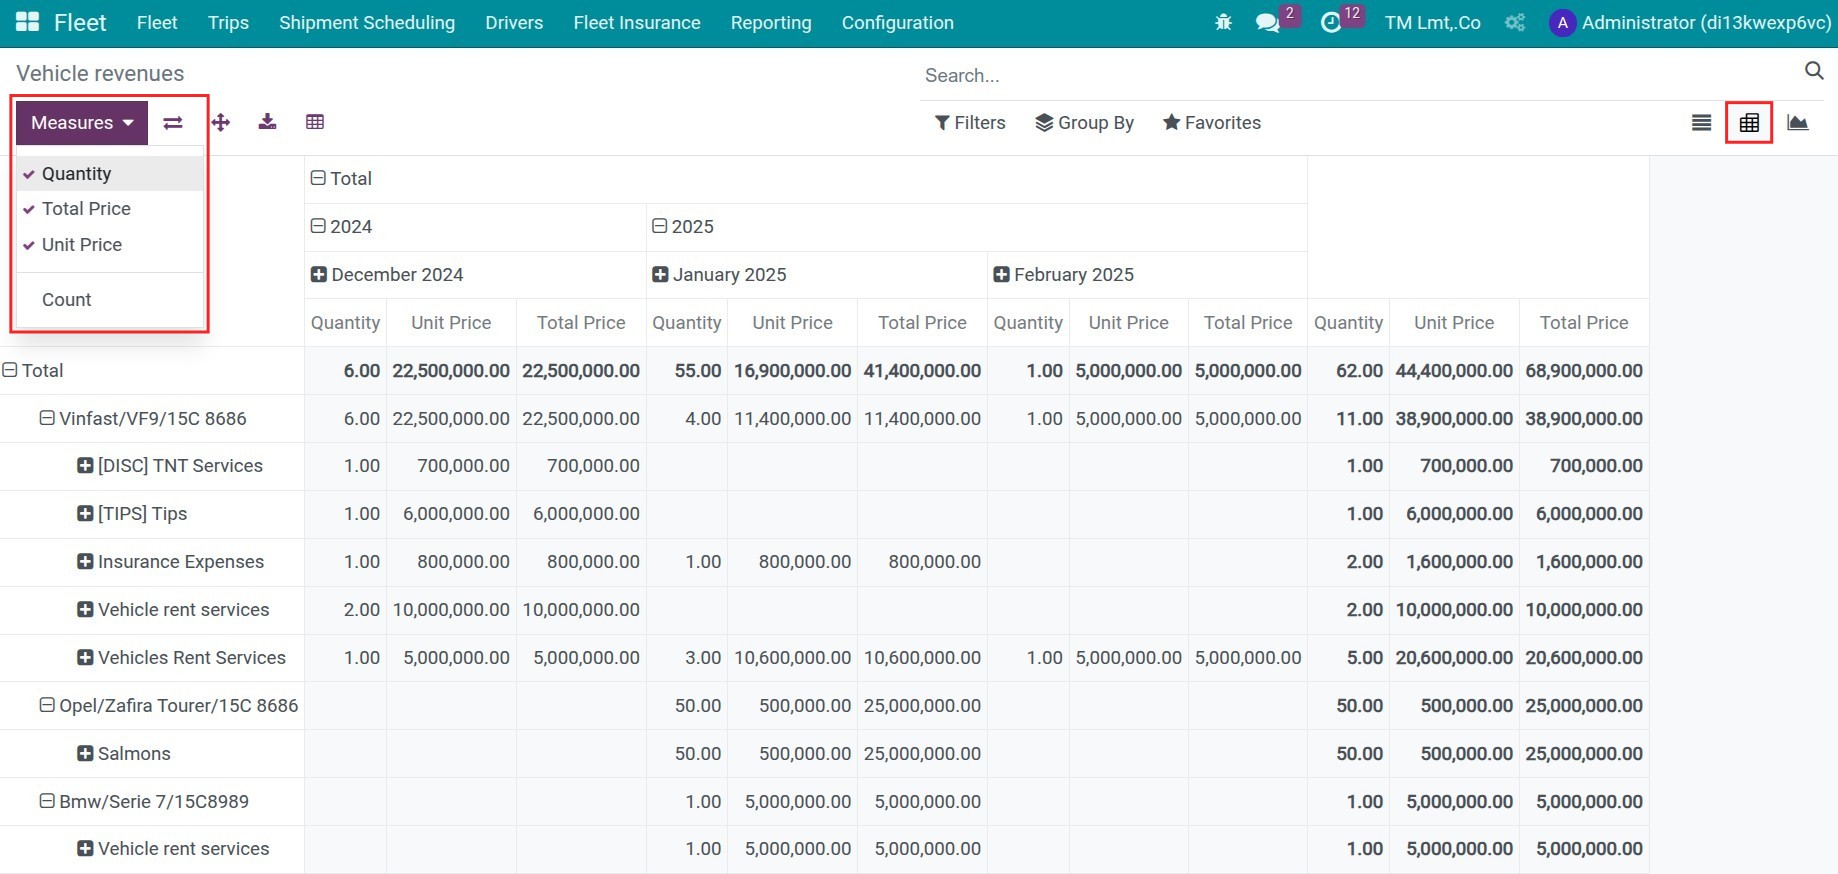
Vehicle Revenues Analysis Reports
If you need to see the report of revenues separately, you can navigate to Fleet > Fleet > Revenues, then choose the Pivot or Graph view, sequency group by Vehicle:
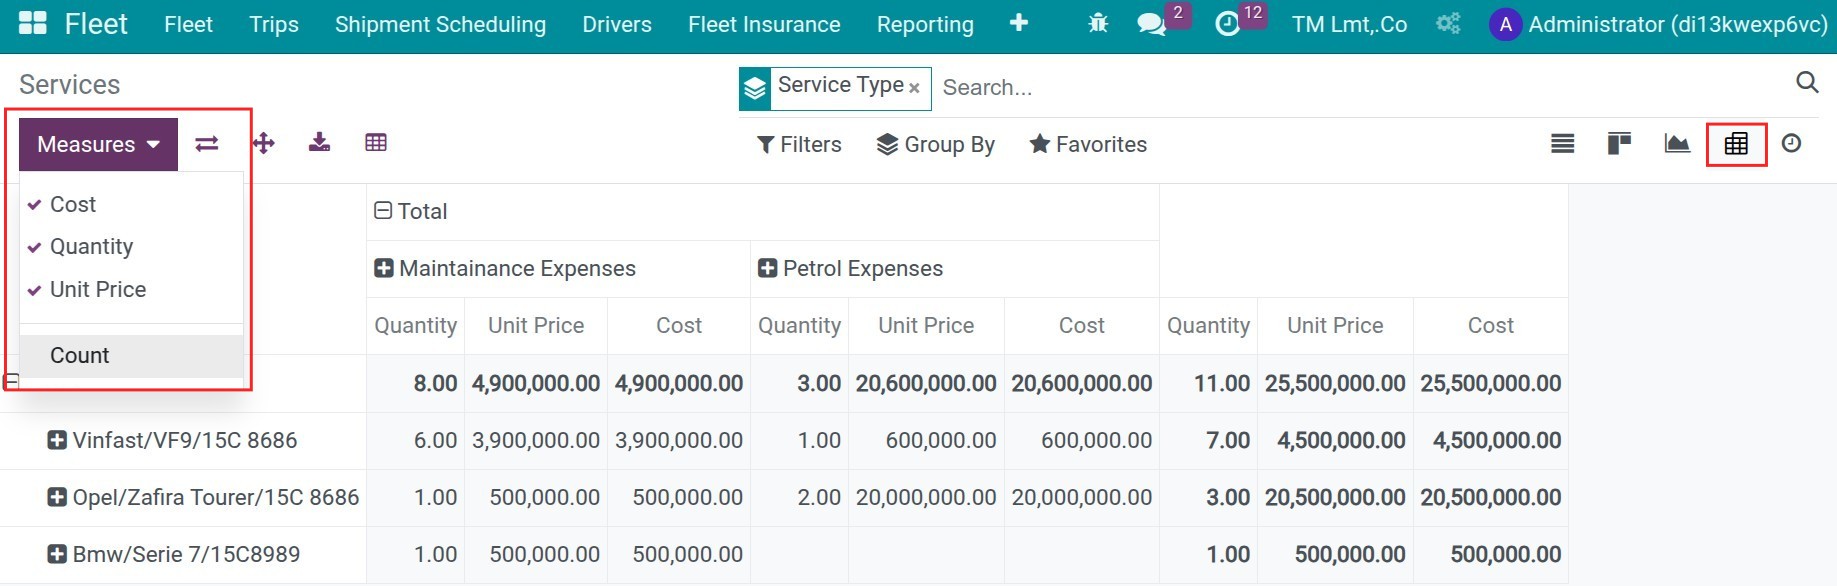
Vehicle Cost Operation Analysis Reports
Navigate to Fleet > Fleet > Services, then choose the Pivot or Graph view. The column-wise data will be arranged by Services Type by default, choose the Vehicle criteria with the horizontal data.
See also
Related article
Optional module