Freight Dashboard
Guide information
Required modules
The Freight Dashboard gives Operations Managers a real-time read of the freight operation’s health: how many shipments are active, how many are late, what the profitability looks like, and where urgent action is needed — all in one screen, without needing to query individual shipment records.
Why a dedicated dashboard instead of the Shipments list? The Shipments list shows individual records. The dashboard answers the question “Is the operation on track right now?” A manager reviewing 40–60 active shipments in a list view takes 15–20 minutes and still may miss the pattern. The dashboard answers the same question in 2–3 minutes.
Scenario used throughout this guide: Nguyen Van E, Operations Manager at Hai Long Logistics, uses the dashboard for his morning operational check (24/04/2026) and for the end-of-month profitability review (01/05/2026).
Accessing the dashboard
Go to .
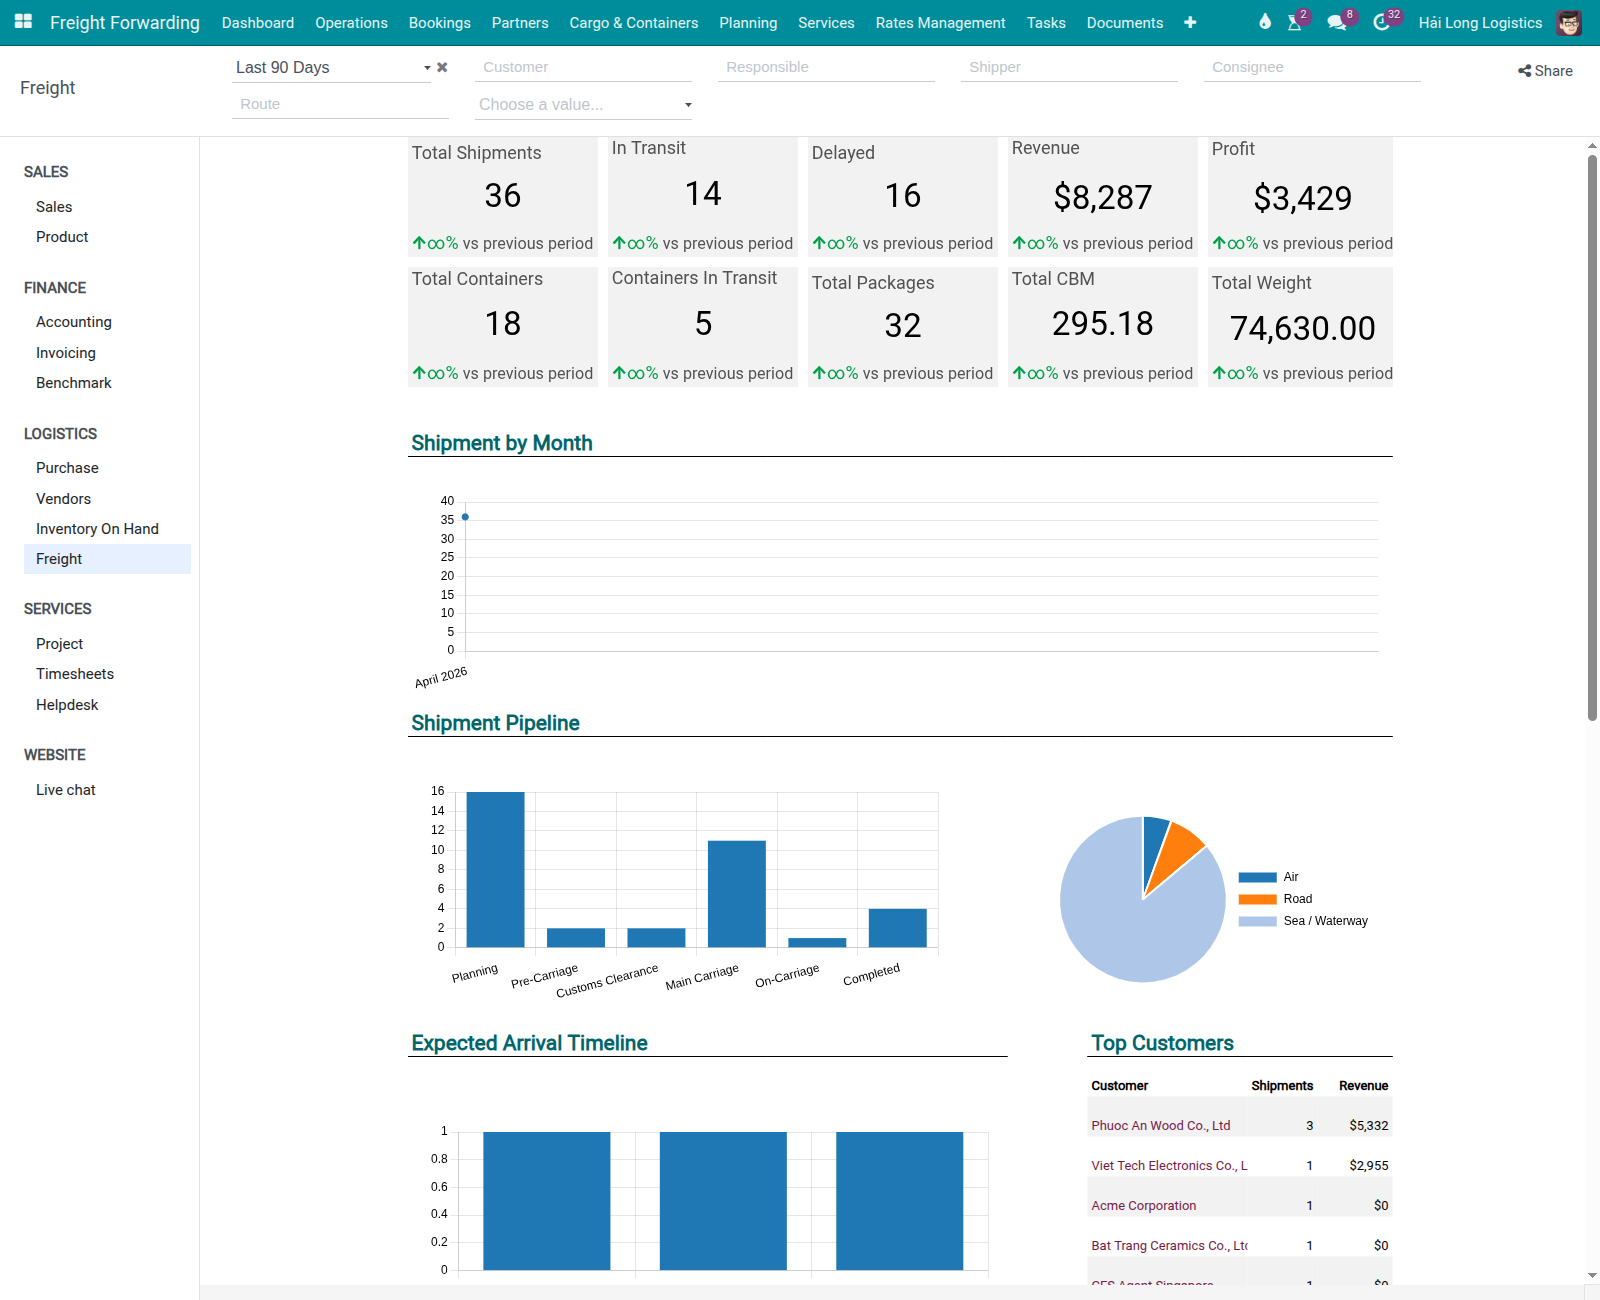
The dashboard opens with the default filter set to the last 3 months. The screen has four sections, read from top to bottom:
10 KPI Scorecards — summary numbers at a glance.
4 Charts — trend lines, breakdowns by mode, revenue vs cost over time.
6 Lists — detailed records requiring attention.
Filter panel (right side) — 7 global filters.
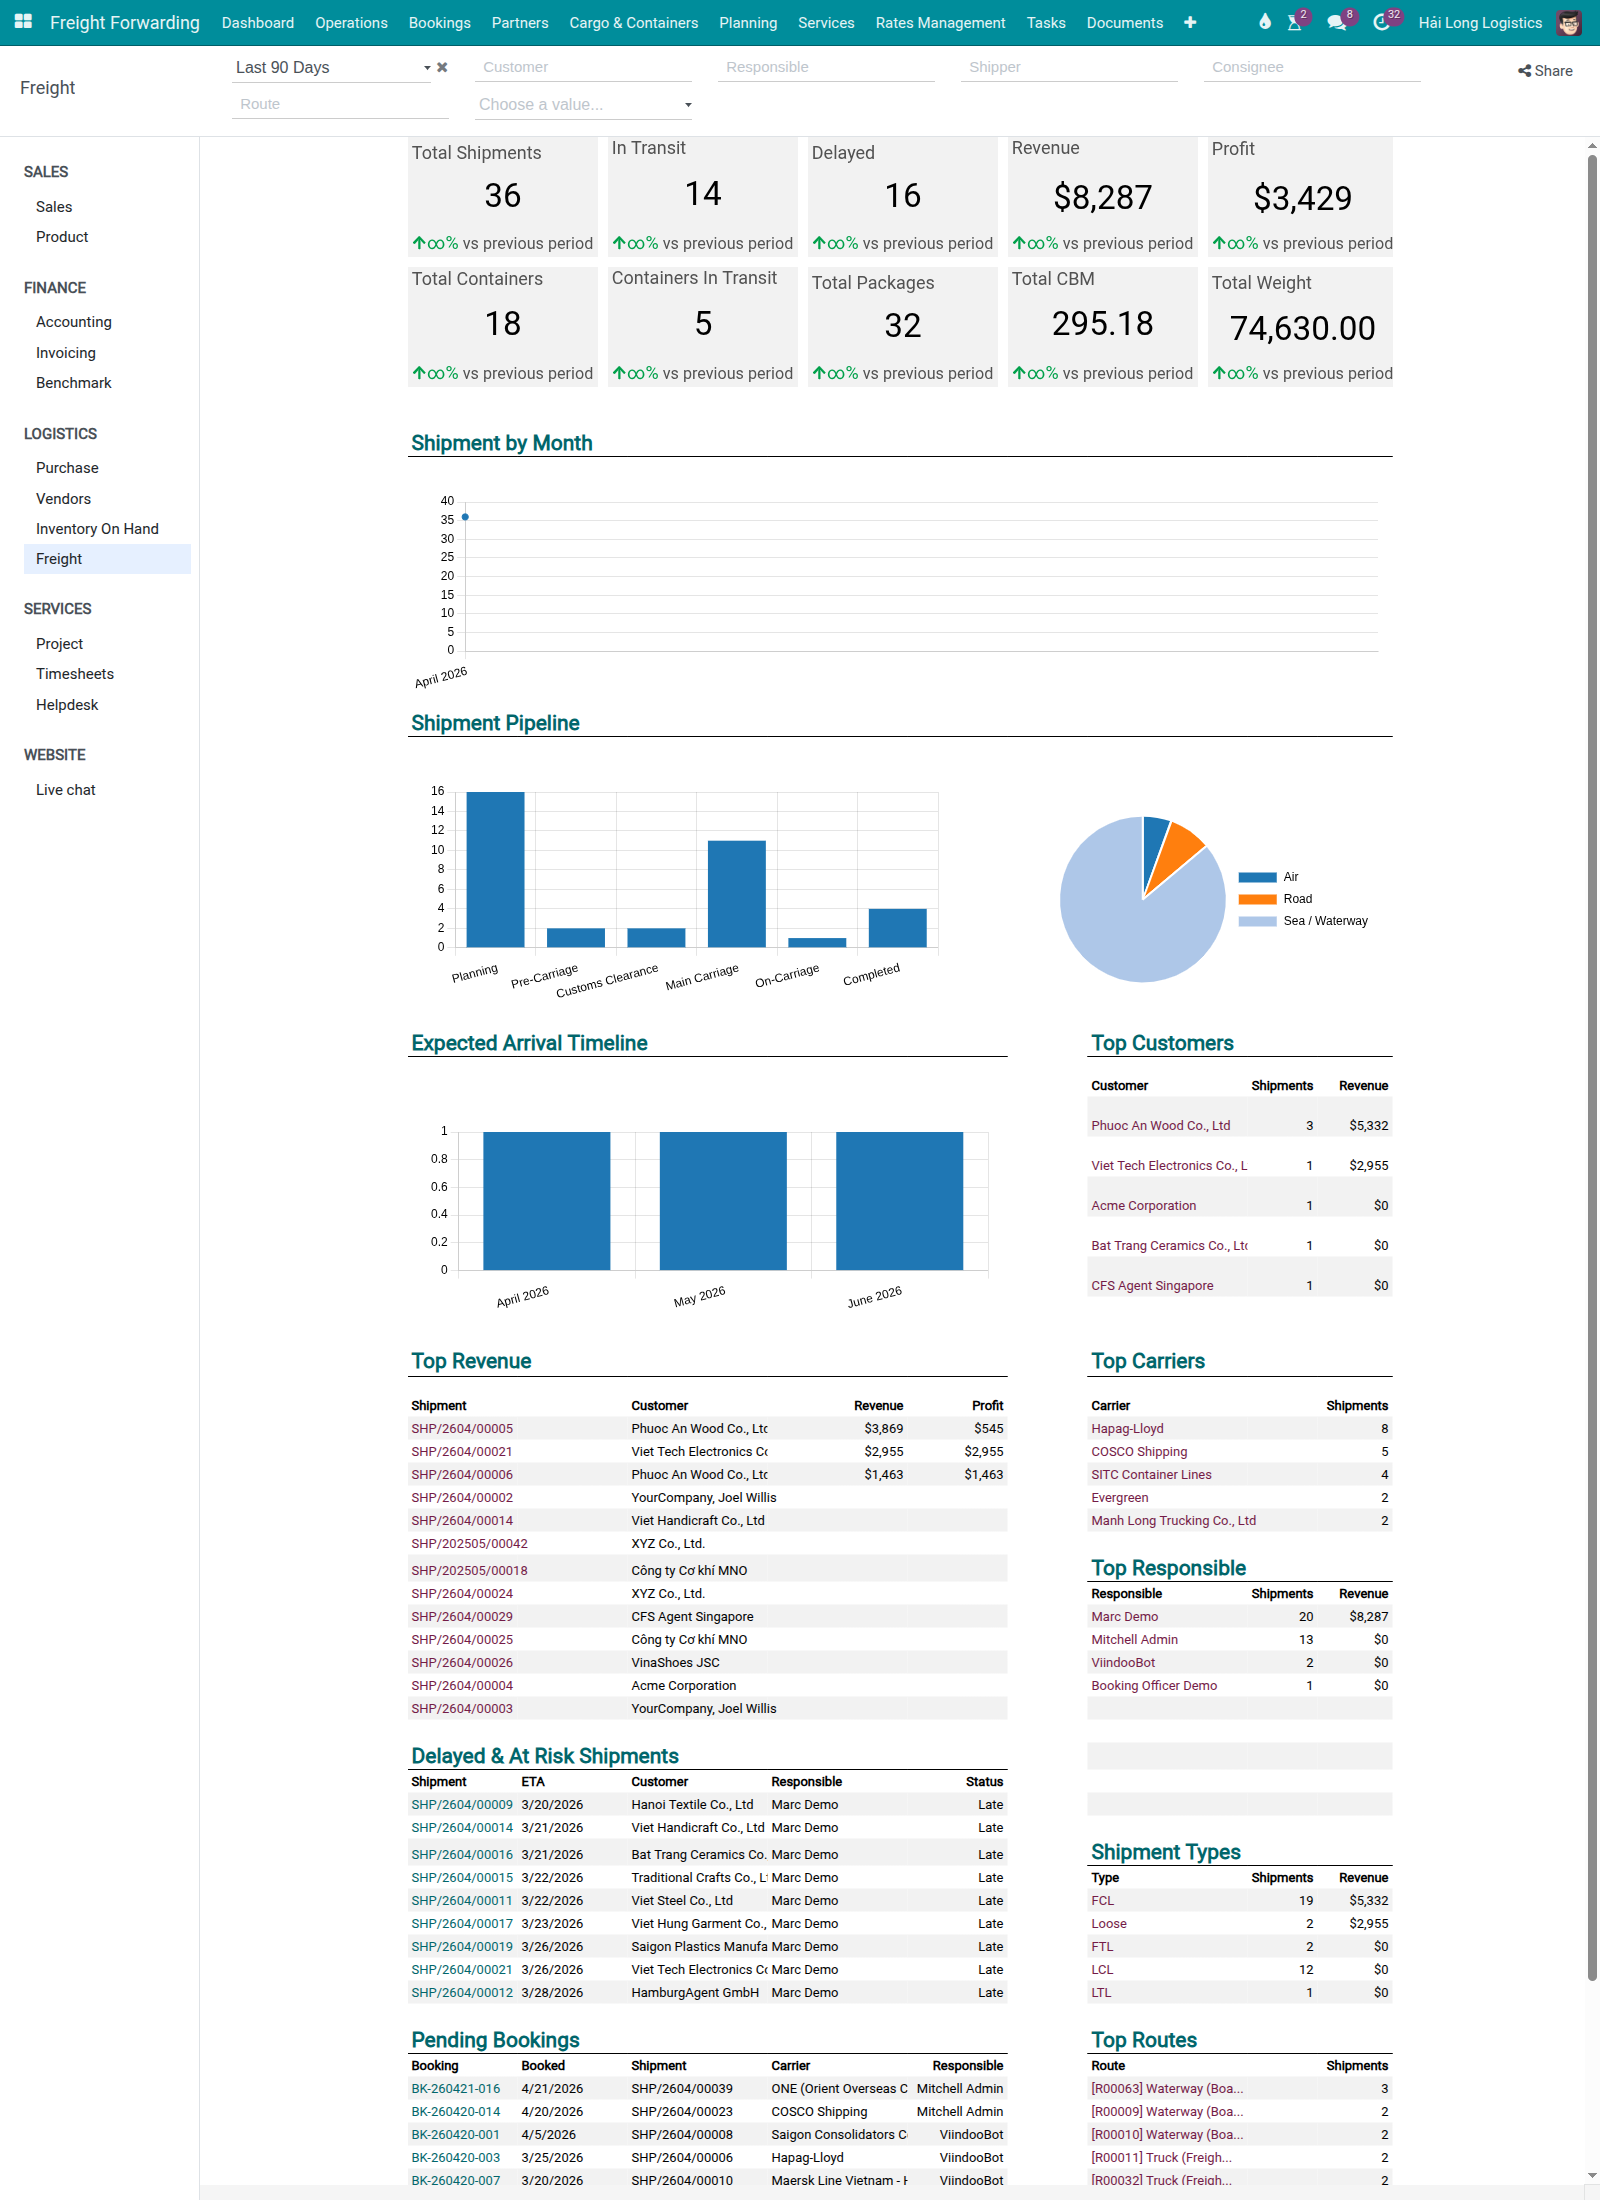
Reading the 10 KPI Scorecards
The scorecards are the fastest way to answer “Is anything wrong right now?” Read them in priority order: risk → volume → financial.
Risk scorecards (read first):
Scorecard |
What it measures |
Business significance |
|---|---|---|
Delayed |
Shipments where Delivery Status = |
Every delayed shipment is a potential demurrage charge and a customer claim. If Delayed > 5, the manager must review each one and assign a recovery action today. |
At Risk |
Shipments where Tracking Alert Status = |
Not yet late, but may become late. Addressing root cause before ETA passes avoids emergency recovery costs. At Risk is a different field from Delayed — do not confuse them. |
Volume scorecards (read second):
Scorecard |
What it measures |
Business significance |
|---|---|---|
Active Shipments |
Shipments currently active ( |
Baseline load count. Lower than the team’s capacity expectation → check whether new bookings are being entered in the system. |
In Transit |
Shipments in Confirmed or In Transit status. |
Operational exposure — how many shipments need active monitoring. |
Pending Docs |
Shipments missing required documentation (HBL not recorded, D/O pending, SI not submitted). |
Each missing document can delay customs clearance by 1–3 days at USD 30–60/container/day in demurrage. |
Financial scorecards (read last):
Scorecard |
What it measures |
Business significance |
|---|---|---|
Revenue (Period) |
Total revenue from sale order lines where |
Tracks whether billing is on pace with booking volume. Note: requires sale orders linked to shipments — not derived from freight charges directly. |
Cost (Period) |
Total cost from vendor charges in the selected period. |
Compare against Revenue to estimate gross margin direction. |
Gross Profit (Period) |
Revenue minus Cost for the period. |
If below the target margin (e.g., < 8%), investigate which shipments are pulling the average down. |
Completed (Period) |
Shipments completed in the selected period. |
Throughput measure. Useful for capacity planning and comparing month-over-month. |
Total CBM / Weight |
Aggregated volume and weight for the period. |
Carrier rate negotiation benchmark and capacity planning. |
Warning
The Period Filter does NOT affect the Delayed, At Risk, Active, Pending Docs and In Transit scorecards.
These scorecards count current-state records (active = True) — they always reflect
the live situation, regardless of the time period selected. Changing the period to
“Last Month” will not retroactively show last month’s delayed shipments. The period
filter only affects Revenue, Cost, Gross Profit, Completed, and CBM/Weight.
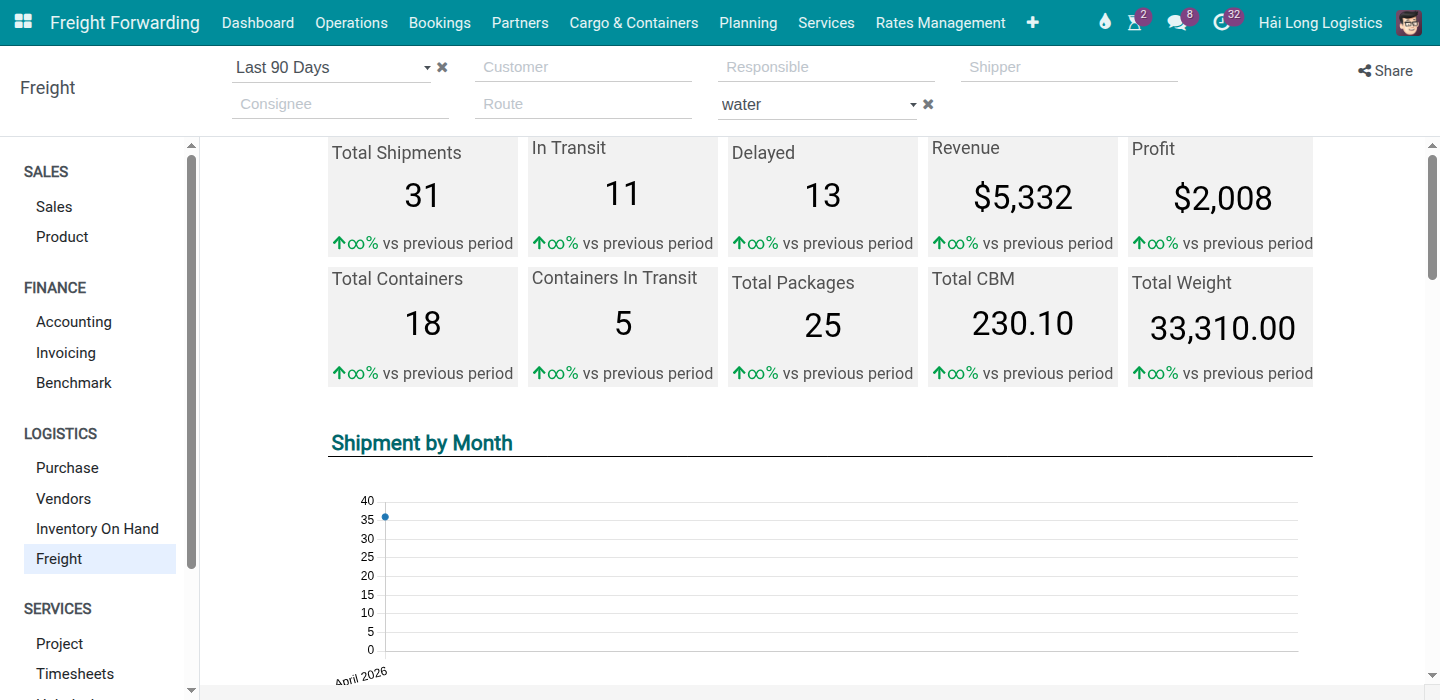
Using the 7 global filters
The filter panel on the right side of the dashboard narrows the data shown in charts and lists.
Filter |
Values |
Use when |
|---|---|---|
Period |
This month / Last 3 months / This year / Custom |
Monthly review: This month. Quarterly: Last 3 months. Annual planning: This year. |
Transport Mode |
Water / Air / Road / All |
Isolate a specific mode to compare sea vs air profitability. |
Direction |
Export / Import / Both |
Compare inbound vs outbound performance separately. |
Shipment Type |
FCL / LCL / Air Direct / Air Consol / Road |
Drill into a specific product line. |
Responsible |
User list |
Check the portfolio of a specific Booking Officer or Operations Staff member. |
Customer |
Partner list |
Review performance for one key customer. |
Status |
Active / Completed / All |
End-of-month: Completed to review closed shipments only. |
Filter combinations by situation:
Question |
Filters to apply |
|---|---|
Which delayed sea export shipments need action now? |
Transport Mode = Water, Direction = Export, Status = Active → read List 1 (Delayed). |
Is air freight margin above 15% this month? |
Period = This month, Transport Mode = Air → read Gross Profit scorecard. |
What is the workload of a specific Booking Officer? |
Responsible = [officer name] → read Active Shipments and Pending Docs. |
What was our FCL export revenue last month? |
Period = Last month, Shipment Type = FCL, Direction = Export → read Revenue scorecard. |
Use case A — Morning operational check (5 minutes)
Context: 08:00 on 24/04/2026. Nguyen Van E opens the dashboard before the morning standup. He needs to know: are there any fires? Will any shipments miss a cutoff today?
Check Delayed. If > 5: open List 1 (Delayed Shipments) and review each record. For each delayed shipment: who is responsible? What is blocking resolution? Assign action.
Check At Risk. Even if Delayed = 0, At Risk > 3 means potential problems by end of day. Open List 2 and confirm the responsible Operations Staff is aware and has a mitigation plan.
Check Pending Docs. If > 0: open List 3 (Missing Documents). Identify which SI cutoffs are approaching today and which D/Os have not been received. Assign to Documentation Officers.
Communicate findings to the ops team at the standup.
Tip
Morning check complete when:
All Delayed shipments have been reviewed and an action assigned (or escalated to senior management).
At Risk shipments have a responsible person and a mitigation plan noted in Chatter.
Pending Docs: each item has an owner and a resolution deadline.
No unexpected anomaly on any scorecard (e.g., Active Shipments suddenly drops by 50%).
Use case B — End-of-month profitability review (20–30 minutes)
Context: 01/05/2026. Nguyen Van E is reviewing April’s operational results.
Set Period = This month (April).
Read financial scorecards. Example: Revenue VND 4.82 billion / Cost VND 4.52 billion / Gross Profit VND 298 million → margin 6.2%.
If margin < 8%: open List 5 (Profitability by Shipment) to identify which shipments pulled the margin down. Common culprits: a large FCL shipment with an unrecorded demurrage charge, or a cost line with Cost Price = 0.
Filter Transport Mode = Water → check sea freight margin separately from air and road. For Hai Long Logistics, sea FCL should carry ≥ 8% margin; air direct typically ≥ 12%.
For shipments with Gross Profit < 5%: open the shipment record → Charges tab. Check for missing cost lines, blank Cost Price, or currency conversion discrepancy.
Review List 6 (Completed Shipments with open draft invoices) — all draft invoices for April-completed shipments should be posted before month-end close. Open each and confirm the Accounting team has posted them.
Tip
End-of-month review complete when:
Revenue and Gross Profit figures match the Accounting team’s preliminary closing figures (within 1–2% variance, explained by timing differences in invoice posting).
All shipments with margin < 5% have documented root causes.
No draft invoices outstanding for completed shipments in the current period.
Summary shared with Sales and Finance by the 3rd working day of the new month.
Dashboard limitations
The following limitations apply to the current Spreadsheet Dashboard engine:
No drill-down from a scorecard. Clicking a scorecard number does not open a filtered list. Use the filter panel and navigate to manually with the same filter values.
No automatic threshold alerts. The dashboard does not send a notification when Delayed > 5. Schedule a recurring calendar reminder for the daily check.
No PDF/Excel export from the dashboard. Use the Shipments list view with the same filters and export from there.
No auto-refresh. Data is fetched on page load and on filter change. Refresh the browser tab if you need the most current data.
No personal dashboard. All users see the same layout. Use the Responsible filter to scope the view to a specific person’s portfolio.
Troubleshooting
A scorecard shows 0 when I expect data
Possible causes:
Filter mismatch: the Period filter is excluding records. Check the period and status filters.
Shipments in Draft: Active / In Transit scorecards count only Confirmed or later. If a batch of shipments was just created but not yet confirmed, they do not count.
Revenue = 0: requires sale orders linked to shipments with
invoice_status != 'no'. If shipments are billed only through freight charges (not through sale orders), the Revenue scorecard will show 0. Verify the billing flow with the Accounting team.
The manager sees different numbers than a team member
Cause: Access control. Users with the Logistics: User: All Shipments access level see all records. Users with the standard Logistics user access see only shipments where they are the responsible user.
Resolution: The Responsible filter in the dashboard may already be scoped to the user. Remove the Responsible filter to see all records (manager access required).
Containers In Transit count is higher than Shipments In Transit
Cause: These are different counts. One shipment can have multiple containers; each container is tracked independently. It is normal for Containers In Transit to be 2–3× higher than Shipments In Transit on an FCL-heavy operation.
Resolution: No action needed — this is expected behavior on multi-container shipments.
See also
Charges and Profitability — Recording and verifying charges and profitability per shipment
FCL Export — Full FCL export workflow