
Read the freight dashboard
Guide information
Requirements
This tutorial requires the installation of the following applications/modules:
Freight Dashboard (installed automatically together with Freight Forwarder Management, which also brings Spreadsheet Dashboards, Freight Sale, Freight Project & Operations Tasks and Logistics Routes Integration)
The Freight Dashboard is the one screen that reads the whole active shipment book at once, instead of one shipment at a time. It is where an Operations Manager decides which shipments need attention today - before opening any single shipment form. Reading it correctly means knowing that several of its numbers quietly leave shipments out: a shipment created more than 90 days ago, or one nobody has touched since it passed its ETA, can be missing from a count that looks complete. If a term below is new to you, see the Industry Glossary.
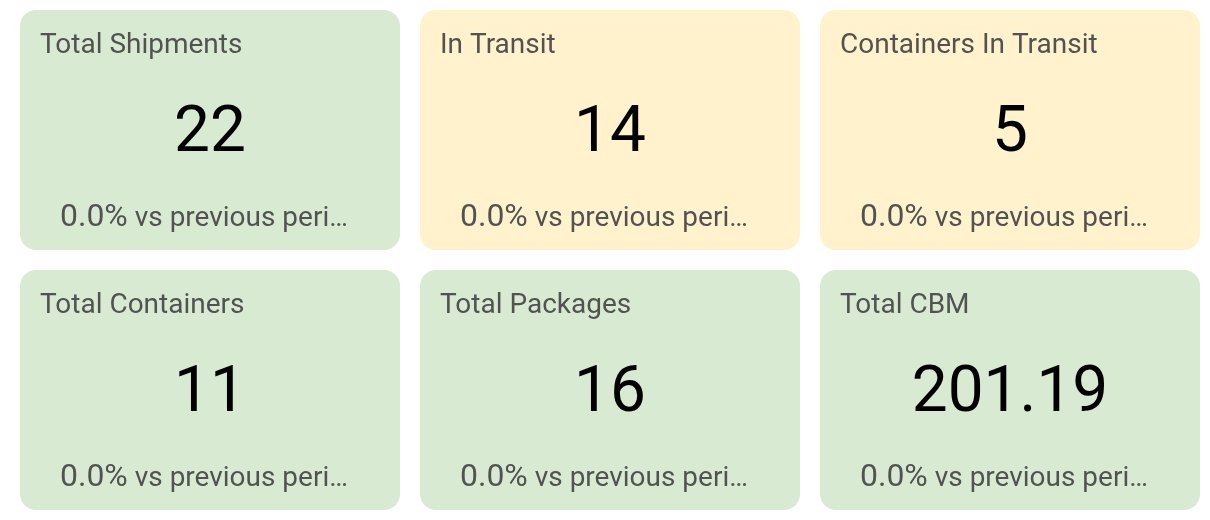
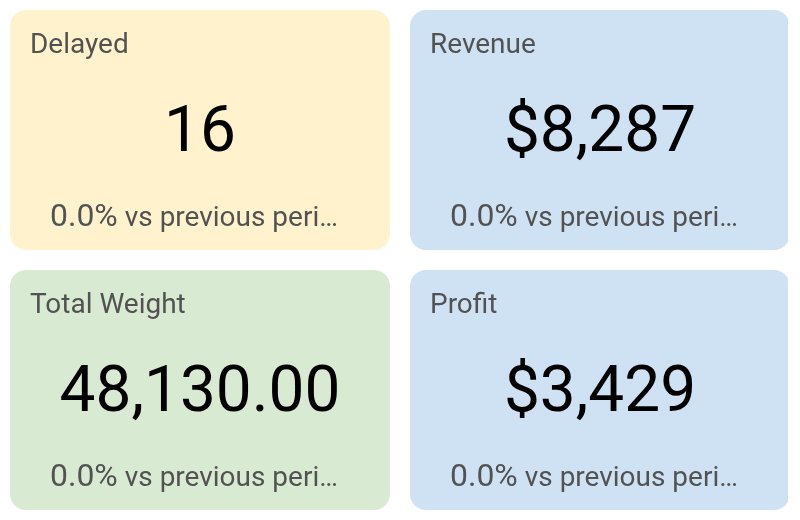
Running scenario: an Operations Manager opens the dashboard of a company that has 22 active shipments: 14 of them in transit, 16 counted as delayed or at risk. The figures on this page come from the Viindoo demo data, so yours will differ; what matters is where each number comes from.
Before you start
You are in the Administrator access level of Logistics. User: All Shipments and User: Own Shipments do not see the Dashboard menu at all. Set the access level in .
Warning
The Period filter in the top bar defaults to a relative range labeled Last 90 Days. For the scorecards and the Shipment by Month and Shipment Pipeline charts it counts from each shipment’s creation date, not its ETA or current state. It narrows every KPI scorecard, including those that count a current state such as Total Shipments or Delayed - a shipment created more than 90 days ago that is still running today drops out of those counts until you clear this filter.
Decide whether to clear the Period filter
Option |
Use when |
What changes |
|---|---|---|
Keep the default Last 90 Days filter |
You only care about recent activity |
Faster to read, but can hide a shipment older than 90 days that is still running |
Clear the Period filter |
The morning scan of the whole active book - you must not miss a shipment |
Slightly slower (reads the full un-archived history), but nothing running today is left out |
For a whole-book morning scan, clear the Period filter (the cross next to it) so active shipments older than 90 days remain visible. For a recent-activity review, keep the 90-day filter or choose the period that matches the review.
Read the ten KPI scorecards
Ten scorecards give a snapshot of the whole book before you look at any single shipment.
Go to .
Row 1: Total Shipments, In Transit, Containers In Transit, Delayed, Revenue.
Row 2: Total Containers, Total Packages, Total CBM, Total Weight, Profit.
The screenshots show the scorecards in two parts, the first three columns and then the last two.
Note
Total Shipments and the container, package, CBM and weight cards count every shipment created inside the Period window regardless of its state - a shipment already Done or Cancelled is still counted. Do not read these cards as “shipments still in the open pipeline.” Each card also compares its value with the previous period.
Tip
This step is done when: after clearing the Period filter, you can read Total Shipments, In Transit and Delayed side by side - and you can tell that Delayed already mixes two different situations, covered next.
Tell Delayed from At Risk
The Delayed scorecard and the Delayed & At Risk Shipments table both fold two different signals into one number - reading them as one flat list risks telling a customer their shipment is late when it has only shown early signs of risk, or missing a shipment that is genuinely late.
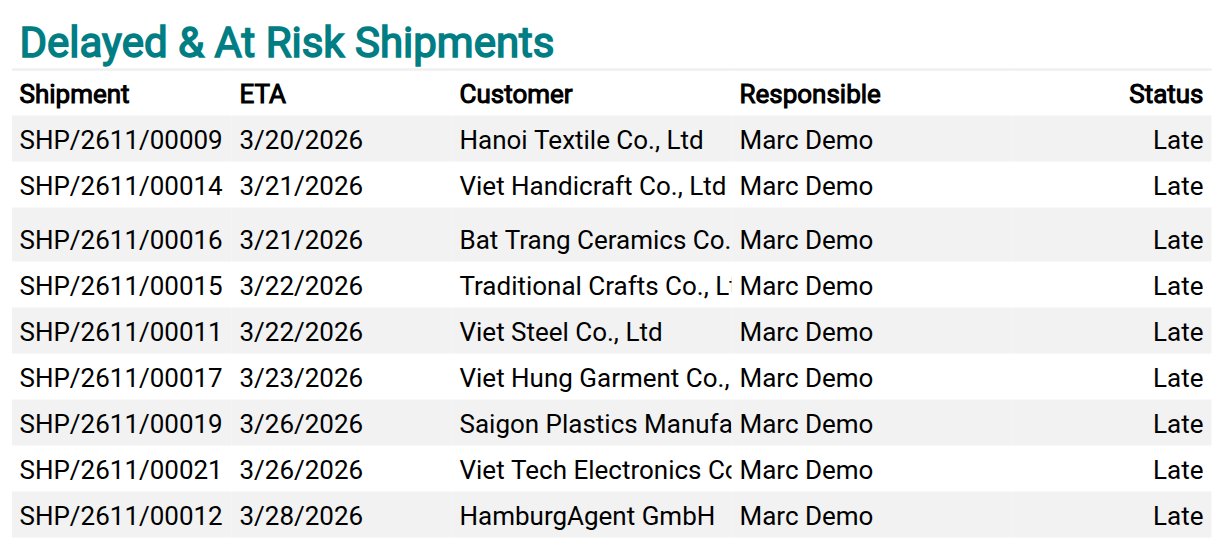
Scroll to the Delayed & At Risk Shipments table. It counts every shipment that is not Done or Cancelled and whose Delivery Status is Late or whose Tracking Alert is At Risk. The table shows only the first nine rows, ordered by ETA, while the scorecard counts all of them: in the demo data the card reads 16 and the table lists nine. The title of the table links to the full list.
Note
Clear the Period filter before reading this table: it matches on ETA falling in the selected range, not on creation date like the scorecards. A shipment whose ETA is outside the range drops out of the table even while the Delayed scorecard still counts it.
To tell a genuinely late shipment from one that is only at risk, open the shipment and compare two separate fields: Delivery Status = Late (its ETA has already passed, or its tracking status is Off Track) against Tracking Alert = At Risk (a vessel or route signal, not necessarily late yet). The table’s Status column shows the delivery status only.
Note
A shipment whose tracking status is On Hold (held for missing documents or customs) appears in neither Late nor At Risk, so it never appears in this table. Check the tracking updates of the shipment separately if you suspect a shipment is being held.
Tip
This step is done when: you can point to a row of the table and explain, from the shipment form, whether it is Late or only At Risk, and why each needs a different response.
Filter by Transport Mode
Sea, air and road shipments go to three different teams - filtering by mode before handing off work avoids assigning a shipment to the wrong team.
In the filter bar, open the Transport Mode list at the bottom of the filters. It offers the technical
codes, not the labels you see on a shipment form: water for Sea / Waterway, air for Air,
truck for Road, rail for Rail and multimodal for Multimodal.

Tip
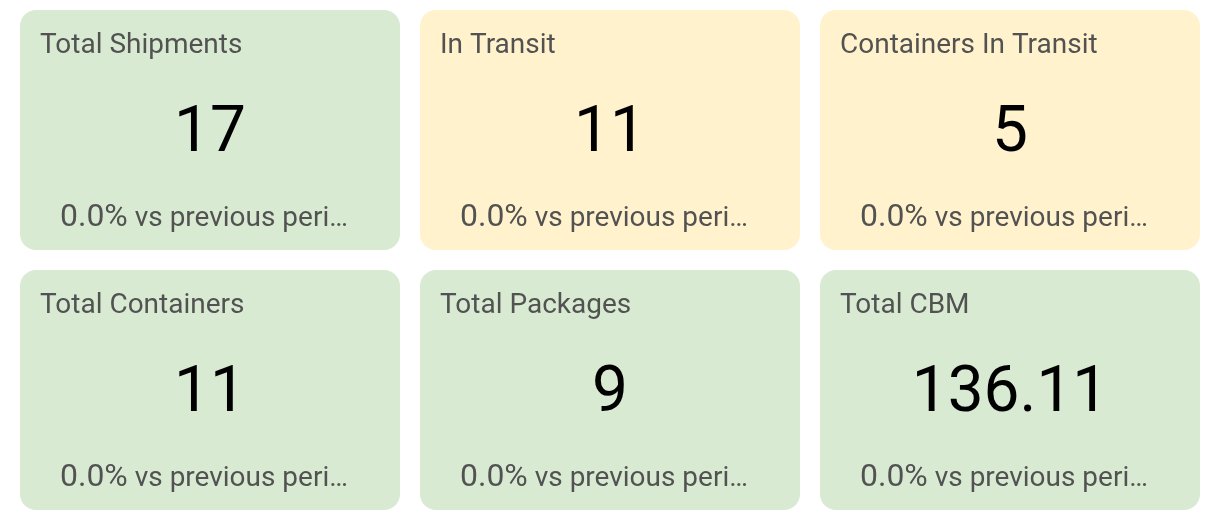
This step is done when: filtering water leaves only the sea shipments on the scorecards, the
charts and the tables - in the demo data Total Shipments falls from 22 to 17.
Read the charts and ranking tables
Charts show a trend or a stage breakdown that ten single-number scorecards cannot.
Four charts: Shipment by Month (new shipments per month), Shipment Pipeline (current stage), a pie chart by Transport Mode, and Expected Arrival Timeline (shipments due over the next five months by ETA).
Eight ranking tables below the charts: Top Revenue, Delayed & At Risk Shipments, Pending Bookings, Top Customers, Top Carriers, Top Responsible, Shipment Types, Top Routes.
Note
Expected Arrival Timeline is the only chart the Period filter does not narrow - it always reads the next five months by ETA. Pending Bookings only lists bookings in state Draft or Confirmed; a booking already sent to the carrier and awaiting a reply does not appear.
Tip
This step is done when: you can find a shipment flagged in the previous step in at least one of the eight ranking tables.
Hand off follow-up work
The dashboard only helps you find a shipment that needs attention - there is no Assign or Mark handled button on it. Open the shipment from , then use its Chatter or your team’s usual channel to assign the follow-up to the Operations staff in charge.
Tip
This step is done when: every shipment on today’s Delayed/At Risk list has a named owner in its Chatter or your team’s channel.
Review profitability periodically
The Revenue and Profit scorecards only show a company-wide trend - finding which customer or route is dragging the margin down needs a different page.
Warning
The dashboard template displays a fixed dollar sign on revenue and profit, whatever the currency of your company. Do not interpret that symbol as a USD conversion. Check the currency and amounts in the profit reports before sharing financial figures.
Read the Revenue and Profit scorecards for the Period you have selected, comparing against the percentage shown below each card.
Top Customers shows only shipment count and Revenue, and Top Routes only a shipment count - neither has a Profit column, so they cannot tell you which customer or route is losing money.
See also
Use Profit by Customer and Profit by Salesperson under for profit by customer and salesperson, and see Charges and Profitability for the revenue and cost of one shipment.
Tip
This step is done when: if Profit fell compared to the previous period, you have opened the profit reports to find the customer responsible, instead of guessing from Top Customers here.
Known limitations
Step |
What Viindoo does today |
What you do instead |
|---|---|---|
Read the KPI scorecards |
The Period filter (default Last 90 Days, by creation date) narrows every scorecard, including ones that count a current state such as Total Shipments and Delayed |
Clear the Period filter before a full scan of the active book |
Read the KPI scorecards |
Delivery Status only recomputes when someone changes the shipment’s ETA, state or tracking - no scheduled job turns a shipment Late just because its ETA has passed |
Also scan the Shipments list sorted by ETA; do not rely on the Delayed count alone |
Tell Delayed from At Risk |
The table matches the Period filter to ETA, the scorecard to creation date, so the two can disagree; Late and At Risk share one table, it shows nine rows at most, and On Hold appears in neither |
Clear the Period filter, open each shipment to read Delivery Status and Tracking Alert, and check On Hold shipments in their tracking updates |
Filter by Transport Mode |
The filter only offers the lowercase technical codes, not the mode label shown elsewhere |
Pick the code listed in the Transport Mode step |
Read the charts and ranking tables |
Pending Bookings excludes bookings that were sent to the carrier and await a reply |
Open the Bookings menu and filter by state to see every booking awaiting a reply |
Review profitability periodically |
Top Customers and Top Routes have no Profit column; the dollar sign is fixed |
Read Profit as provisional and use the profit reports for profit by customer or salesperson |
Troubleshooting
Total Shipments drops sharply overnight with nothing Done or Cancelled
Symptom: The Total Shipments count is much lower than yesterday, although the Shipments list itself has not lost any record.
Cause: The Period filter counts by creation date within the last 90 days - one or more shipments simply aged out of that window as today’s date moved forward.
Fix: clear the Period filter in the top bar, or widen its range, to see the full active book.
The dashboard is blank, or shows “the JSON object must be str, bytes or bytearray, not bool”
Symptom: The Dashboard page is empty, or the browser console shows exactly this message.
Cause: The current user is not in the Logistics Administrator access level. The dashboard record itself is only shared with that group; a user outside it is served no spreadsheet data at all instead of a normal access-denied message. Widening the Dashboard menu’s own groups to other users leads to exactly this.
Fix: put the user in Administrator (Logistics) at instead of widening the menu - User: All Shipments is not enough.
See also
Related articles
Charges and Profitability - revenue, cost and gross profit of one shipment, which the dashboard totals