
Read quality reports and SPC charts
The Reporting menu of the Quality app shows how many checks passed or failed, where the alerts stand and which corrective actions are still open. For a measured value, such as the thickness of a board, the control point shows the average and the standard deviation of the measures and opens a statistical process control (SPC) chart with the norm and the tolerances.
Who |
Quality managers (Quality ‣ Administrator). Quality users see the checks and the Ready to Check filter. |
App |
Quality |
Before you start
Set up the Quality app and its access rights, see Getting started with Viindoo Quality.
For the SPC chart, the control point has the type Measure with a norm and tolerances, see Create control points and quality checks.
The example of this page is the control point Shelf board thickness: the norm is 18 mm, with a tolerance from 17.60 to 18.40 mm, and 16 boards have been measured.
How do I read the quality checks report?
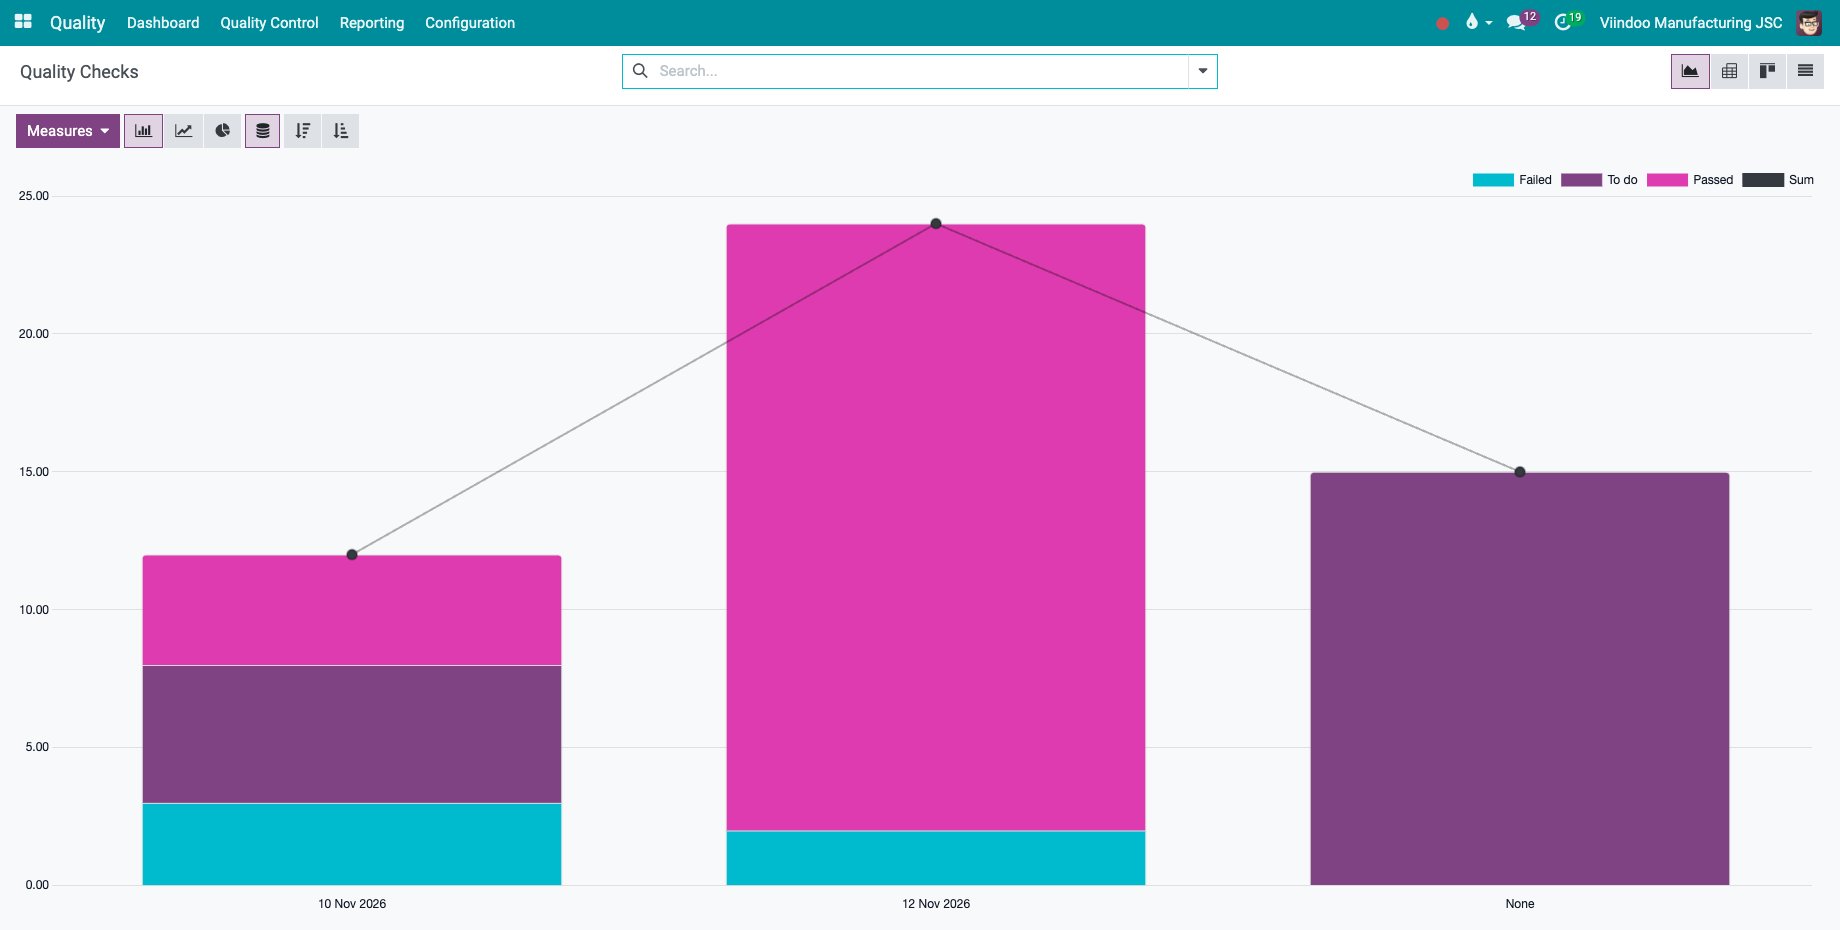
Go to Quality ‣ Reporting ‣ Quality Checks. The chart counts the checks by control date, stacked by state: Failed, To do and Passed.
![The quality checks report as a stacked bar chart]()
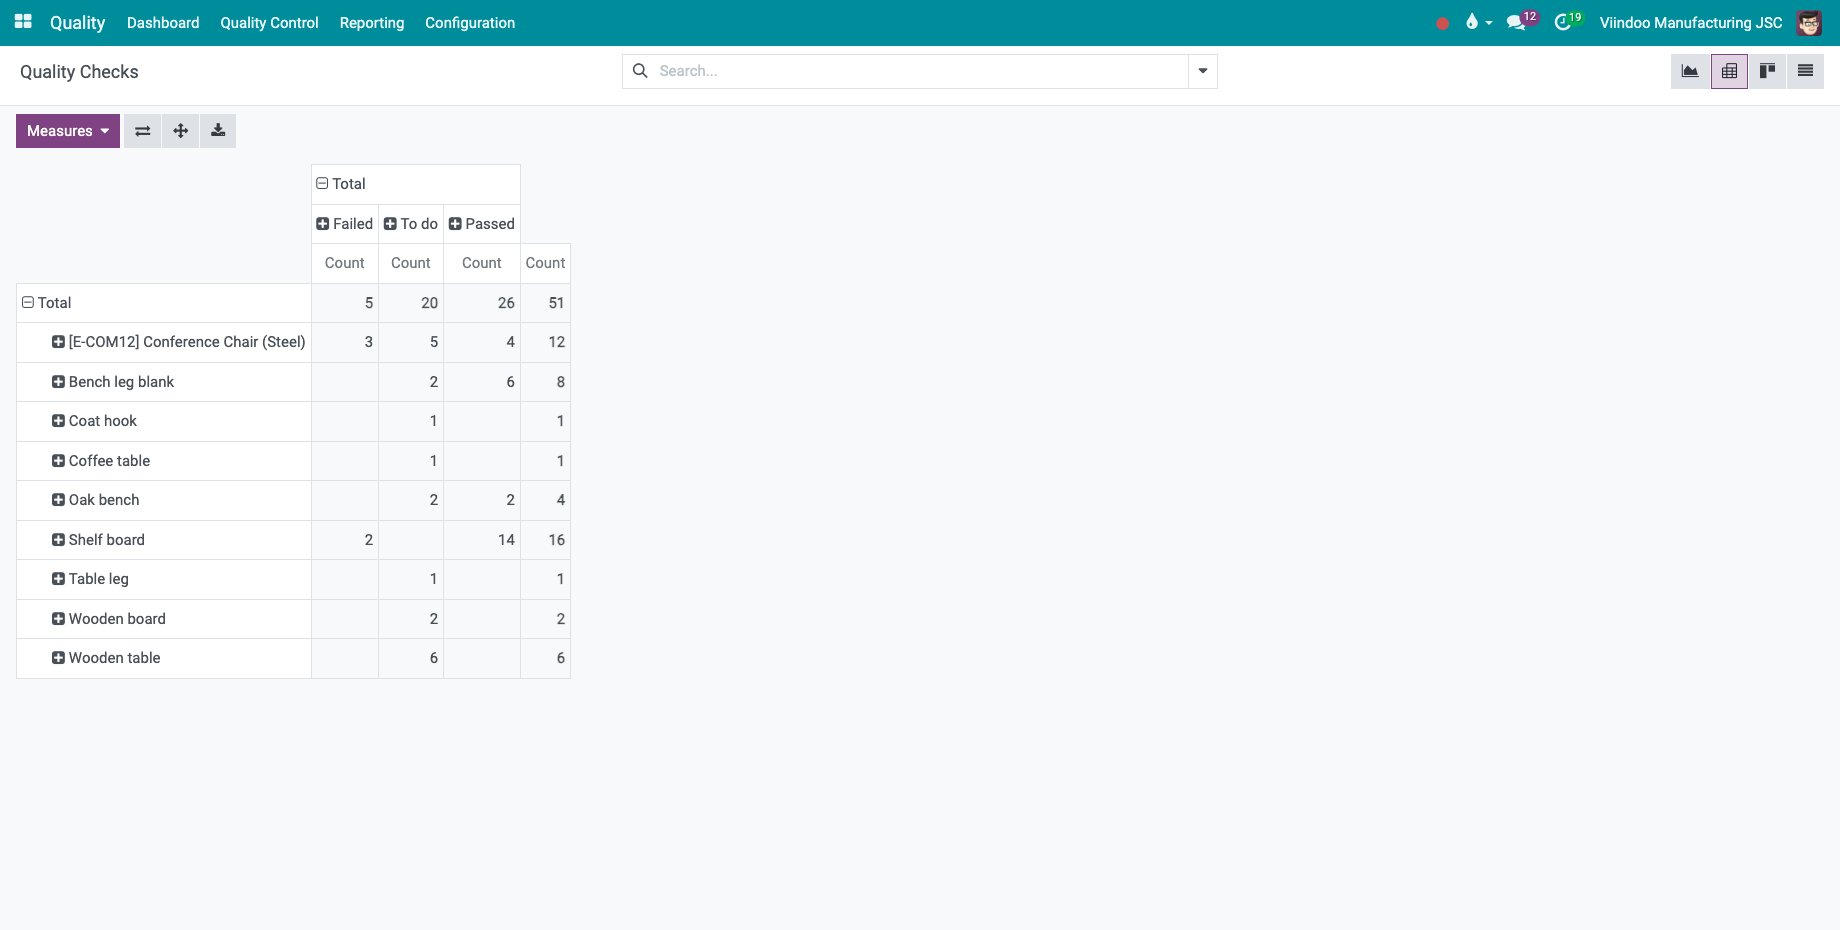
Switch to the pivot view to count them by product. In Measures, choose Count, then group the columns by State.
![The quality checks counted by product and state]()
How do I follow the alerts and the actions?
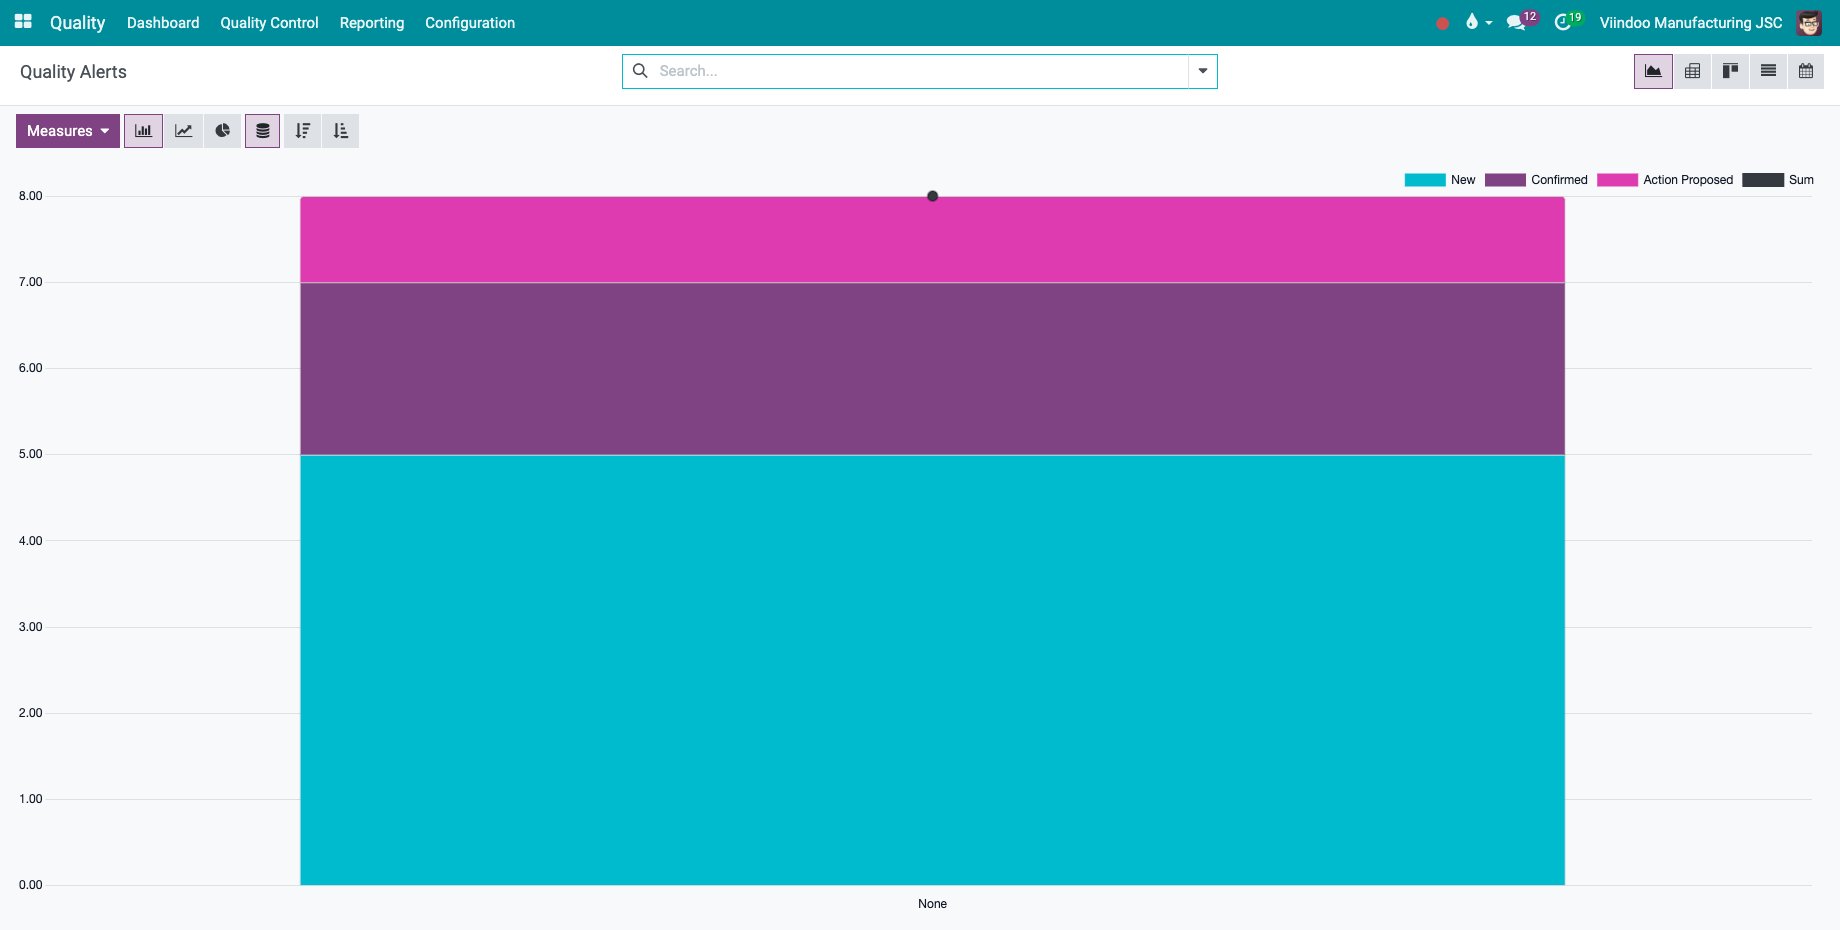
Go to Quality ‣ Reporting ‣ Quality Alerts. The chart groups the alerts by root cause and by stage, so you see the alerts that are still New.
![The quality alerts report by stage]()
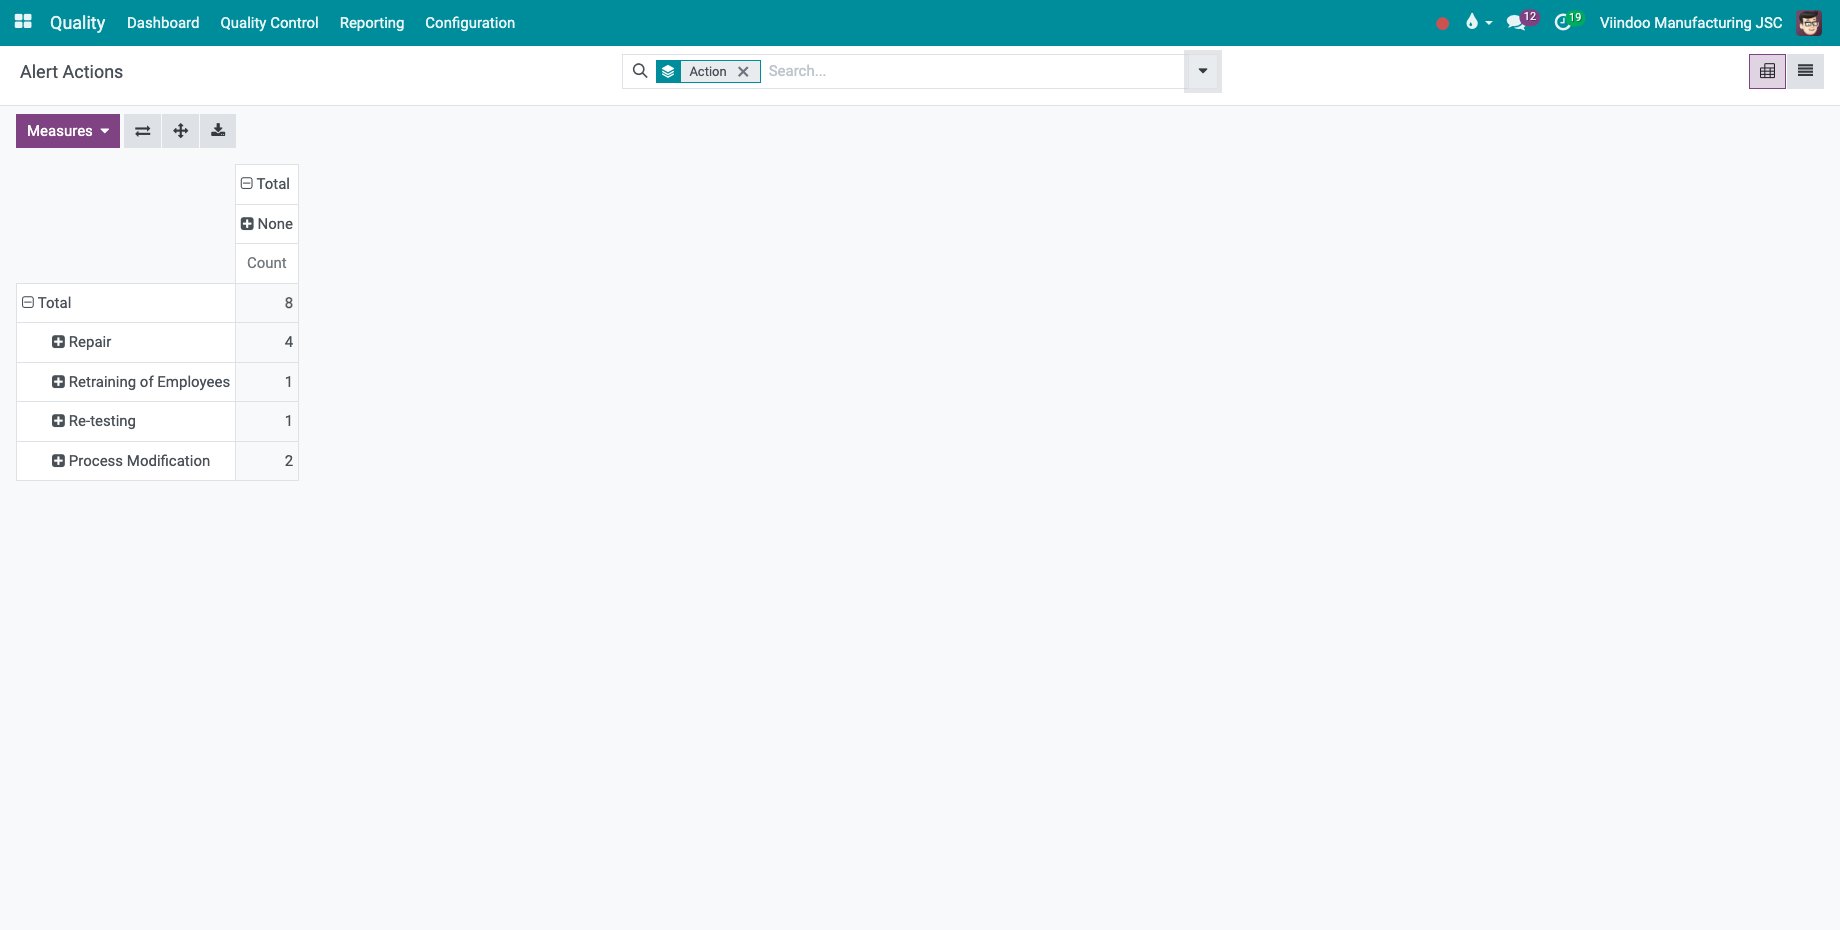
Go to Quality ‣ Reporting ‣ Alert Actions Analysis. The corrective and preventive actions of the alerts are counted by completion date; None holds the actions not done yet. Group the rows by Action, Product, Responsible or Action Type.
![The alert actions grouped by action]()
How do I read the SPC chart of a control point?
Open the control point in Quality ‣ Quality Control ‣ Control Points. The button AVG / STD shows the average and the standard deviation of the measures.
![The average and the standard deviation of a measure control point]()
Click it. The chart draws each measured check, in the order of the checks, with the Norm, the Min Tolerance and the Max Tolerance as lines. A point above or below the tolerance lines is a failed check; points that drift towards a tolerance show a process that needs adjusting before checks fail.
![The SPC chart of the board thickness with the norm and the tolerances]()
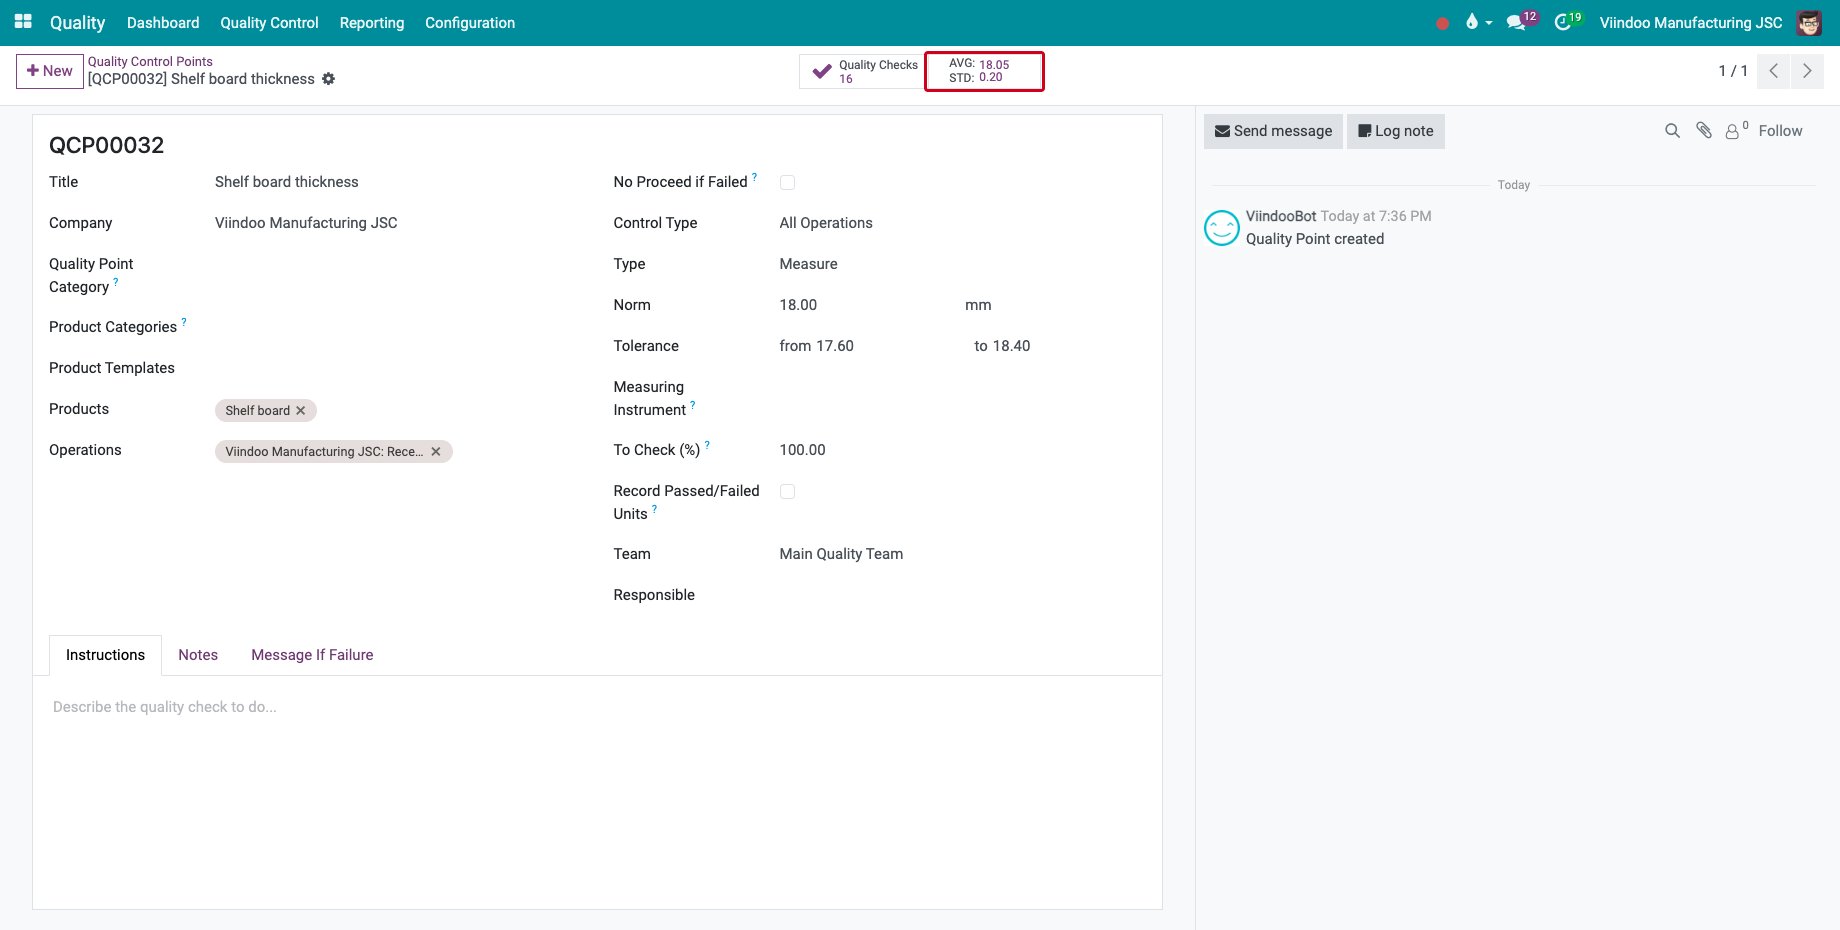
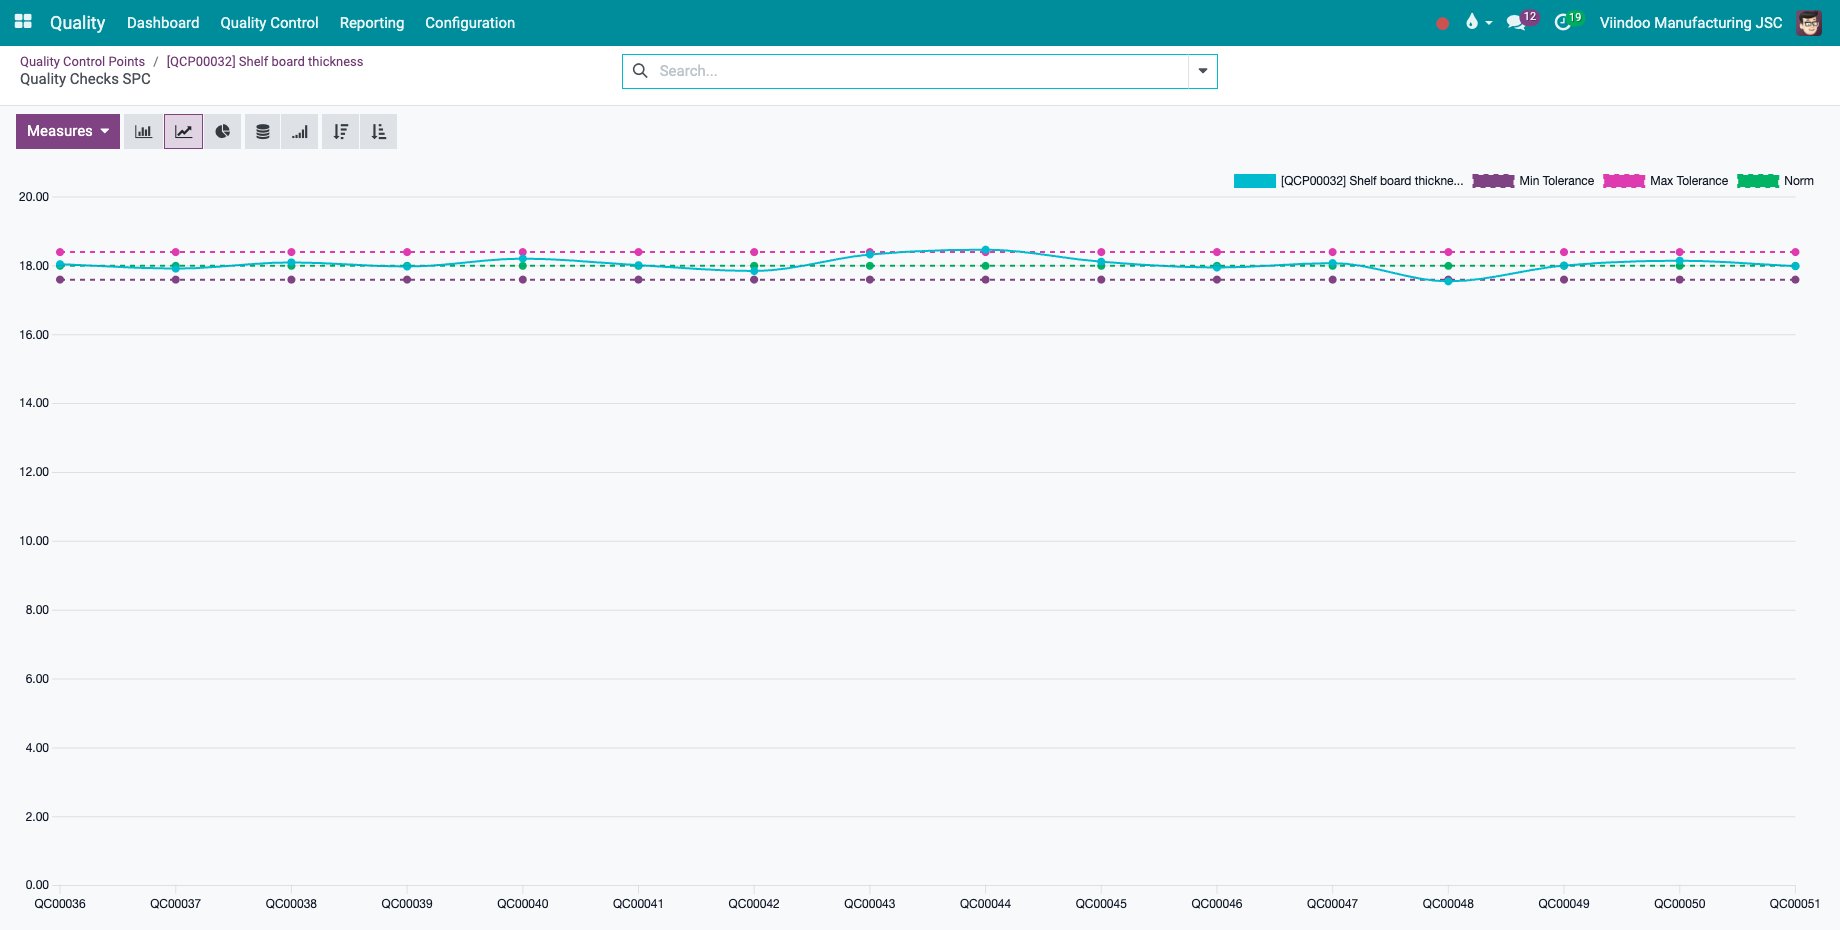
The button shows only on a control point of type Measure with at least one check. The standard deviation needs two checks or more.
How do I find the checks I can do now?
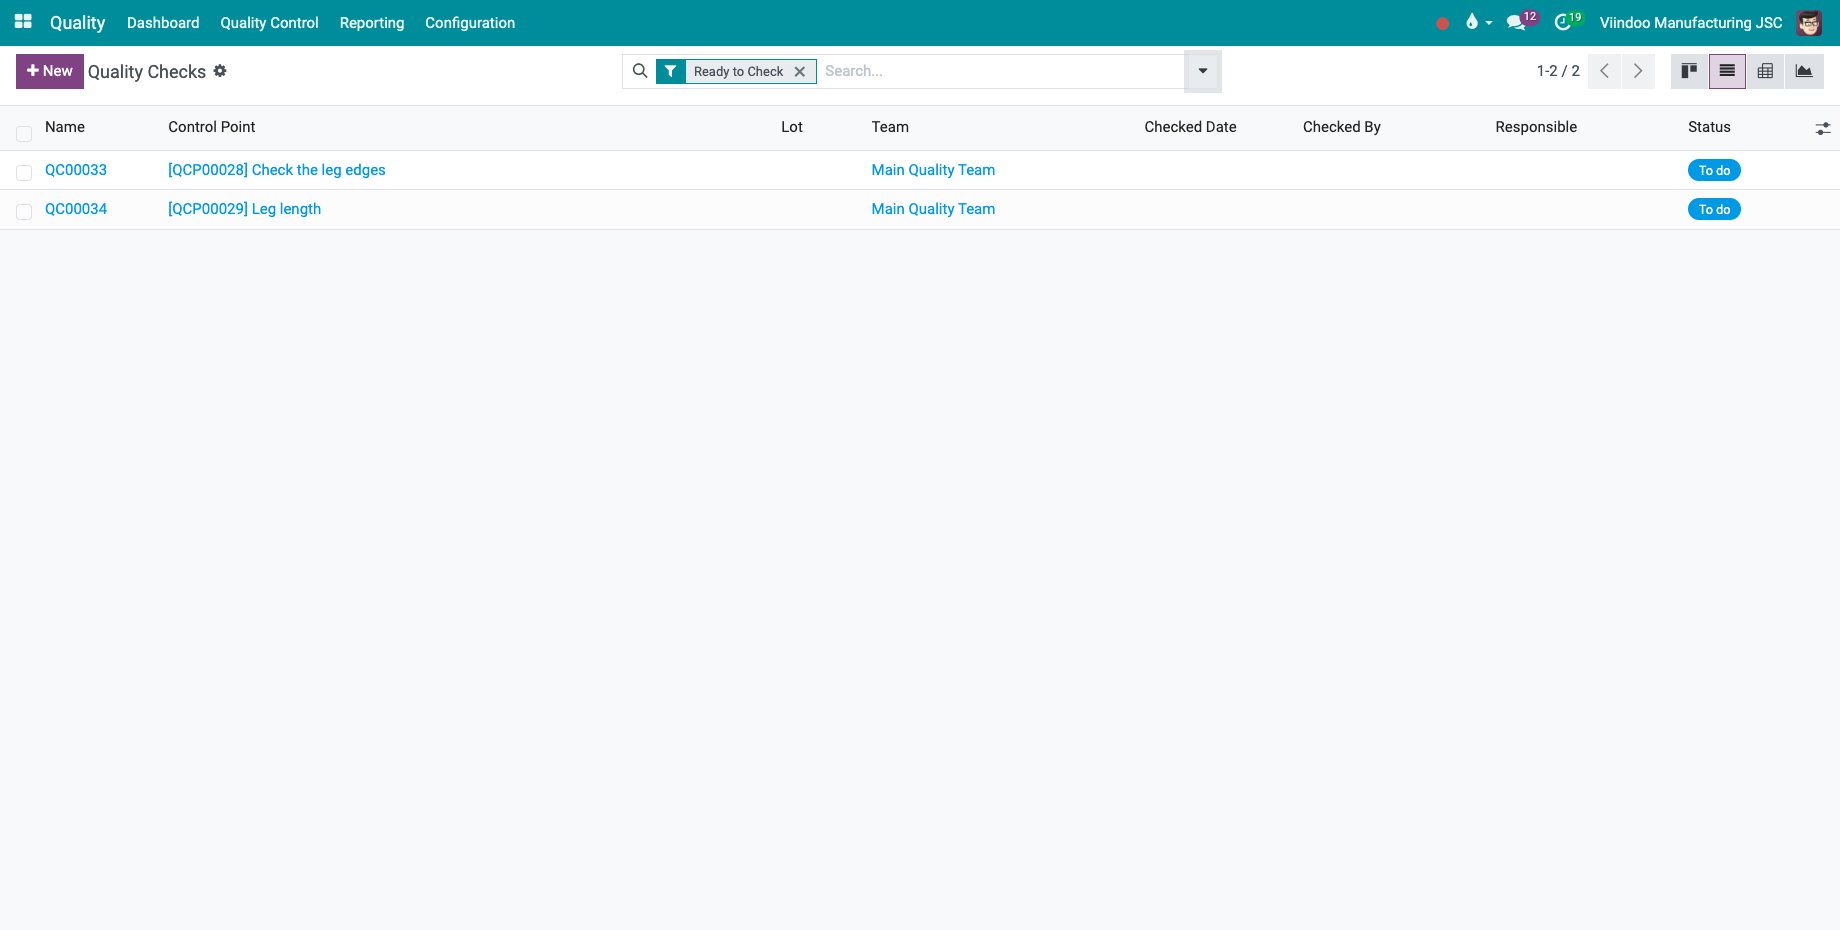
In Quality ‣ Quality Control ‣ Quality Checks, open the filters and choose Ready to Check.
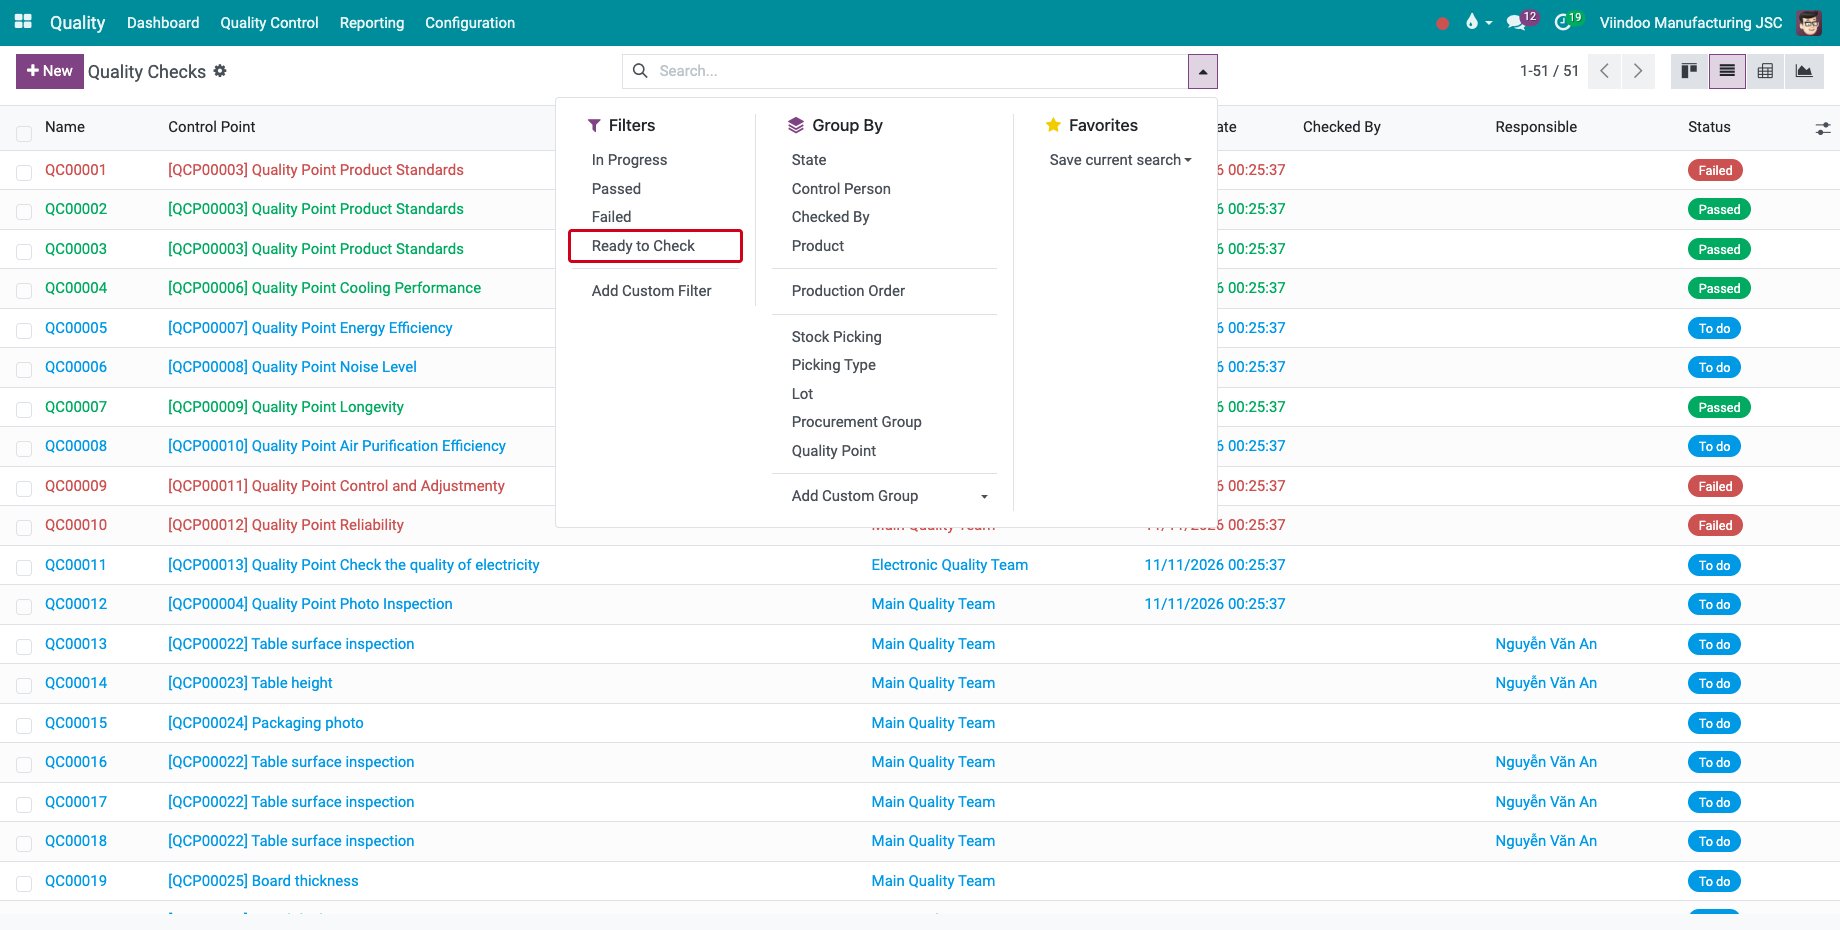
It keeps the checks still to do of the manufacturing orders that have started producing, which are assigned to you or to nobody.
Common errors
Problem |
What to do |
|---|---|
The Reporting menu is missing. |
Give the user the Quality ‣ Administrator access right. |
The AVG / STD button is missing on a control point. |
Set its type to Measure and record at least one check. |
Ready to Check is missing from the filters. |
Give the user a Manufacturing access right. |
Ready to Check shows nothing. |
The orders have not started producing yet: set the quantity being produced on the order. |
Next steps
Create Quality Alerts: raise an alert from a failed check.
See also
Related articles