
Overtime Reports
Audience: HR officers and managers who read overtime figures.
Through the overtime reports, the managers will be provided with an overview of how long the employee works overtime, how to make overtime plans for employees or the amount paid for the overtime, etc.
The Overtime app in Viindoo system supports different types of reports such as line, bar, pie, calendar, or pivot.
View Reports in Pivot
To view overtime reports, access . Here display a pivot report that provides figures to analyze overtime plans by each employee/department or position.
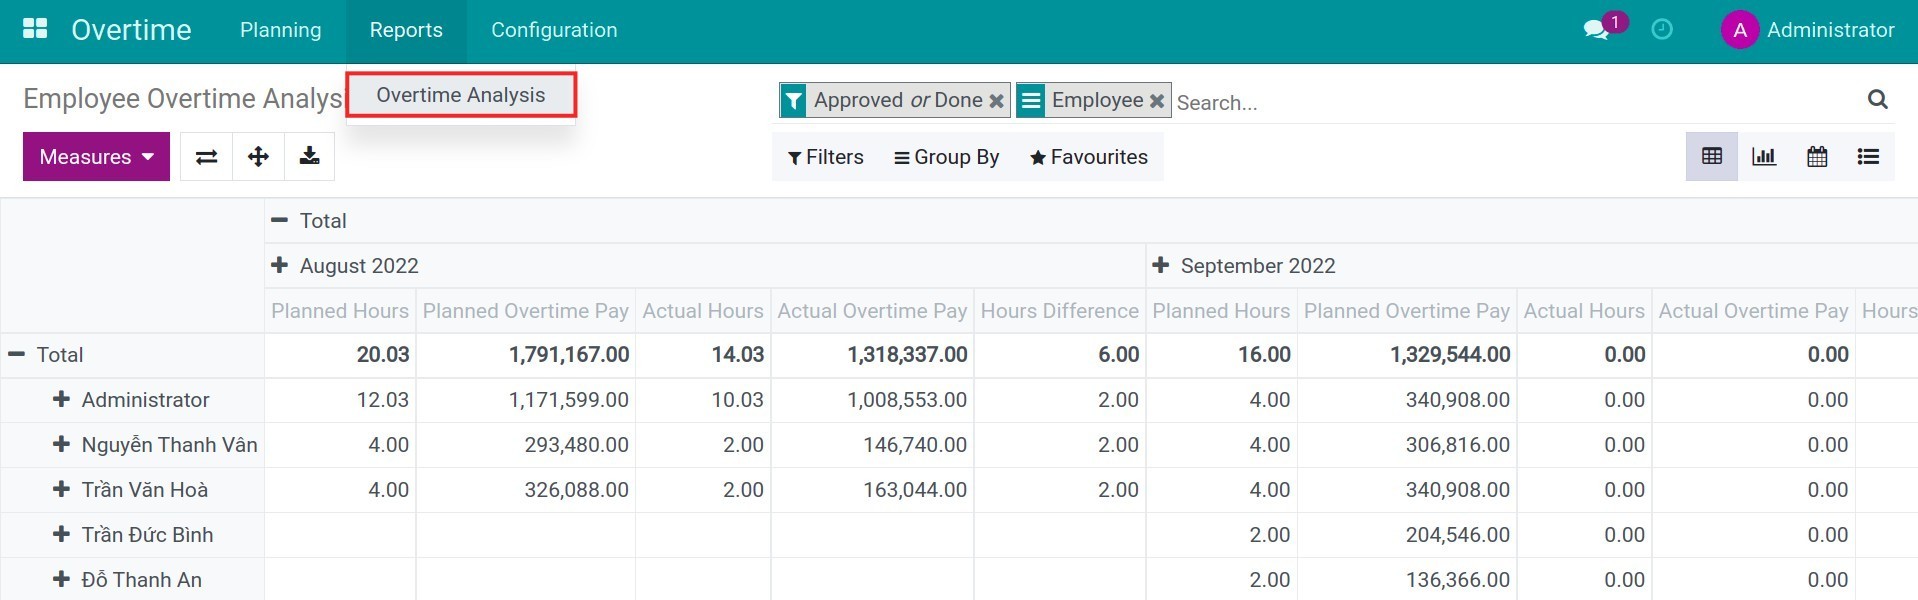
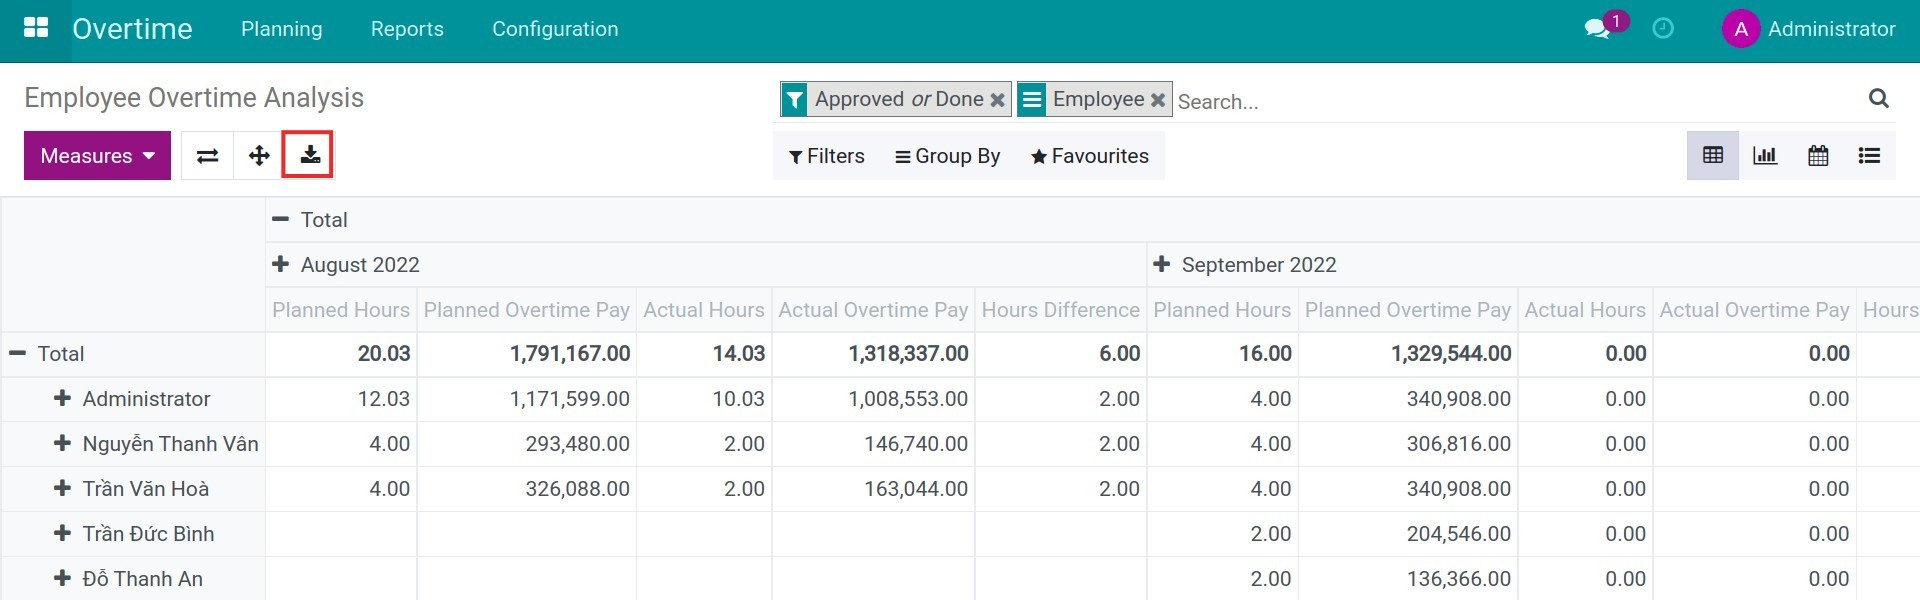
By default, the system filters the records that are Approved or Done and groups the rows by Employee. The columns are grouped by month, and the measures are Planned Hours, Planned Overtime Pay, Actual Hours, Actual Overtime Pay, Hours Difference. In the screenshot, the months are folded into one column by clicking Total in the column header, so that the totals of every employee fit on one screen.
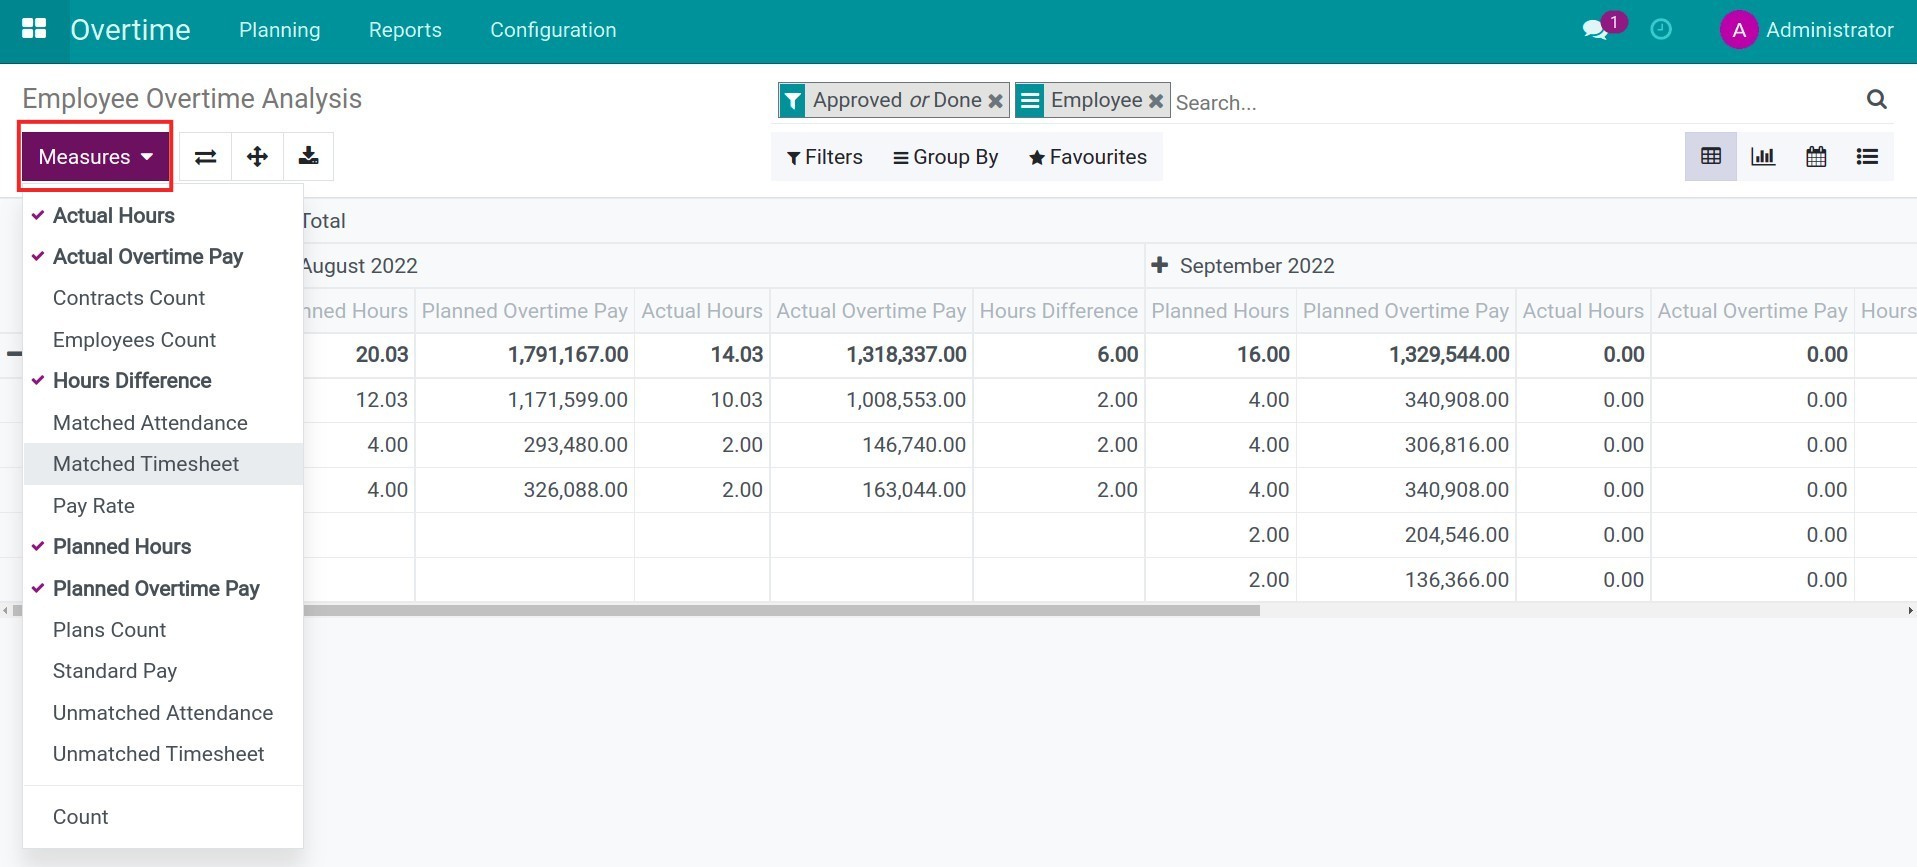
To change the values, you use the criteria at Measures.
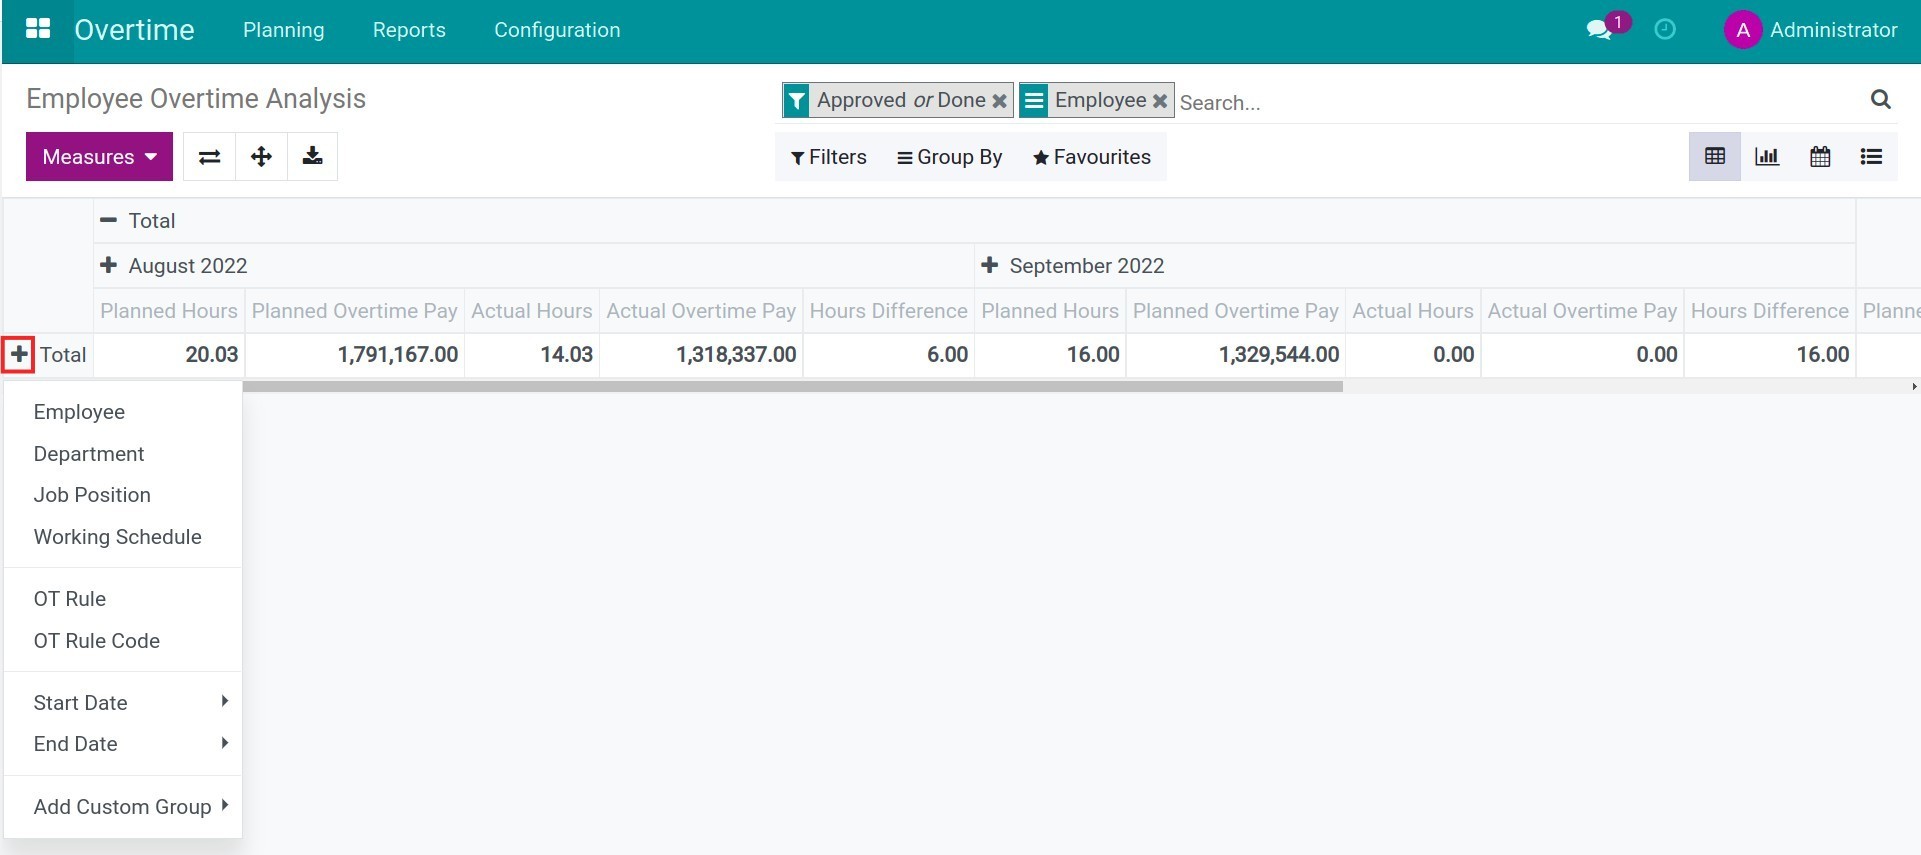
Click on the + of a row to select the criteria that you want to see. For example, reports by Department, Job Position, Working Schedule, OT Rule, OT Rule Code, Start Date, End Date, or any field through Add Custom Group.
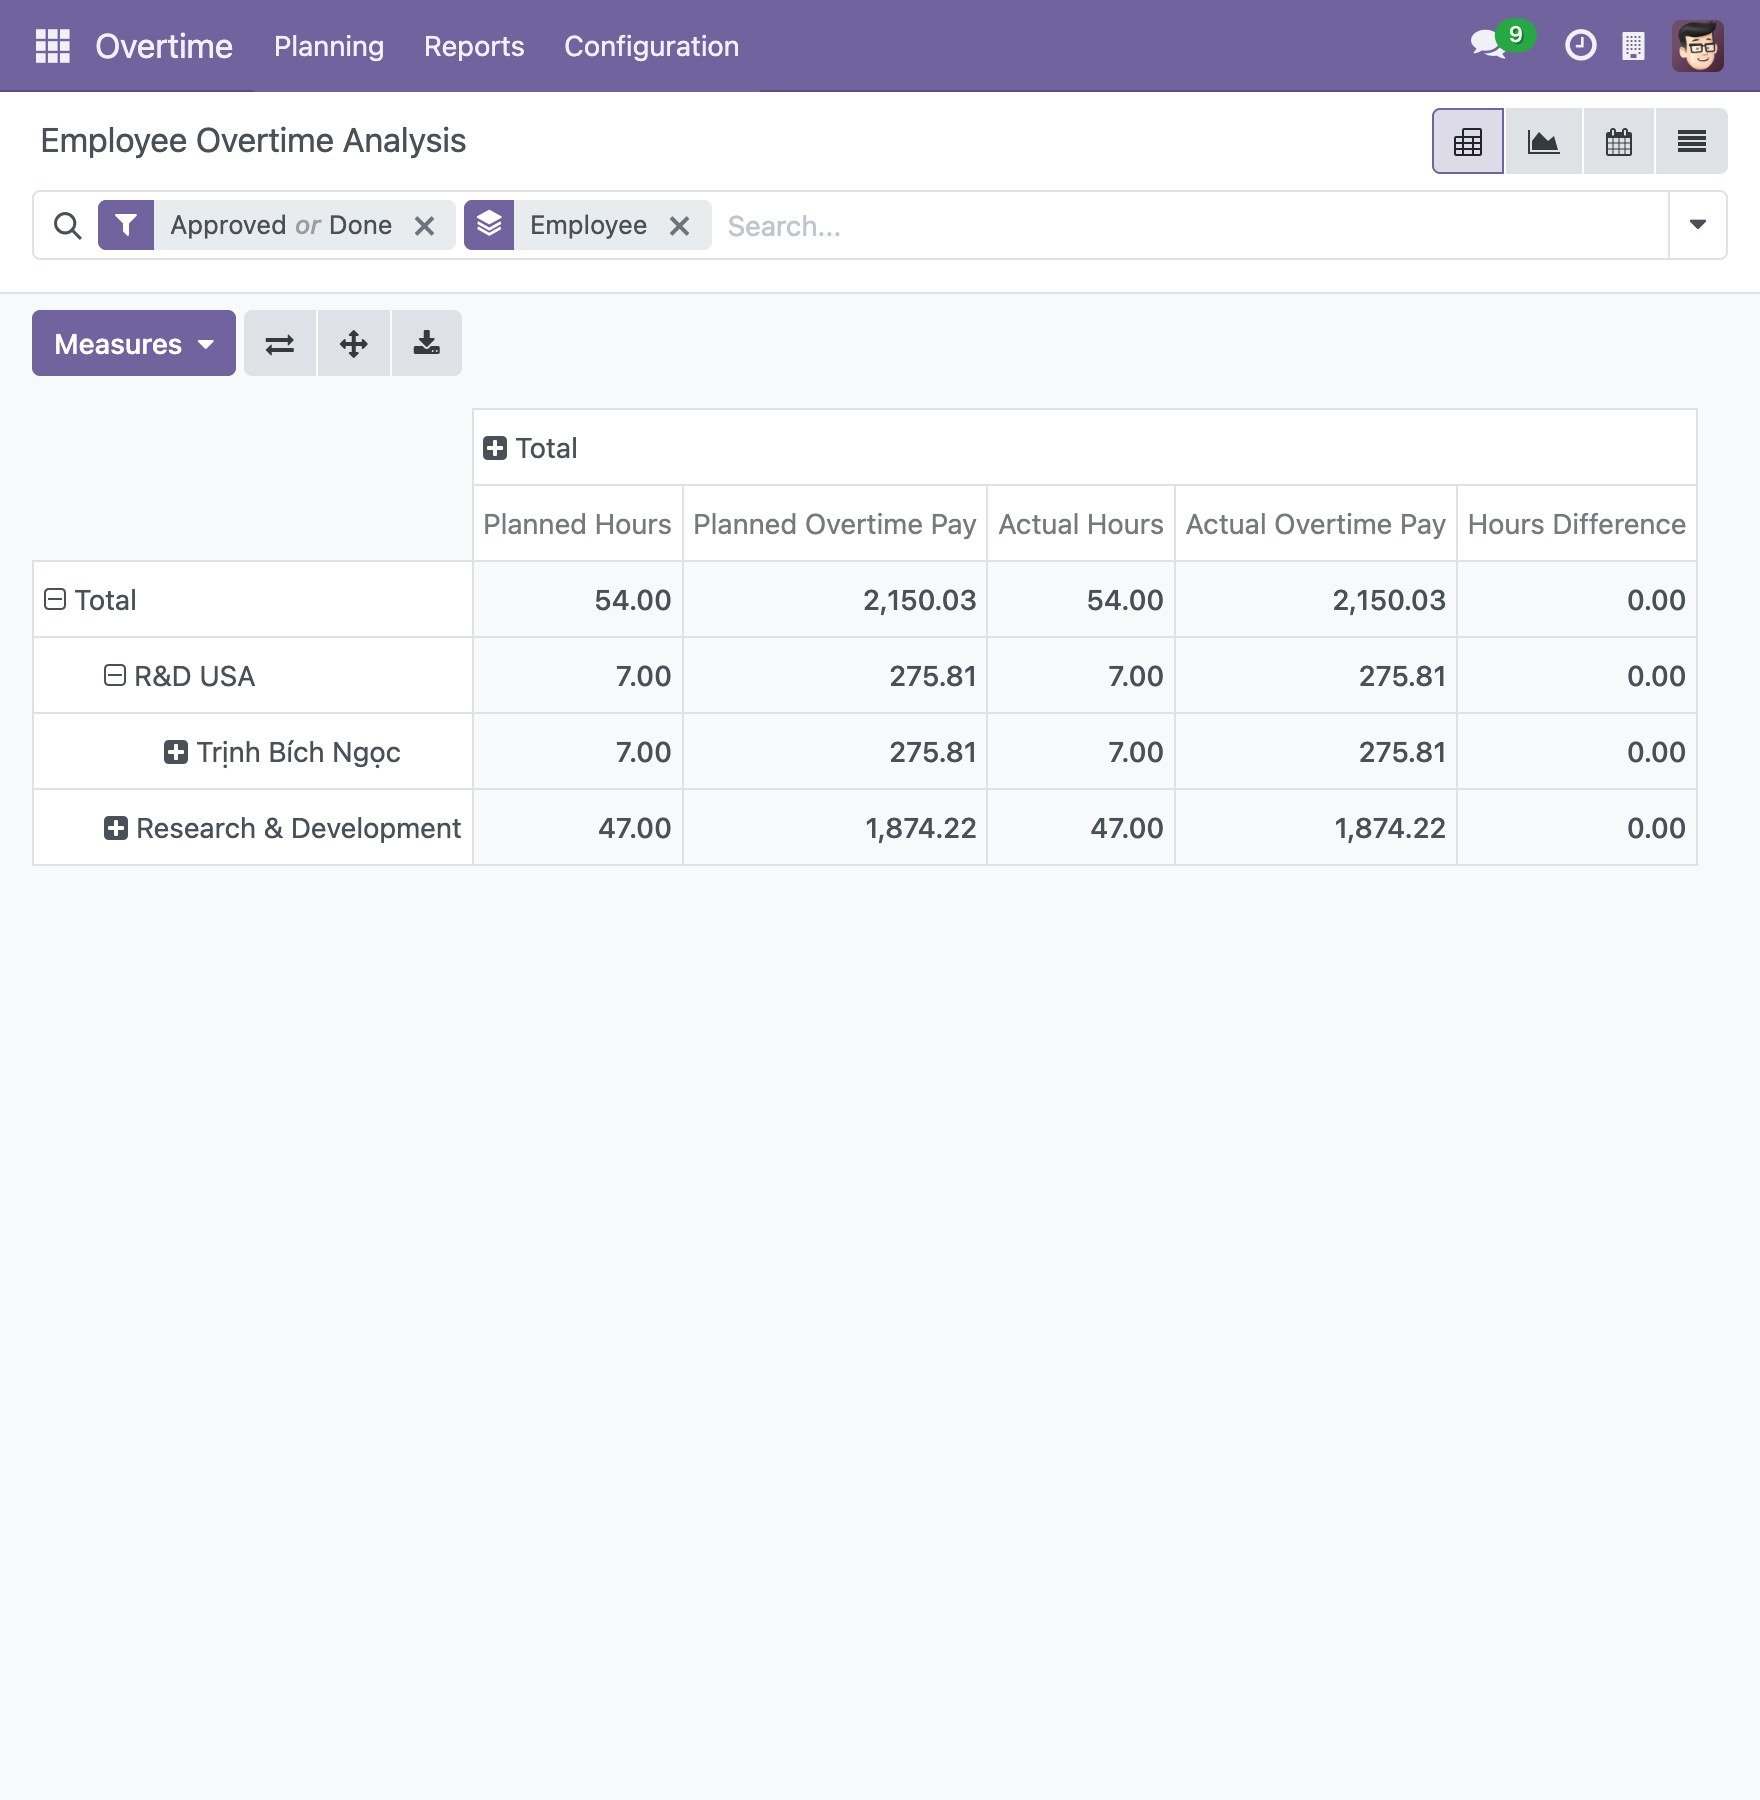
For example, group the rows by Department and then by Employee to compare the overtime of each department:
You can view the report directly on the software or export report to excel by clicking the Download xlsx button.
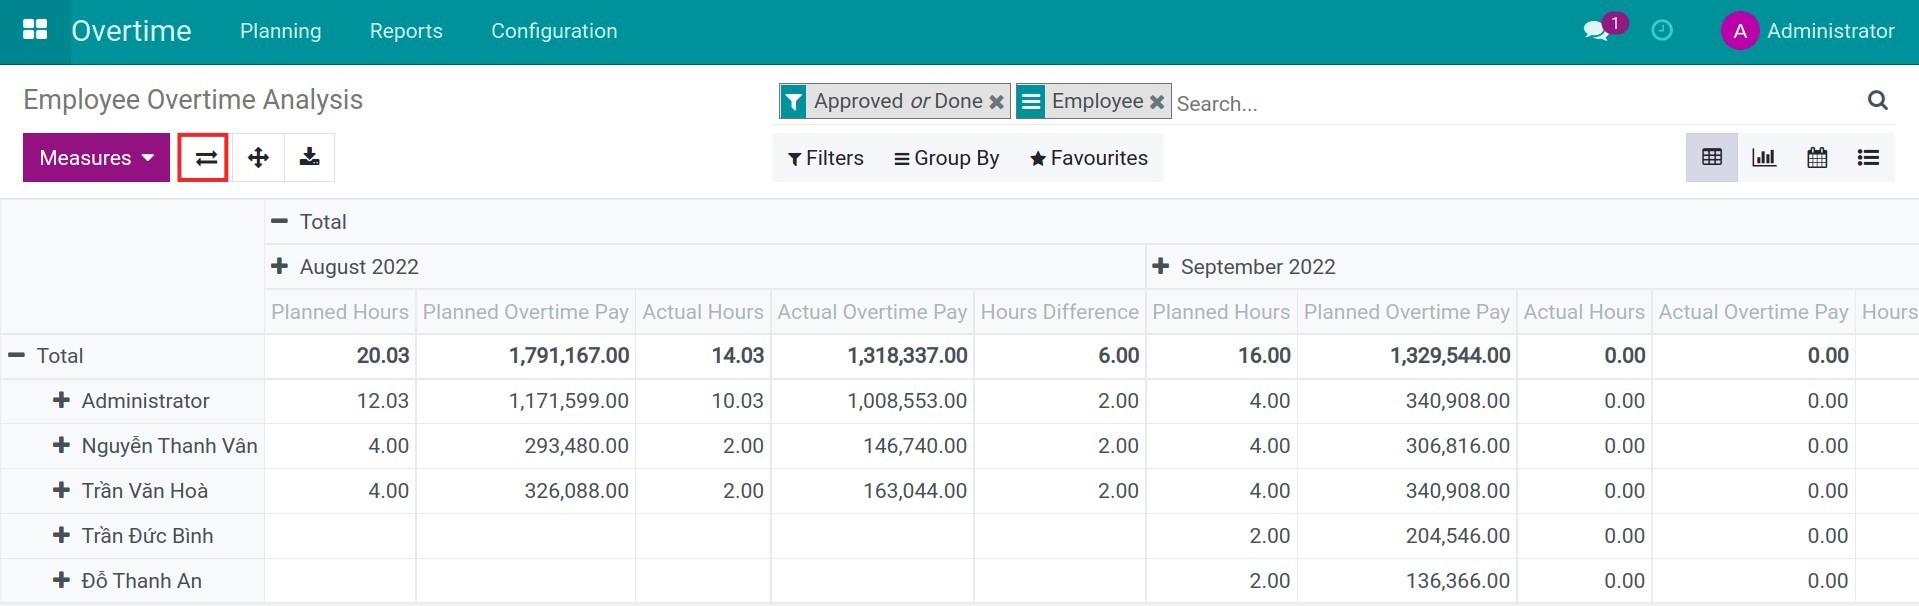
In addition, you can exchange all the criteria in columns and rows for each other with the Flip axis button.
View reports in Graph
To change to graph reports, you click on the corresponding icon. The system will display a bar chart by default.
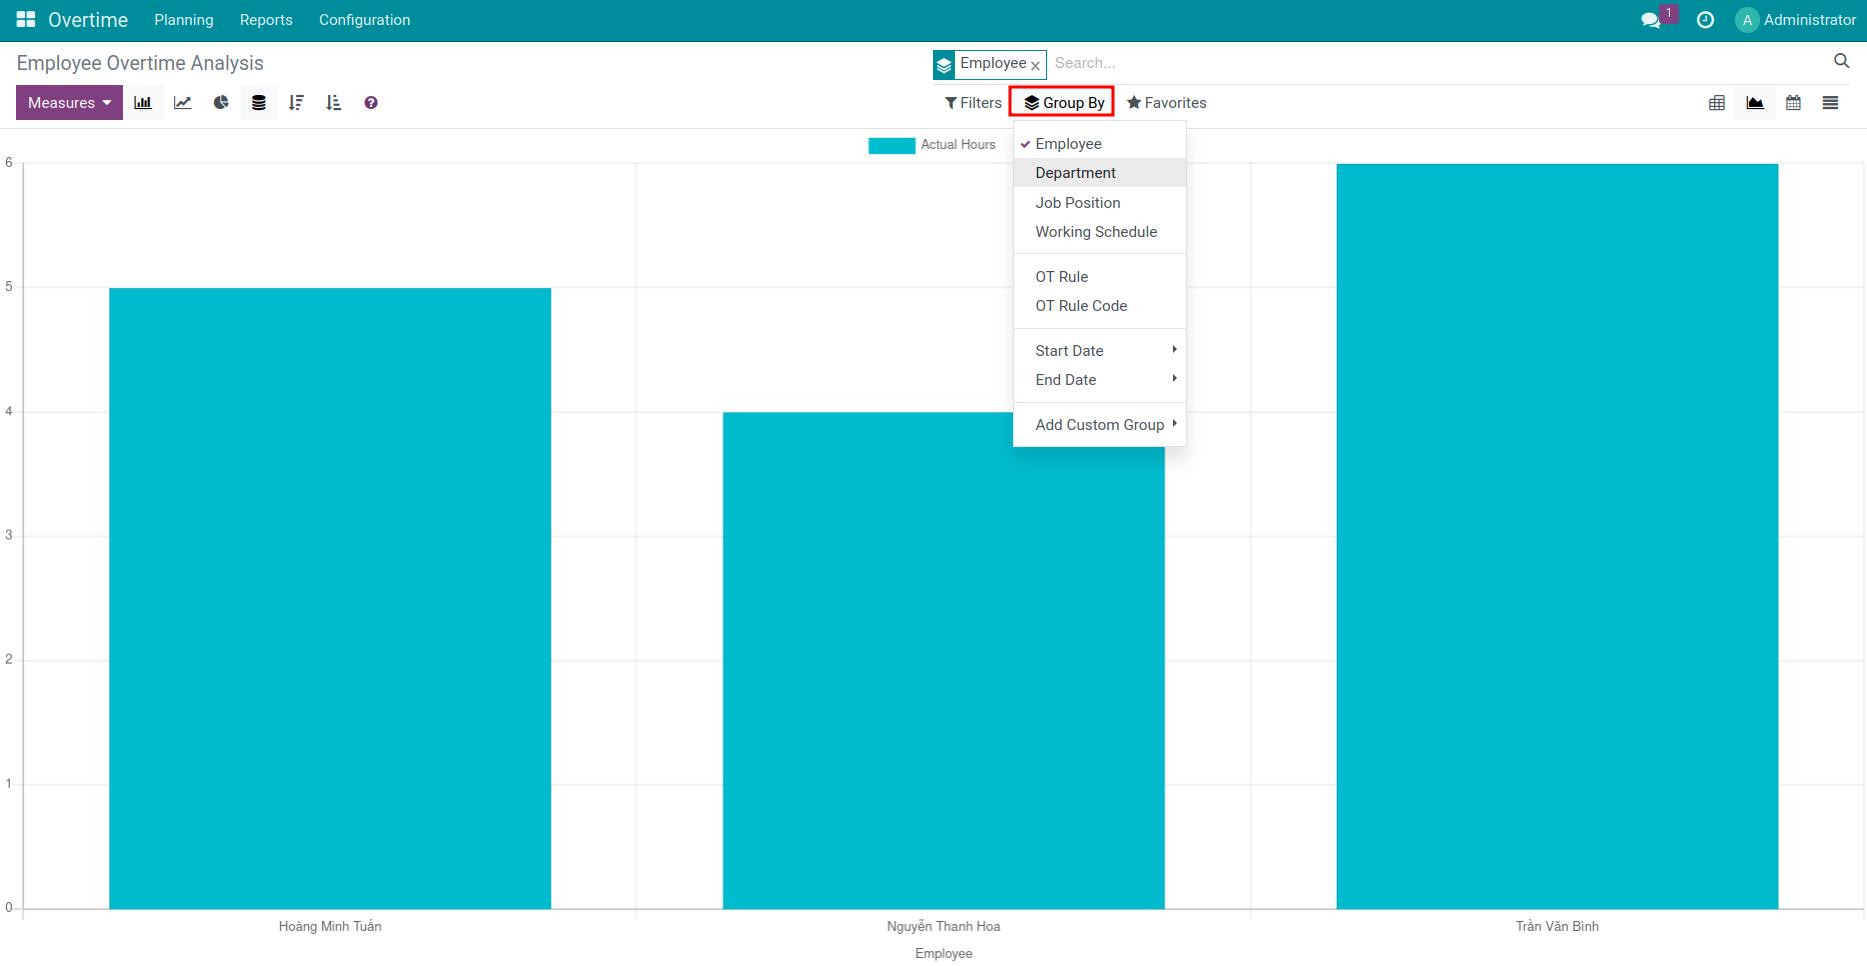
Vertical axis value: used as criteria in Measures. Unlike the pivot type, graph report only allow to select one criterion for display.
Horizontal axis value: display name of employees. In case you want to change the horizontal axis value, use the Group by. Based on the needs of the enterprise, the software proposes the group criteria by default such as by Department, Job Position, Working Schedule, OT Rule, OT Rule Code or Start Date/End Date. With Add Custom Group, you can add more criteria depending on the purpose.
The software supports different types of charts such as: bar chart, stacked bar chart, pie chart, line chart. You use corresponding icons to switch to other types. Or it is possible to arrange the horizontal axis values in ascending or descending order.

View reports in other types
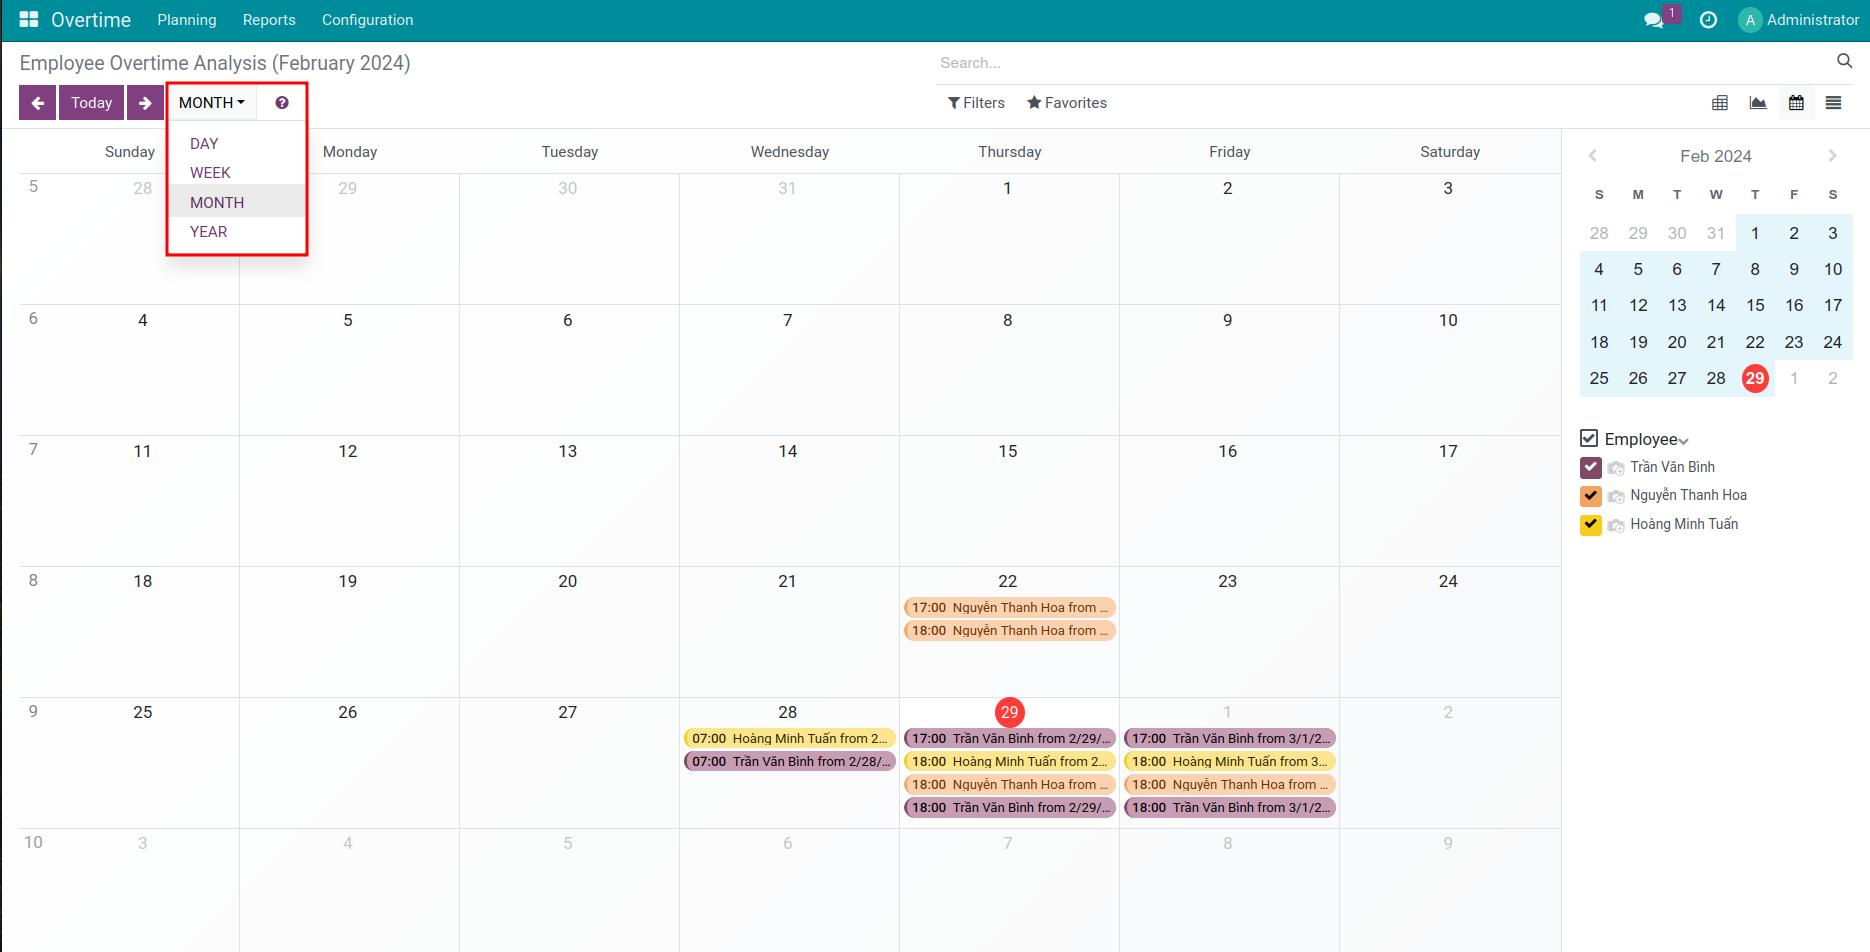
At view Calendar, you can look at the overtime plans of the entire employee in the form of a calendar, specifically by Day/Month/Year to see an overview of their overtime.
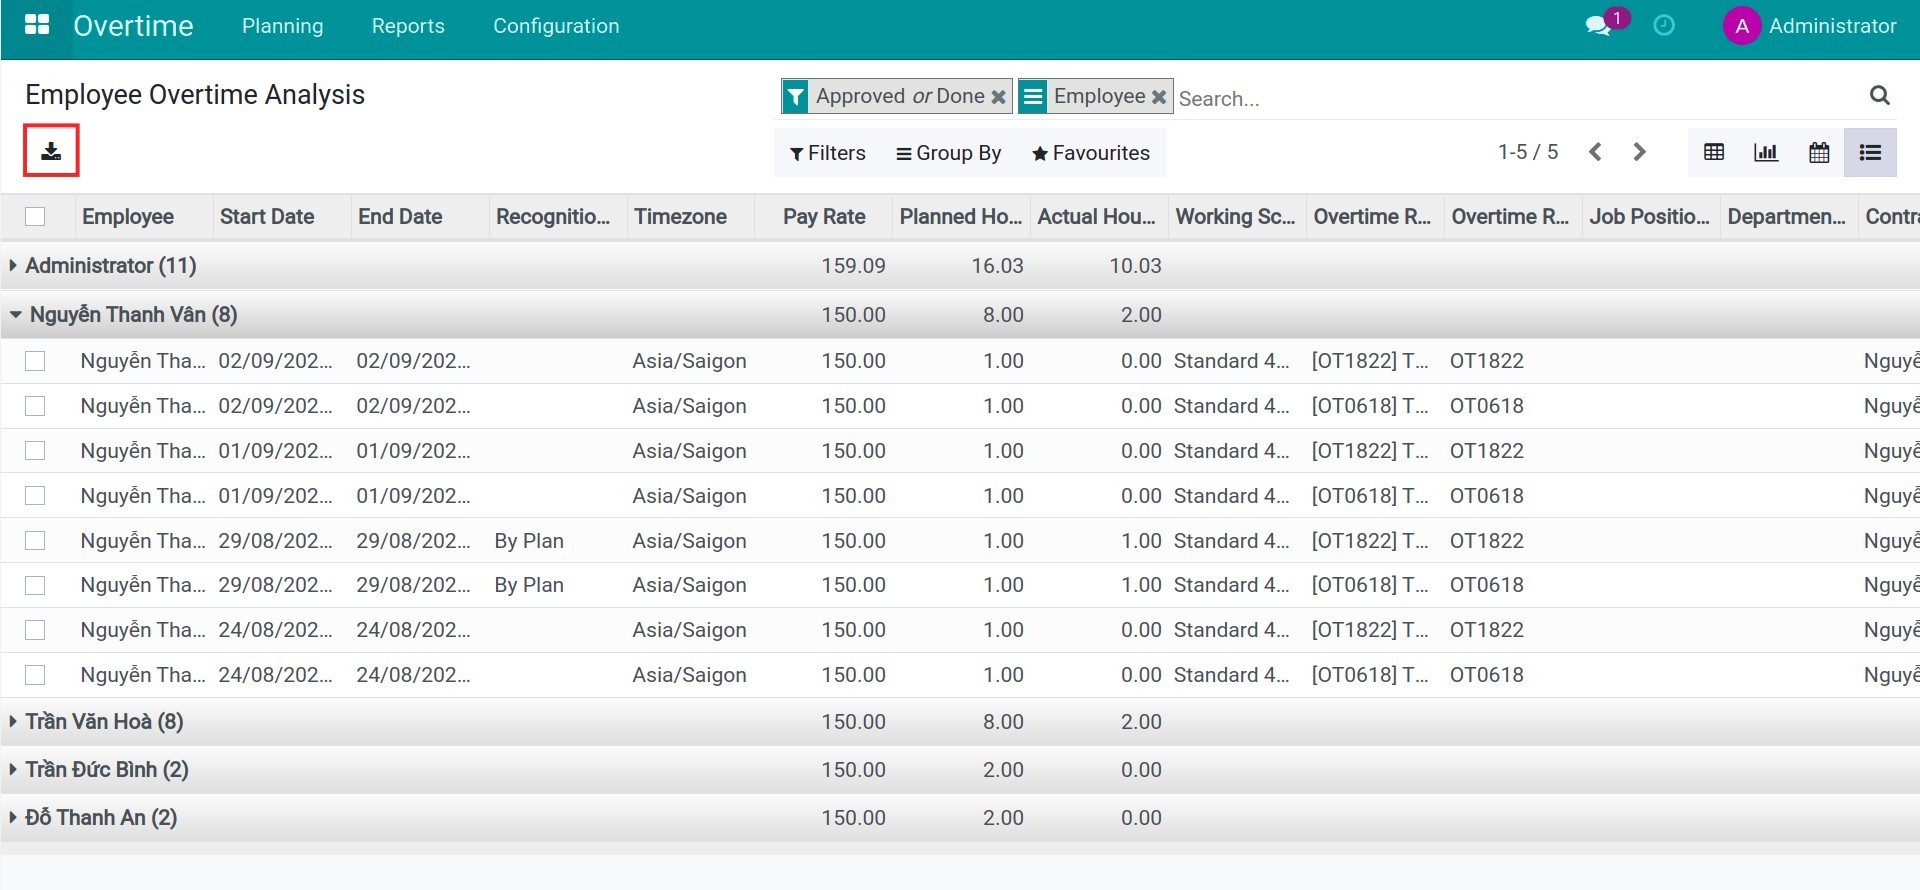
At view List, you use Filters and Group by to do custom reports according to your purpose. With this type, the software also supports export to excel.
See also
Related article
Optional module