Shipment Tracking Dashboard
Besides the two reports above, system also has special interface to track shipment update events in real-time.
Concept and Purpose
Event tracking dashboard is different from regular reports:
- Focus on Events Over Time
Instead of looking at overview of many shipments, you track each update event of a specific shipment: when cargo loaded, when vessel departed, when arrived…
- Visual Card Interface
Each event is a card with colors showing status (green = ok, yellow = at risk, red = late), helping you quickly recognize problems.
- Sidebar Displays Summary Information
Next to event list, sidebar displays shipment overview: profit, number of bookings, partner information…
- Real-Time Updates
When new event is created, dashboard automatically updates display.
Access Dashboard
There are two ways to enter dashboard:
Method 1: From Specific Shipment (recommended)
Open any shipment
Click Dashboard button or Progress tab on shipment form
System opens dashboard with events of that shipment
Method 2: From Main Menu
Go to Freight Forwarder > Operations > Shipment Tracking
List of all events of all shipments
Click an event, sidebar will display corresponding shipment information
Note
Dashboard works best when you view from a specific shipment, because then sidebar will display complete information of that shipment.
Understand Card Interface
Each event is displayed as a card with information:
- Event Title
Brief description of what event occurred. Example: “Cargo loaded”, “Vessel departed”, “Cargo arrived at port”, “Customs cleared”…
- Location
Where event occurred. Example: “Cat Lai Port, HCMC”, “On vessel MAERSK ESSEX”, “Long Beach Port, USA”…
- Time
Date and time event occurred. Displayed in readable format: “20/10/2024 14:30”
Status Colors
Green: On schedule, everything smooth
Yellow: At risk, danger of delay
Red: Already late compared to plan
Blue: On hold, waiting for processing
- Publication Icon
If you see eye or check mark icon, means this event has been published to customer portal, they can view it.
Card Actions
Click card to open and view details or edit
Click Create button to add new event
Use search box and filters to find specific event
Create New Update Event
From tracking dashboard, you can create new event very quickly:
Click Create button
Event creation form appears
Fill in information:
Template Title: Select from available list or enter custom
Event Time: When it occurred (cannot select future)
Location: Where
Details: Additional description
Status: On schedule, at risk, late, or on hold
Stage: Which stage is shipment at
Publish on Portal: Let customer see or not
Notify To: Select people who will receive email notification
Update Schedule if Changes
If event changes initial transport plan (example: vessel delay, ETD/ETA change):
Check Need to update transport plan
System displays additional fields to update:
Transport information: Route, mode, method
Vehicle details: Vessel/aircraft/vehicle name, voyage/flight number
Locations: Origin, POL, POD, destination
Schedule: ETD, ETA, ATD, ATA, Cutoff
Partners: Consignee, notify party, carrier, agent
When saved, this information will automatically update to shipment or corresponding transport leg
Warning
Important Note:
If shipment has multiple transport legs, you must select specific leg when checking “Need to update transport plan”. If not selected, system doesn’t know which leg to update.
Send Notifications Automatically
When creating new event:
If you select recipients and mark publish
System will automatically send email notification to them
Email contains event information and link for them to check shipment on customer portal
If need to resend, open event and click Send email button
Customize Reports
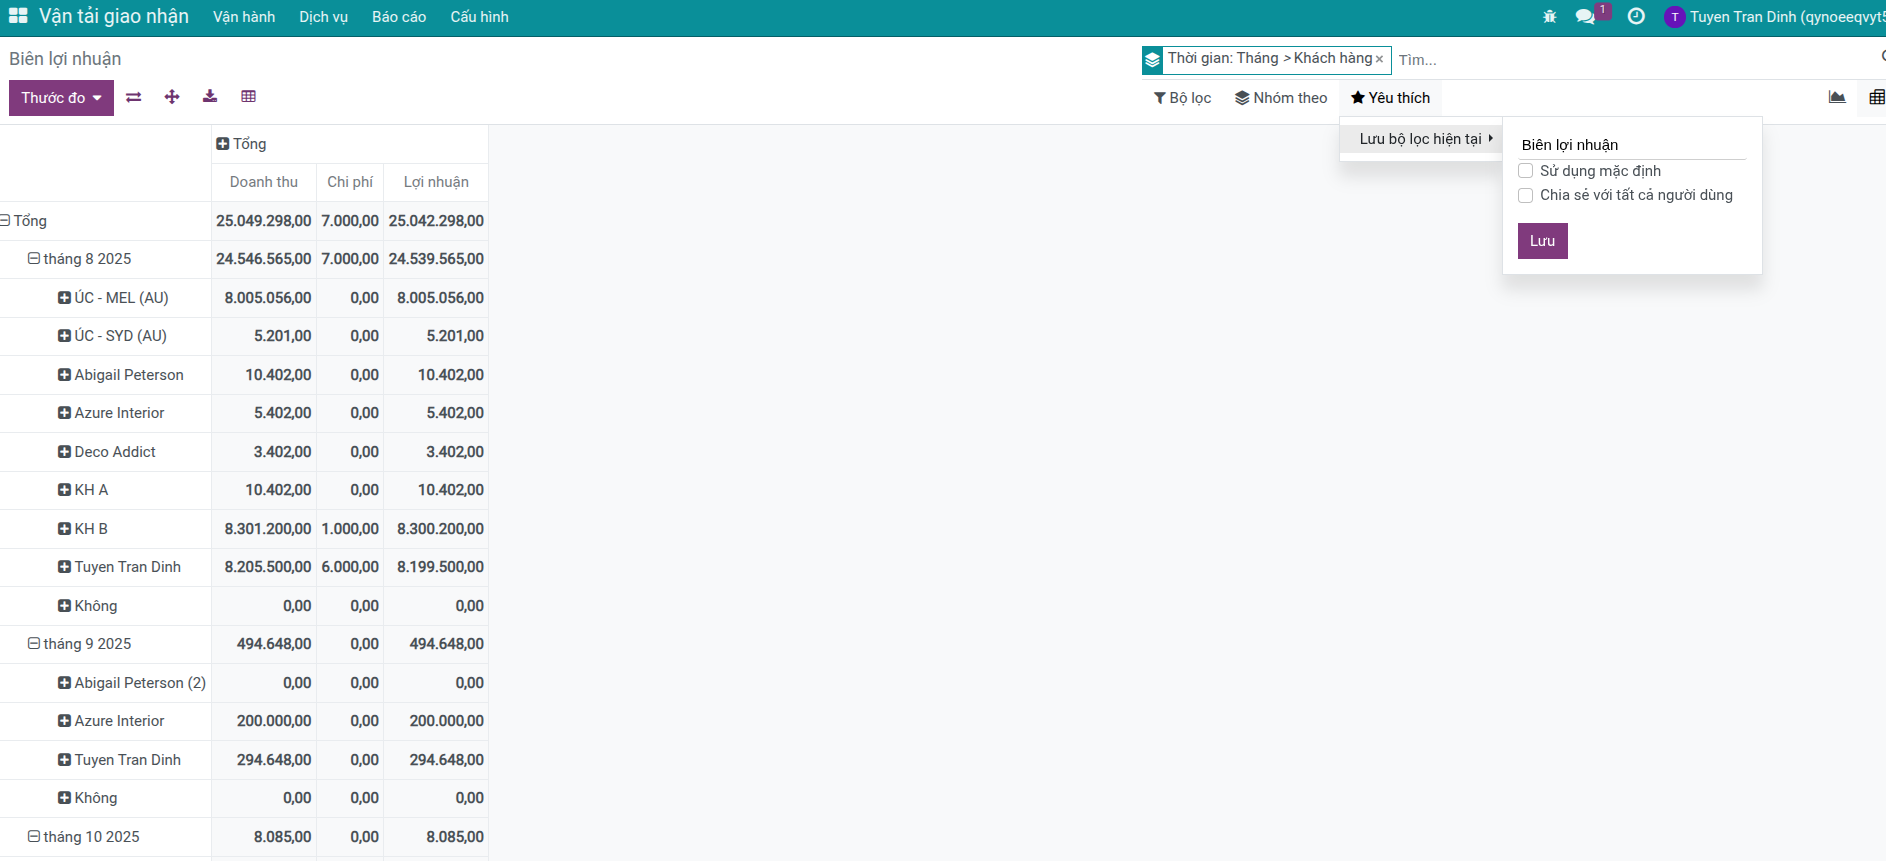
Save Frequently Used Filters
If you frequently view a fixed type of report (example: profit of customer A, or sea shipments this month), you can save it to not have to set up again each time:
Set up filters and groups as desired
Click Favorites > Save current search
Name the filter (example: “Customer A Profit”)
Select options:
Default filter: Set as default filter when opening report
Share with everyone: Allow colleagues to also use this filter
Use by default: Automatically apply when opening report
Save
Next time when opening report, you just click saved filter name instead of having to set up again.
Pivot Table Usage Tips
Pivot table is very powerful but many people don’t know how to use. Below are some tips:
- Add Measurement Metrics
Click empty cell in table, select metric to view (revenue, cost, profit…). Table will display corresponding data.
- Swap Row and Column Positions
Click row or column header, drag and drop to swap positions. This helps you view data from different angle.
- Download Excel Template
After setting up satisfactory pivot table, download to Excel to have template. Next time just open Excel file, new data will automatically fill into existing structure.
- Compare Time Periods
Use time filter to compare. Example: filter this quarter and last quarter, see which metrics increased, decreased.
Real Usage Scenarios
Below are specific examples of how to use reports in daily work:
Scenario 1: View Profit Trends by Month
Context: You are director, want to know company business trend over months, which month good, which month poor.
Steps:
Open Shipment Profitability Report
Switch to pivot table view mode
Click Group By > Creation Date > Select Month
Select metrics: Profit, Profit Margin
Sort by time from recent to far
Observe: Which month highest profit? Which month lowest? Is there increasing or decreasing trend?
Result: You clearly see which month business is good (may be due to peak season), which month weak (may be due to low season). From that have plan to prepare resources, advertise, or adjust prices.
Scenario 2: Evaluate Carrier
Context: Company is cooperating with many shipping lines. You want to know which line delivers on time to prioritize use, which line often delays to avoid.
Steps:
Open Shipment Overview Report
Switch to pivot table mode
Drag Carrier into Rows area
Drag Delivery Status into Columns area
Metric: Count - count number of transport legs
Add filter: Creation Date = last 3 months (for latest data)
Observe: Which line has many on-time deliveries? Which line has many late deliveries?
Calculate ratio: On-time deliveries / Total deliveries
Result: You have objective evaluation table of carriers. Example: Line A has 90% on-time delivery, Line B only has 60% → Should prioritize Line A.
Scenario 3: Find High-Profit Customers
Context: Sales department wants to know should focus on developing which customers, because resources are limited so need to prioritize customers bringing high profit.
Steps:
Open Shipment Profitability Report
Switch to pivot table mode
Drag Customer into Rows area
Select metrics: Revenue, Cost, Profit, Profit Margin
Add filter: Date = This year (to view current year data)
Sort by Profit from high to low
Export to Excel to analyze further and share with team
Result: You have customer list ranked by profit contribution level. Top 20% customers may account for 80% profit (according to Pareto principle). From that decide who should be taken care of more.
Scenario 4: Track Status by Route
Context: You manage many transport routes (Vietnam - USA, Vietnam - Europe, Vietnam - Australia…). Want to have quick overview board about situation of each route.
Steps:
Open Shipment Overview Report
Click Group By > Route
Then add Group By > Status
Switch between graph (to view visually) and pivot table (to view data)
Add filter to only view shipments in transit (skip completed ones)
Save as Favorite with name “Route Overview Board”
Result: You have board showing how many shipments each route has in transit, how many completed, how many delayed. Every morning open it and know situation immediately.
Ensure Data Accuracy
Reports are only good when input data is accurate. Below are points to note:
Setup Analytic Account
Each shipment must have separate analytic account to track costs. Usually system auto-creates when you create sales order, but need to check:
Open sales order
Tab Other Information > Find Analytic Account field
If empty, select or create new
Save order
Record Costs Correctly
When creating purchase order to buy services from carrier:
In each product/service line
Find Analytic Account field
Select analytic account of corresponding shipment
Confirm purchase order and post vendor invoice
If not doing this step, costs will not be recorded into shipment, report will be missing costs.
Update Status Timely
Status and delivery status are only accurate when you update regularly:
Create tracking event timely when have new information
Update ATD (actual departure time) when cargo departs
Update ATA (actual arrival time) when cargo arrives
If not updating, report will always display “In Transit” even though cargo already arrived.
Unify Currency Units
If company works with multiple currencies (VND, USD, EUR…), ensure:
Exchange rates are periodically updated in system
Transactions use correct currency
When exporting report, select correct currency to view
Tip
Tip to maintain data quality:
Request IT department to setup automatic alerts for:
Shipment without analytic account
Purchase orders related to shipment but no analytic account
Completed shipments but still have not-yet-invoiced amounts
Alerts help detect and fix errors early, avoid affecting reports.
Common Troubleshooting
No Costs in Report
Symptom: Profitability report displays revenue but costs are 0, leading to profit equal to revenue (wrong).
Causes and Solutions:
Shipment has no analytic account
Check: Open sales order > Tab Other Information > View Analytic Account field
Fix: Select or create new analytic account, then re-link purchase orders to this account.
Purchase order not linked to analytic account
Check: Open purchase order > View each product line > Find Analytic Account field
Fix: Add corresponding analytic account to each line, then update vendor invoice.
Vendor invoice not yet posted
Check: View invoice status, if still in draft status then cost not yet recorded.
Fix: Post vendor invoice so cost is recorded into analytic account.
Delivery Status Always “In Transit”
Symptom: Although cargo already arrived but report still displays “In Transit” instead of “On Time” or “Late”.
Cause: Haven’t updated actual arrival time (ATA).
Solution:
Open shipment
Create new update event
Check “Need to update transport plan”
Fill in actual arrival time (ATA)
Save
System will automatically compare ATA with ETA to determine early, on time, or late delivery.
Profit Margin Displays Incorrectly
Symptom: Profit margin displays too high (near 100%) or too low (negative).
Causes:
Missing costs (see “No Costs” section above)
Missing revenue (order not yet confirmed or no products/services)
Wrong currency (revenue calculated in USD but costs in VND for example)
Solutions:
Check sales order: Confirmed? Has products/services?
Check purchase orders: Linked to analytic account? Posted invoice?
Check currency: Sales and purchase orders have same currency?
After fixing, return to report and reload (F5)
Frequently Asked Questions
Can custom reports be created?
For basic needs, you can use pivot table combined with filters and grouping to create different reports, then save as Favorite.
For more complex needs (example: special report with custom calculation formulas), need to request IT department support to create new report.
How to export report automatically weekly?
Currently need to request IT department to setup automation to send periodic report emails. They will configure system to send report at fixed time (example: 8am Monday weekly).
What does negative profit margin mean?
Negative profit margin means costs are higher than revenue, meaning shipment is losing money. Need to review:
Is selling price too low? Can customer bargained too much?
Are costs incurred outside of expected? May be due to additional unexpected fees?
Need to adjust pricing strategy for similar shipments in future
If loss is due to specifics (example: trial shipment with new customer), then acceptable. But if frequently losing then need to review quotation process.
Why are revenue and invoiced amount different?
This is normal:
Revenue: Total value of services in sales order (everything customer must pay)
Invoiced: Only part already invoiced to customer (part customer already requested to pay)
Difference: Part not yet invoiced
Reasons for difference:
Service not yet complete (example: cargo just arrived at port, not yet delivered to customer warehouse)
Not yet invoice due date according to agreement
Waiting for customer confirmation before issuing invoice
Can dashboard be viewed on phone?
Can view but experience not as good as computer:
Card interface still viewable
But sidebar may be hidden on small screen
Some information truncated
Recommendation: Use tablet or computer for best experience. If using phone, rotate screen horizontally or switch to list view instead of card.
Does report data update in real-time?
Yes, report data updates in real-time. When there are:
New orders created
New shipments created
New costs recorded
New invoices issued
Report will automatically reflect immediately. You just need to reload page (F5) to see latest data.
Can reports be compared between two time periods?
Yes. Simplest way:
Export report of first time period to Excel
Export report of second time period to Excel
Use Excel to compare and calculate differences
Or more advanced, request IT to create automatic comparison report.