Shipment Overview Report
This report concentrates on operations: it tracks the progress of each transport leg and evaluates the partners responsible for the work.
Access Report
Go to Freight Forwarder > Reports > Shipment Overview Report.
The report opens in graph mode by default.
Switch to the pivot table when you need full detail.
Information in Report
Data is structured by transport leg.
Transport Leg Information
Leg Code – Identifier of the transport leg.
Shipment – Shipment that the leg belongs to.
Route – Base route selected.
Loading Method – FCL, LCL, or bulk cargo.
Transport Mode – Sea, Air, or Land.
Schedule Information
ETD – Planned departure time.
ETA – Planned arrival time.
ATD – Actual departure time.
ATA – Actual arrival time.
Creation Date – When the leg record was created.
Partners and Personnel
Customer – Service buyer.
Carrier – Company executing the transport leg.
Agent – Supporting agent (if any).
Responsible – Staff member managing the shipment.
Salesperson – Person responsible for the sale.
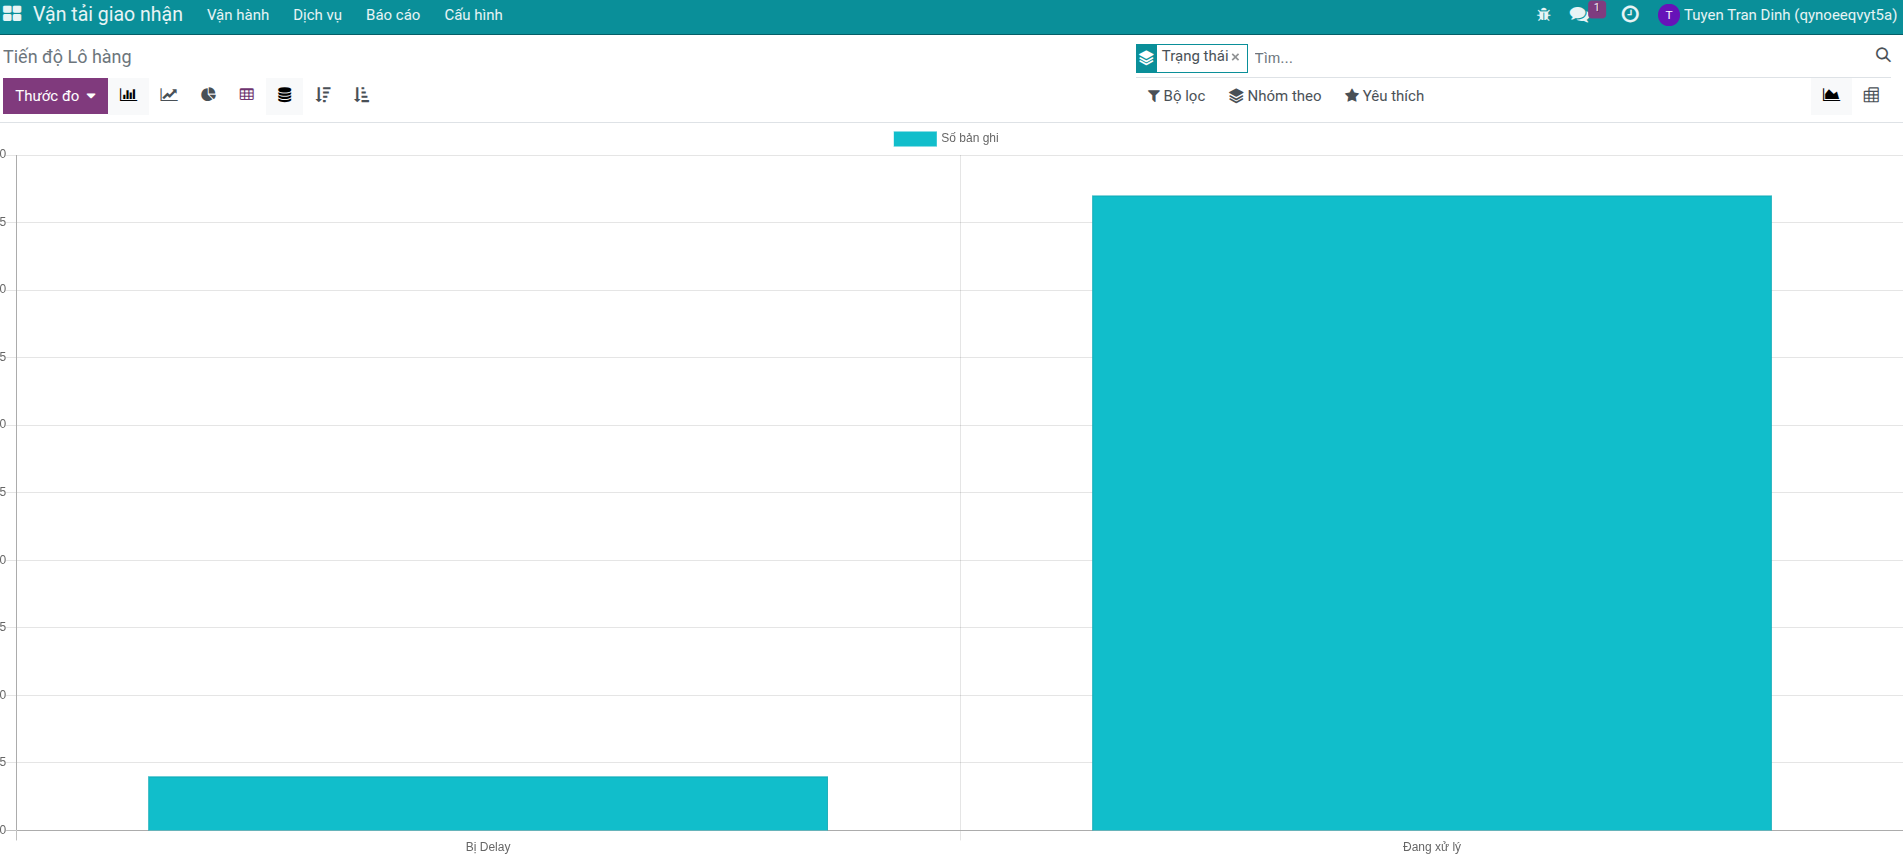
Status
General Status – In progress, completed, or delayed.
Delivery Status – Early, on time, late, or in transit.
Filter and Group Data
Filters and groupings mirror the profitability report but focus on operational insights.
Quick Filters
Last 7 days, This month, This year – filter by transport-leg creation time.
Important Grouping Methods
By Shipment – Gather every leg of a shipment together.
By Transport Leg – Review individual leg details.
By Route – Compare legs running the same route.
By Carrier – Evaluate the reliability of transport providers.
By Agent – Measure performance by agents.
By Customer – Examine workloads per customer.
By Status – In progress, completed, delayed.
By Delivery Status – Early, on time, late.
By ETD/ETA/ATD/ATA – Analyse by schedule milestones.
Tip
Evaluate carrier reliability
Switch to pivot table mode.
Drag Carrier to Rows.
Drag Delivery Status to Columns.
Use Count as the measure.
The table shows how often each carrier delivers early, on time, or late.