Shipment Profitability Report
This report helps you clearly understand the financial effectiveness of each shipment: how much you sold, how much you spent, and the resulting profit.
Why Need This Report?
In freight forwarding, not every shipment yields the same margin. Use this report to:
- Detect Losing Shipments
Spot shipments where costs exceed revenue so you can investigate low quotes, unexpected charges, or partner issues.
- Identify Valuable Customers
Highlight customers that consistently deliver strong margins and those that erode profit.
- Compare Efficiency by Route
See which routes remain profitable and which should be repriced or reduced.
- Analyze Trends Over Time
Understand seasonal peaks and troughs to plan staffing, cash flow, and marketing.
- Track Receivables
Know how much has been invoiced and what remains pending to stay ahead of cash flow needs.
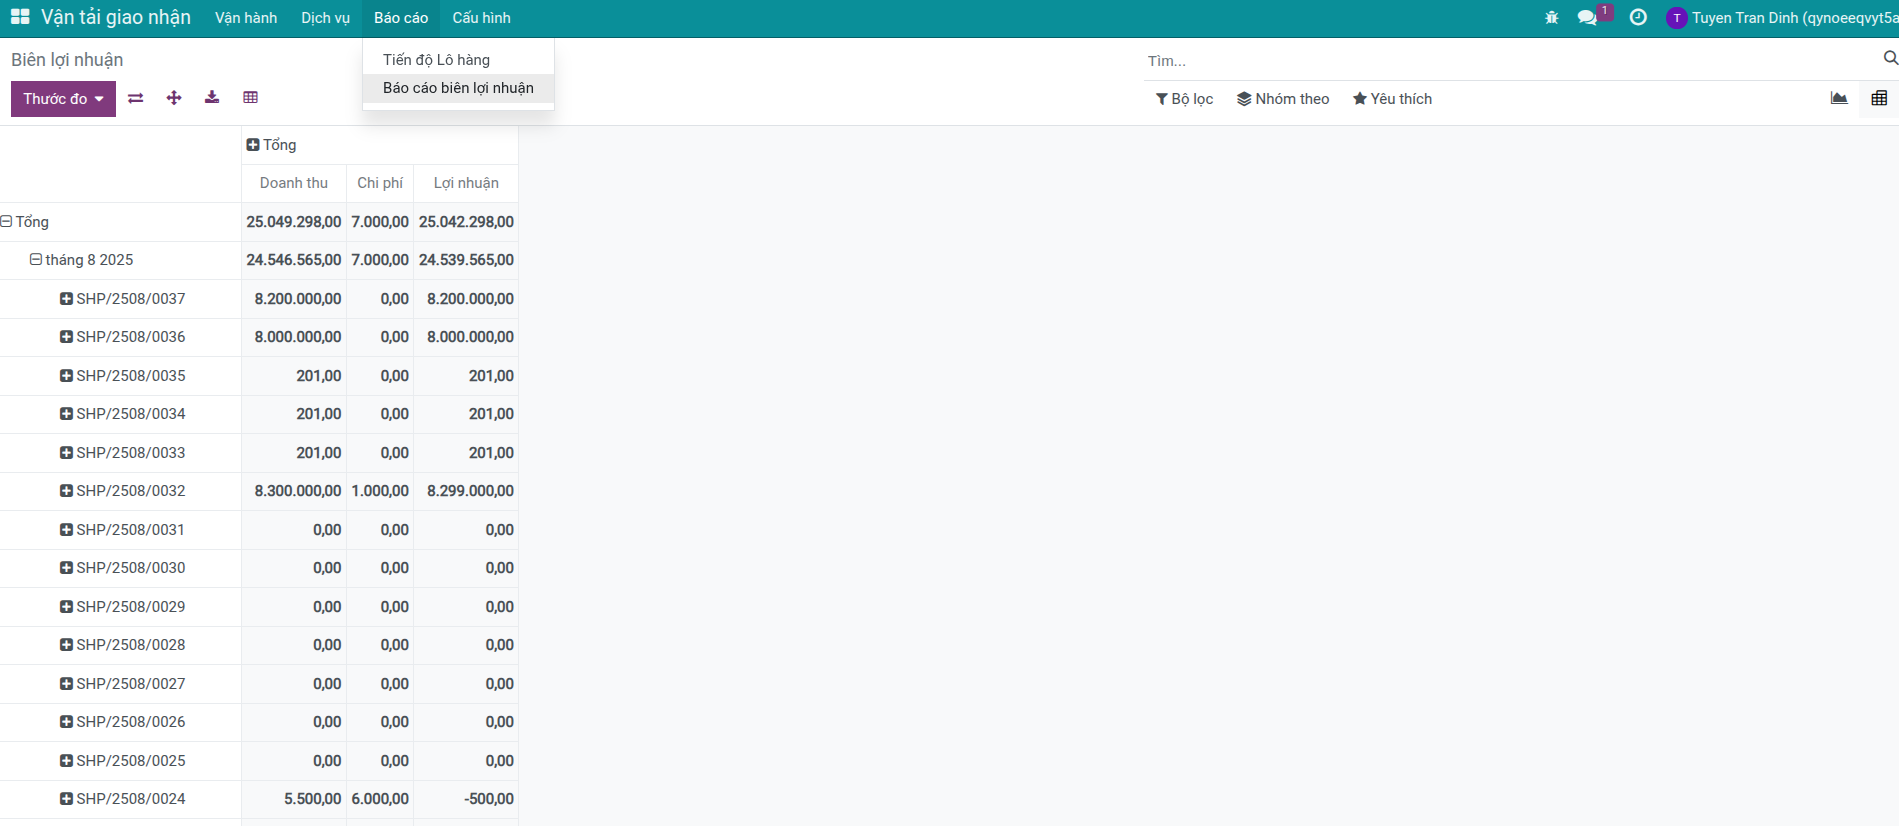
Access Report
Go to Freight Forwarder > Reports > Shipment Profitability Report.
The report opens in graph mode by default.
Switch to the pivot table for granular analysis with the toggle button.
Note
Calculations are per shipment. For leg-by-leg tracking, use the Shipment Overview Report.
Information in Report
The report presents comprehensive shipment and financial data.
Basic Shipment Information
Shipment Code – Unique identifier of the shipment.
Route – Transport route selected.
Creation Date – Date the shipment was created.
Loading Method – FCL, LCL, or bulk cargo.
Transport Mode – Sea, Air, Land, or Multi-modal.
Status – In progress, completed, or delayed.
Delivery Status – Early, on time, late, or in transit.
Partner Information
Customer – Service buyer.
Shipper – Party delivering the cargo.
Consignee – Party receiving the cargo.
Salesperson – Person responsible for the sale.
Responsible – Person managing the shipment.
Important Financial Metrics
Revenue – Untaxed – Service value excluding VAT.
Total – Incl. Tax – Amount including tax, i.e. final receivable.
Invoiced – Amount already invoiced to the customer.
Not Yet Invoiced – Balance remaining to invoice.
Cost – Total costs incurred (freight, customs fees, handling, etc.).
Profit – Revenue minus costs.
Profit Margin % – Profit as a percentage of revenue.
Warning
Getting costs right matters
Ensure each shipment has its own analytic account (auto-created by default).
Link purchase orders to the correct analytic account.
Record additional costs against the correct analytic account.
If costs are missing or misallocated, profit and margin will be inaccurate.
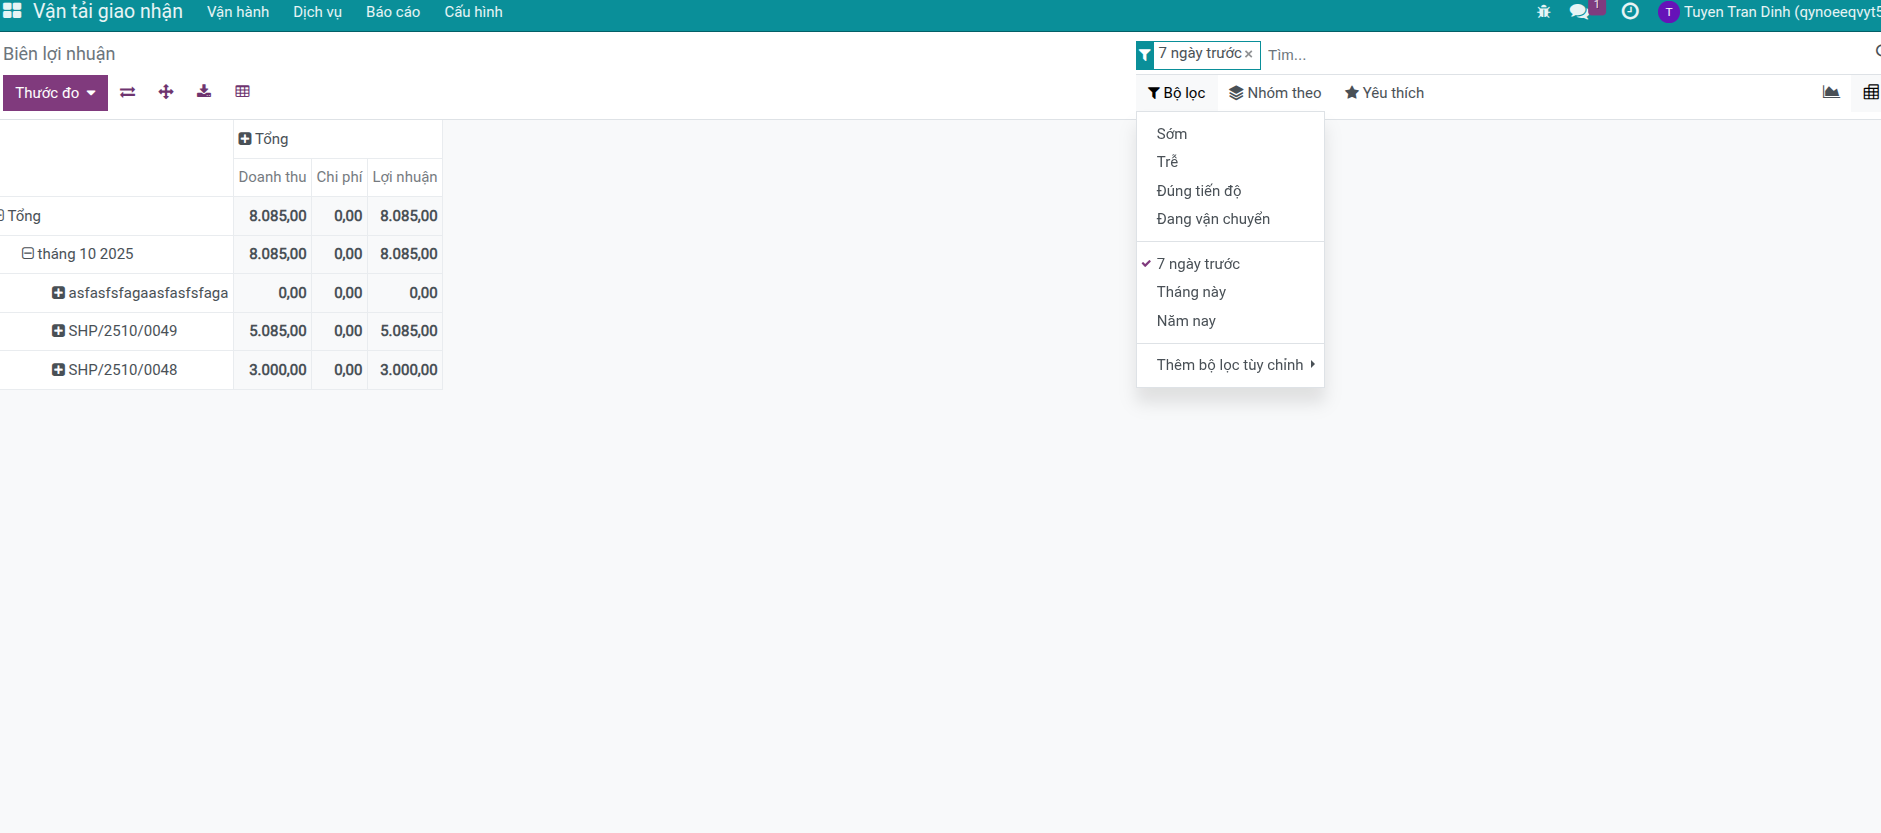
Filter and Search Data
Use the built-in filters to analyse data quickly.
Available Quick Filters
Last 7 days – Shipments created in the last week.
This month – Shipments of the current month.
This year – Shipments of the current year.
Combine quick filters with your own conditions (customer, route, status, etc.) for tailored views.
Group Data for Analysis
Click Group By to slice the data by:
Shipment
Route
Customer
Shipper / Consignee
Salesperson
Responsible
Status
Delivery Status
Transport Mode
Time (day, week, month, quarter, year)
Tip
Trend analysis
Switch to the pivot table.
Group by Creation Date (Month).
Add measures: Profit and Profit Margin.
Compare which months perform best or need attention.
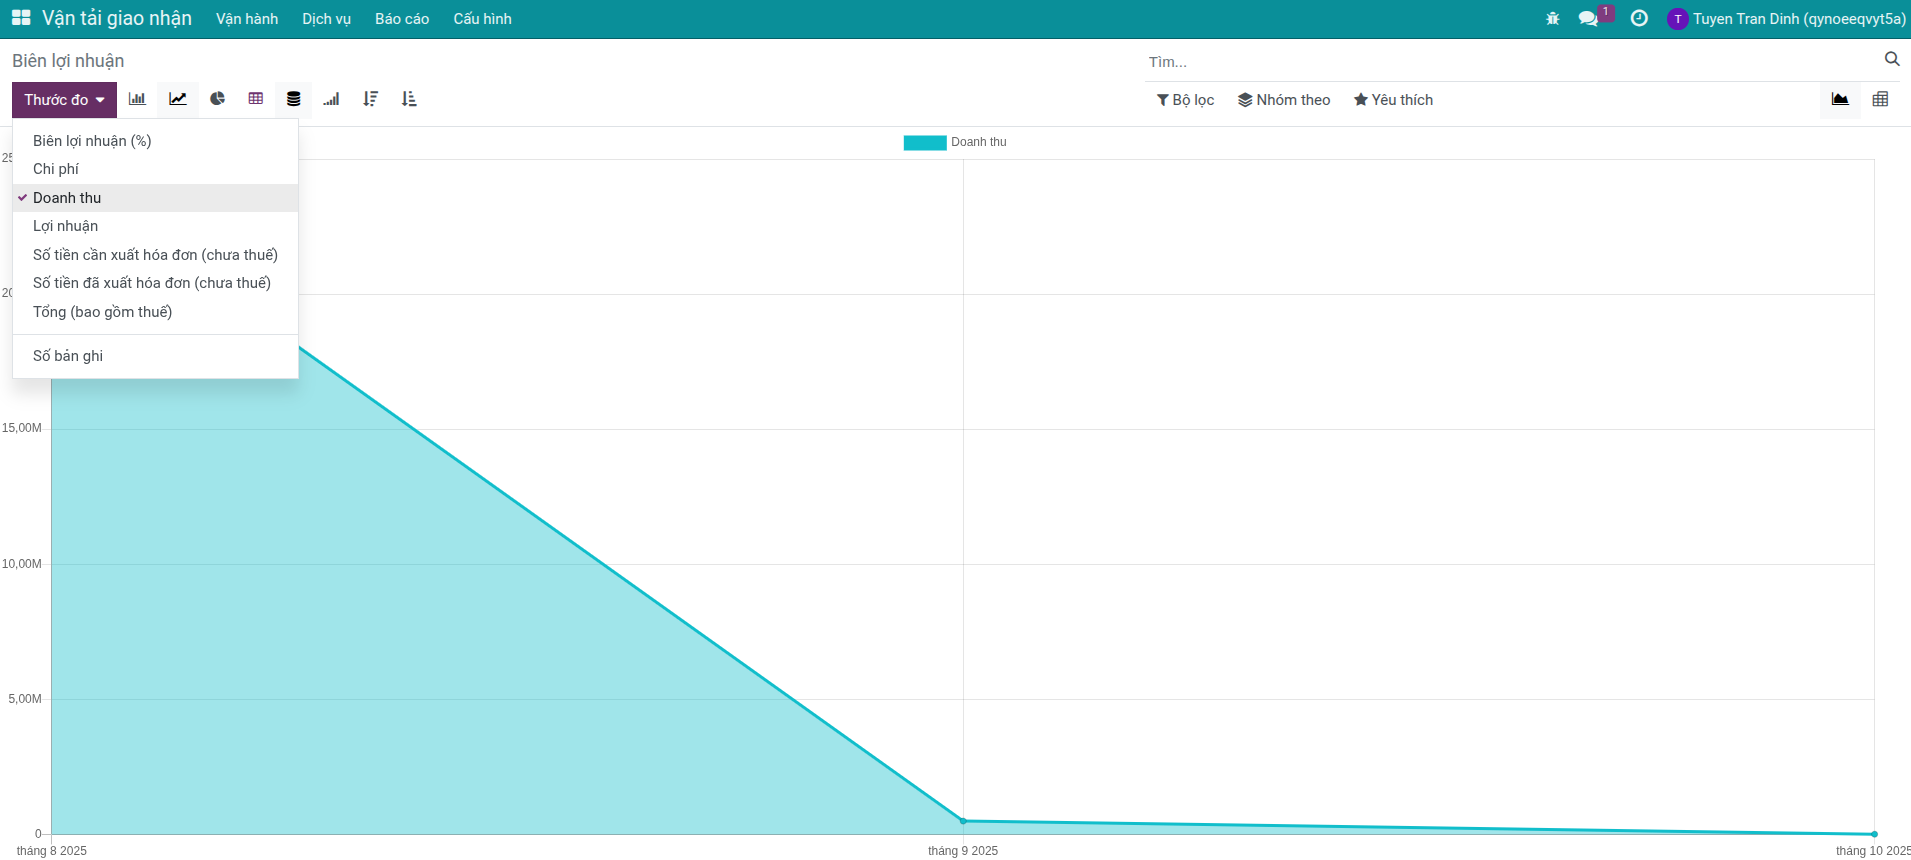
Graph View Mode
Graph mode makes it easy to spot trends visually.
Bar Chart – Compare values across customers, routes, or teams.
Line Chart – Track performance over time.
Pie Chart – Understand composition (e.g., revenue share by customer).
Switch chart types using the toolbar icons.
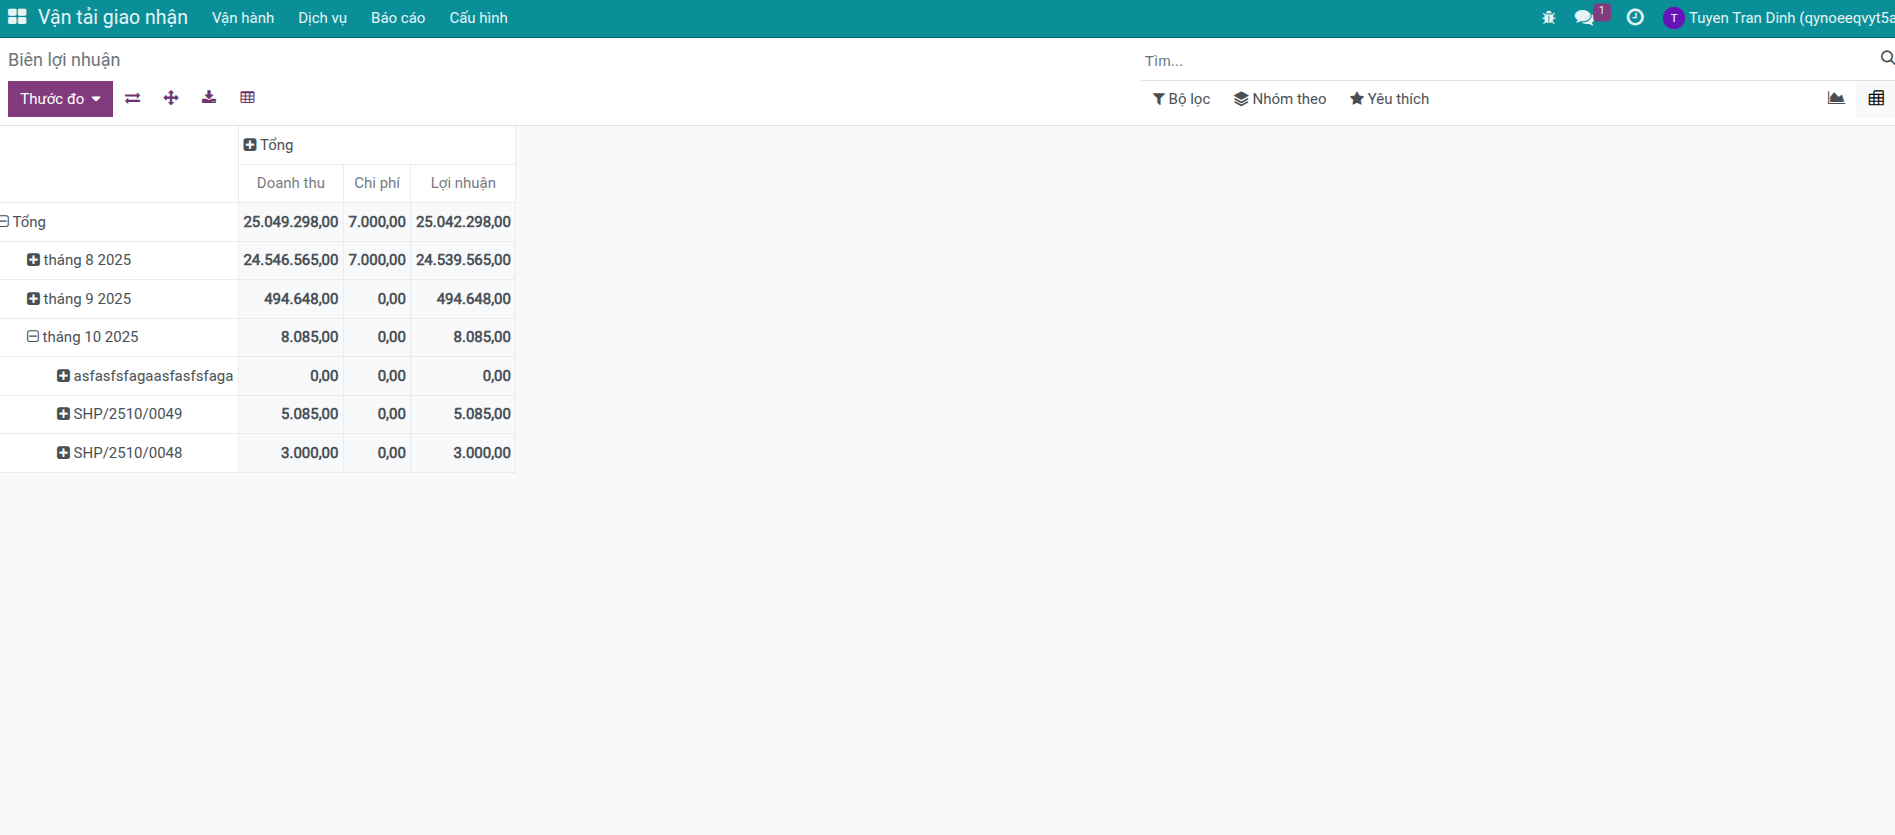
Pivot Table View Mode
Use pivot tables for multi-dimensional analysis:
Drag and drop fields into Rows or Columns.
Expand or collapse groups with the + / – icons.
Let the system compute subtotals and totals automatically.
Example: Profit by Customer per Month
Drag Customer to Rows.
Drag Creation Date (Month) to Columns.
Select Profit as the measure.
Export Report Data
Share insights or continue analysis outside the system:
- Export to Excel
Click the download button.
Choose Excel format.
Open the file in Excel or Google Sheets.
- Export to PDF
Use the browser print dialog (Ctrl+P or Cmd+P).
Select Save as PDF.
Download the file.
- Export Selected Data
Switch to list view.
Select the rows you need.
Click Actions ▸ Export.
Choose the fields to include.
Download as CSV or Excel.