Subscription Analysis Report
As a business manager, you can track:
Monthly Recurring Revenue;
Annually Recurring Revenue;
Revenue Churn Rate;
Revenue Retention Rate.
This helps you evaluate business performance more intuitively, forecast future revenue and make appropriate adjustment plans.
Note
To be able to view these reports, you need to have the Sales/Administrator.
Requirements
This tutorial requires the installation of the following applications/modules:
Monthly Recurring Revenue (MRR) Report
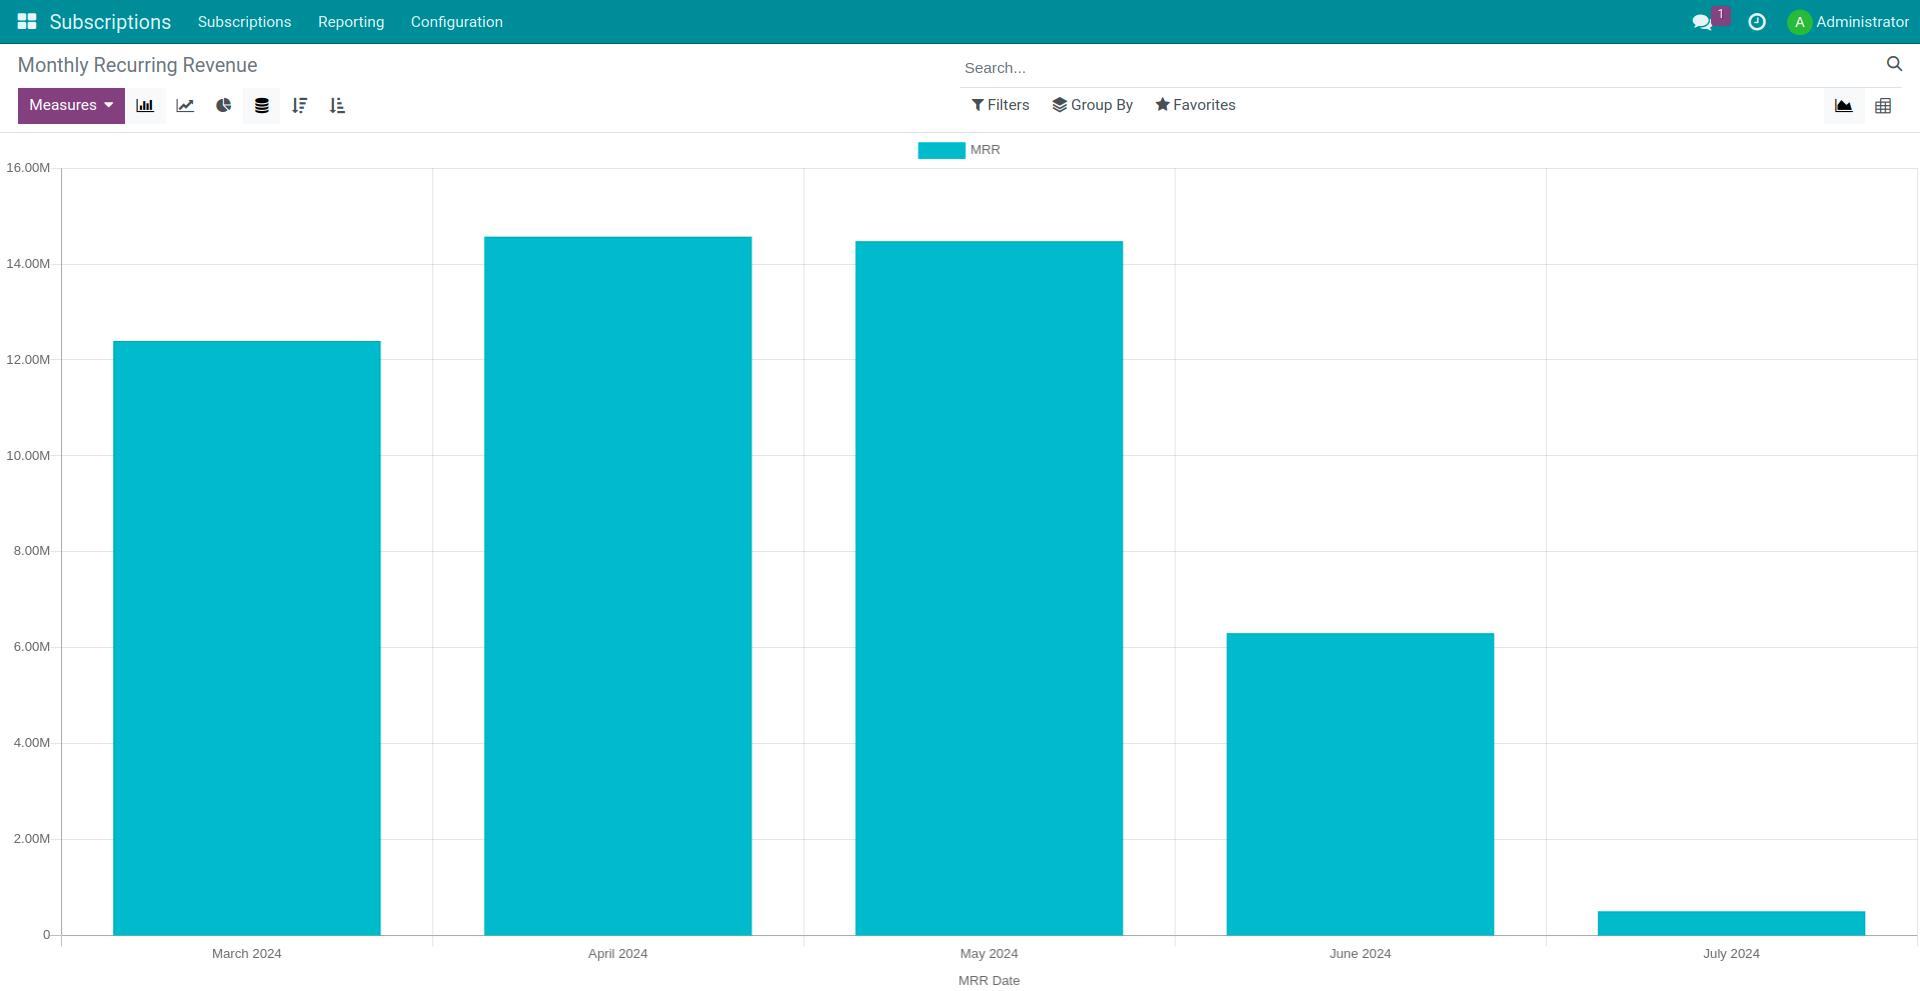
The Monthly Recurring Revenue (MRR) report is one of the most important operational metrics for businesses that offer subscription-based services or products. To view the report, you can access Subscriptions > Reporting > MRR. You can view the report in graph view or pivot view.
You can select the criteria on the measurement to view:
Monthly Recurring Revenue
MRR = New Biz + Expansion + Reactivation - Contraction - Churn;
New Biz MRR: The revenue from newly subscription orders;
Reactivation MRR: The revenue from subscriptions that customers renew after a period to continue using the service. However, please note that the reactivation MRR figures for current month will be displayed in the next month report;
Expansion MRR: The revenue that customers upgraded their subscriptions or purchased additional services from existing orders;
Contraction MRR: The value of orders that customers downgraded their subscriptions or removed services from existing orders;
Churn MRR: The value of orders that customers cancelled and churned.
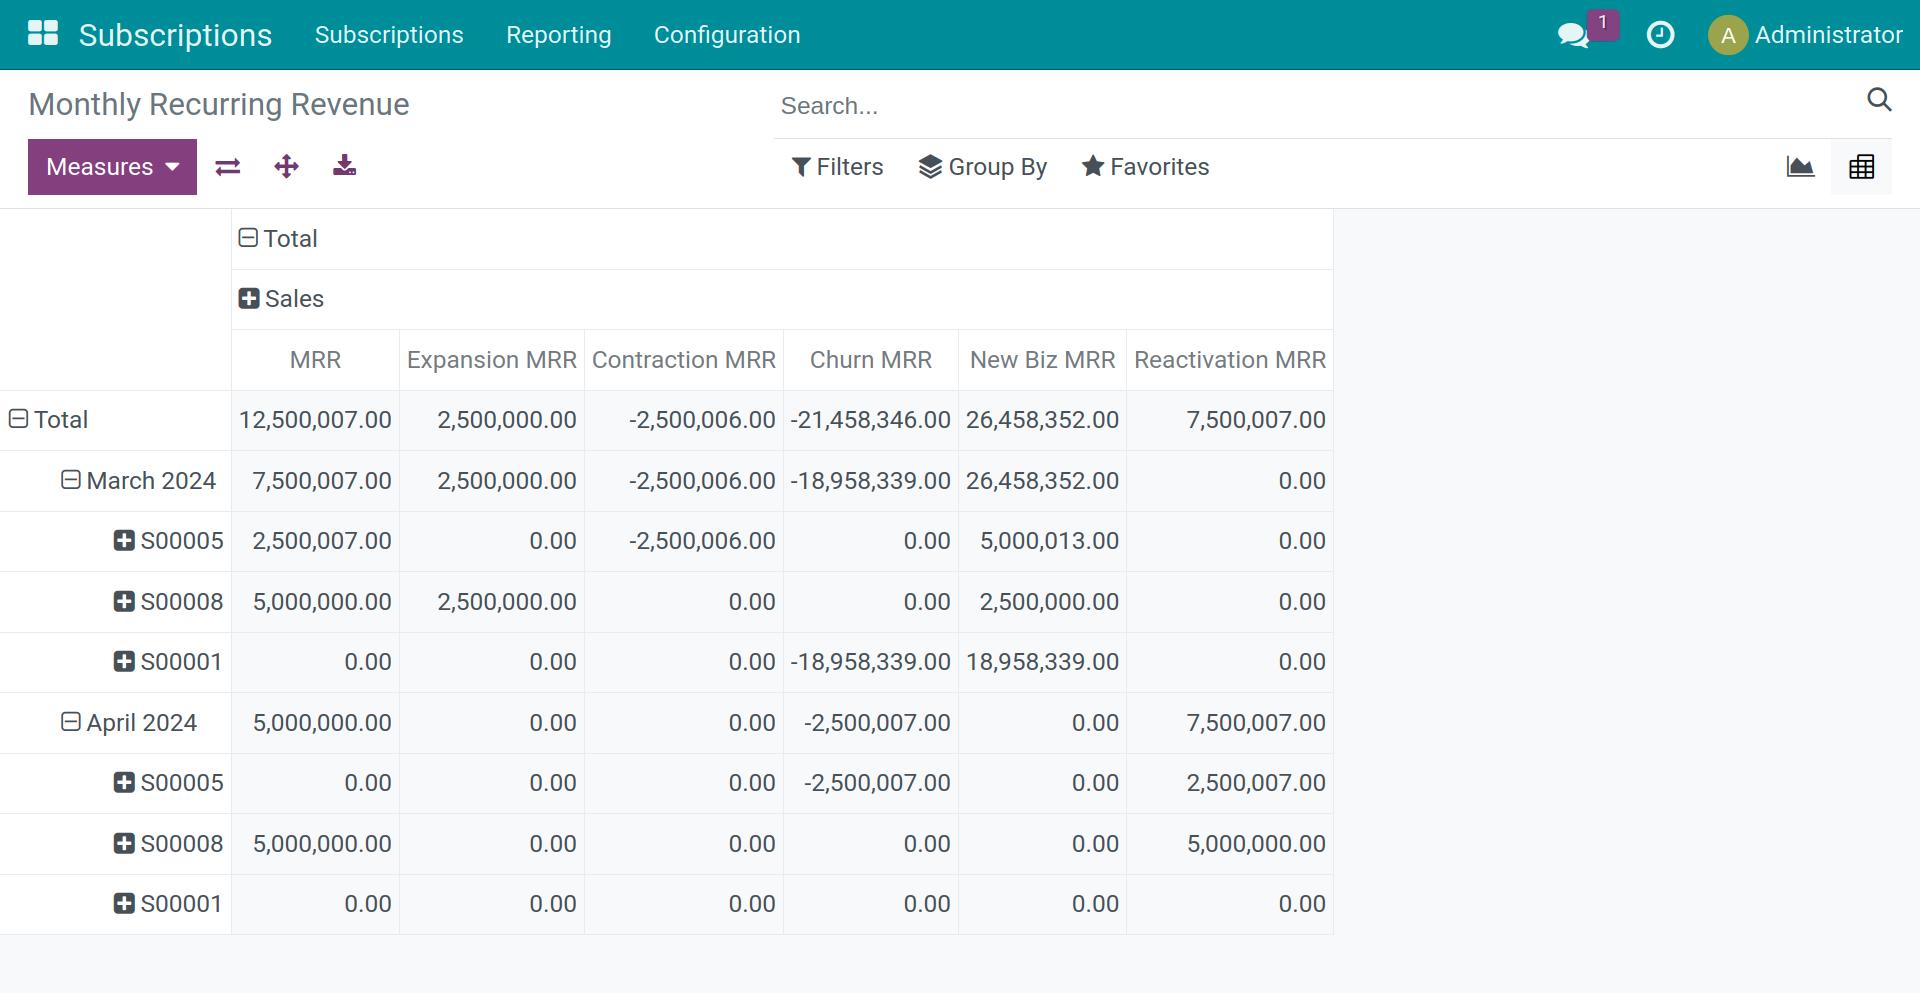
For better understanding, you can refer to the following example to see how the value displayed on the MRR report is calculated. In March, you had three subscription orders as follows:
SO001 order with an initial revenue of 18,000,000 VND, and this revenue is recorded in the New Biz MRR column. However, this month, the customer ceased using the service. Therefore, the Churn MRR column records revenue with a negative value from the original subscription.
Similar to SO001 order, the New Biz MRR column for SO005 order is recorded as 5,000,013 VND. After the end of the period, the customer continued to renew the subscription. However, the renewal order has a lower value than the original order due to 50% decrease in service usage demand. Therefore, the Contraction MRR column is recorded as -2,500,006 VND.
Order SO008 also begins with revenue of 2,500,000 VND. Then the customer purchased additional subscription services with total amount of 2,500,000 VND. Therefore, in the report for this order, the New Biz column will record the value of 2,500,000 VND, and the Expansion MRR column will record the value of 2,500,000 VND for the upsell order. In April, the report will display the subscription renewal revenue of the SO008 order in the Reactivation MRR column as 5,000,000 VND.
Revenue Rate
Revenue Upsell Rate:
The Revenue Upsell Rate is commonly used to assess the effectiveness of upselling strategies and the ability to generate additional revenue from existing customers.

Revenue Retention Rate:
The Revenue Retention Rate reflects the stability of the business and the level of success in retaining customers, while also potentially reflecting the effectiveness of customer retention strategies and after-sales services.

Revenue Churn Rate:
This is an important metric for evaluating the success of a business or product, as it reflects customer retention and satisfaction levels.

Take a look at the following example:
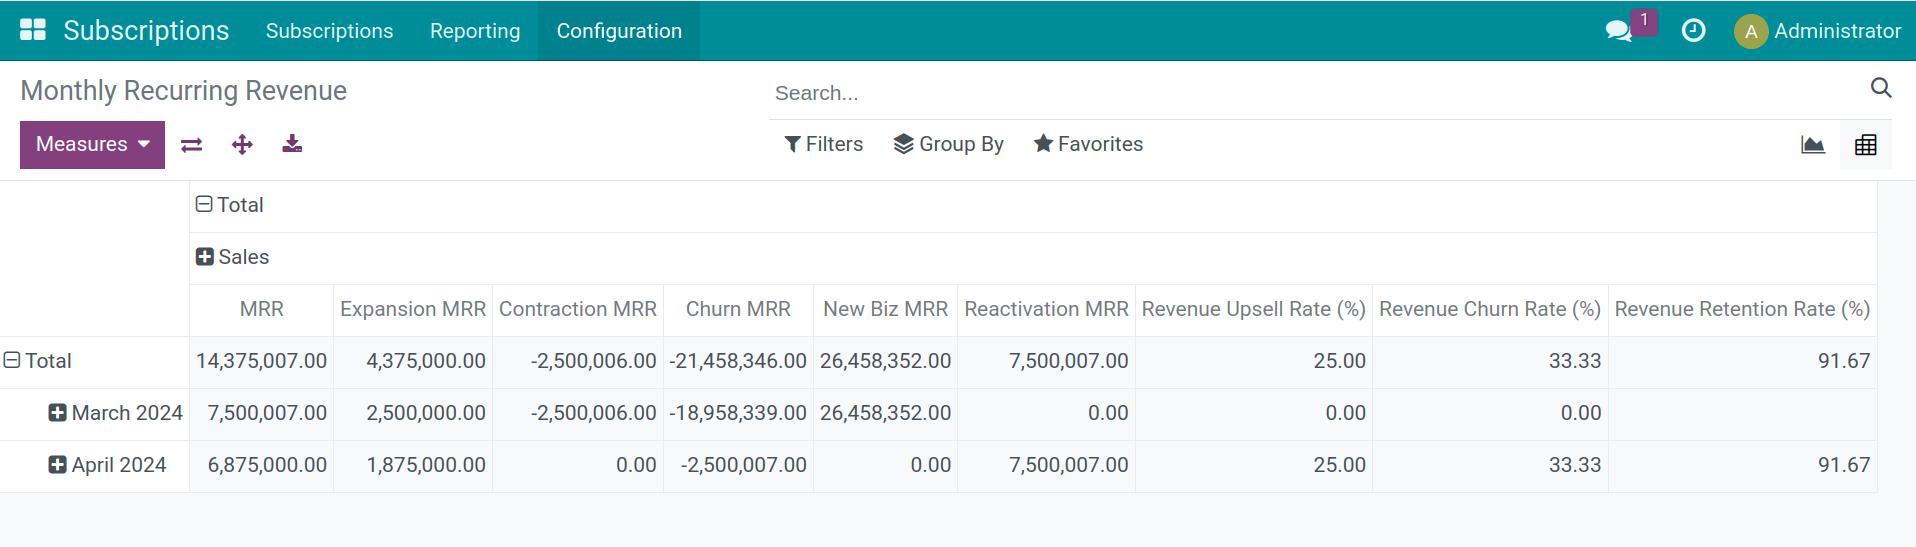
Revenue Upsell Rate = (1,875,000/7,500,007) x 100 = 25%.
Revenue Retention Rate = ((7,500,007 + 1,875,000 - 2,500,007) / 7,500,007) x 100 = 91,76%.
Revenue Churn Rate = (2,500,007 / 7,500,007) x 100 = 33%.
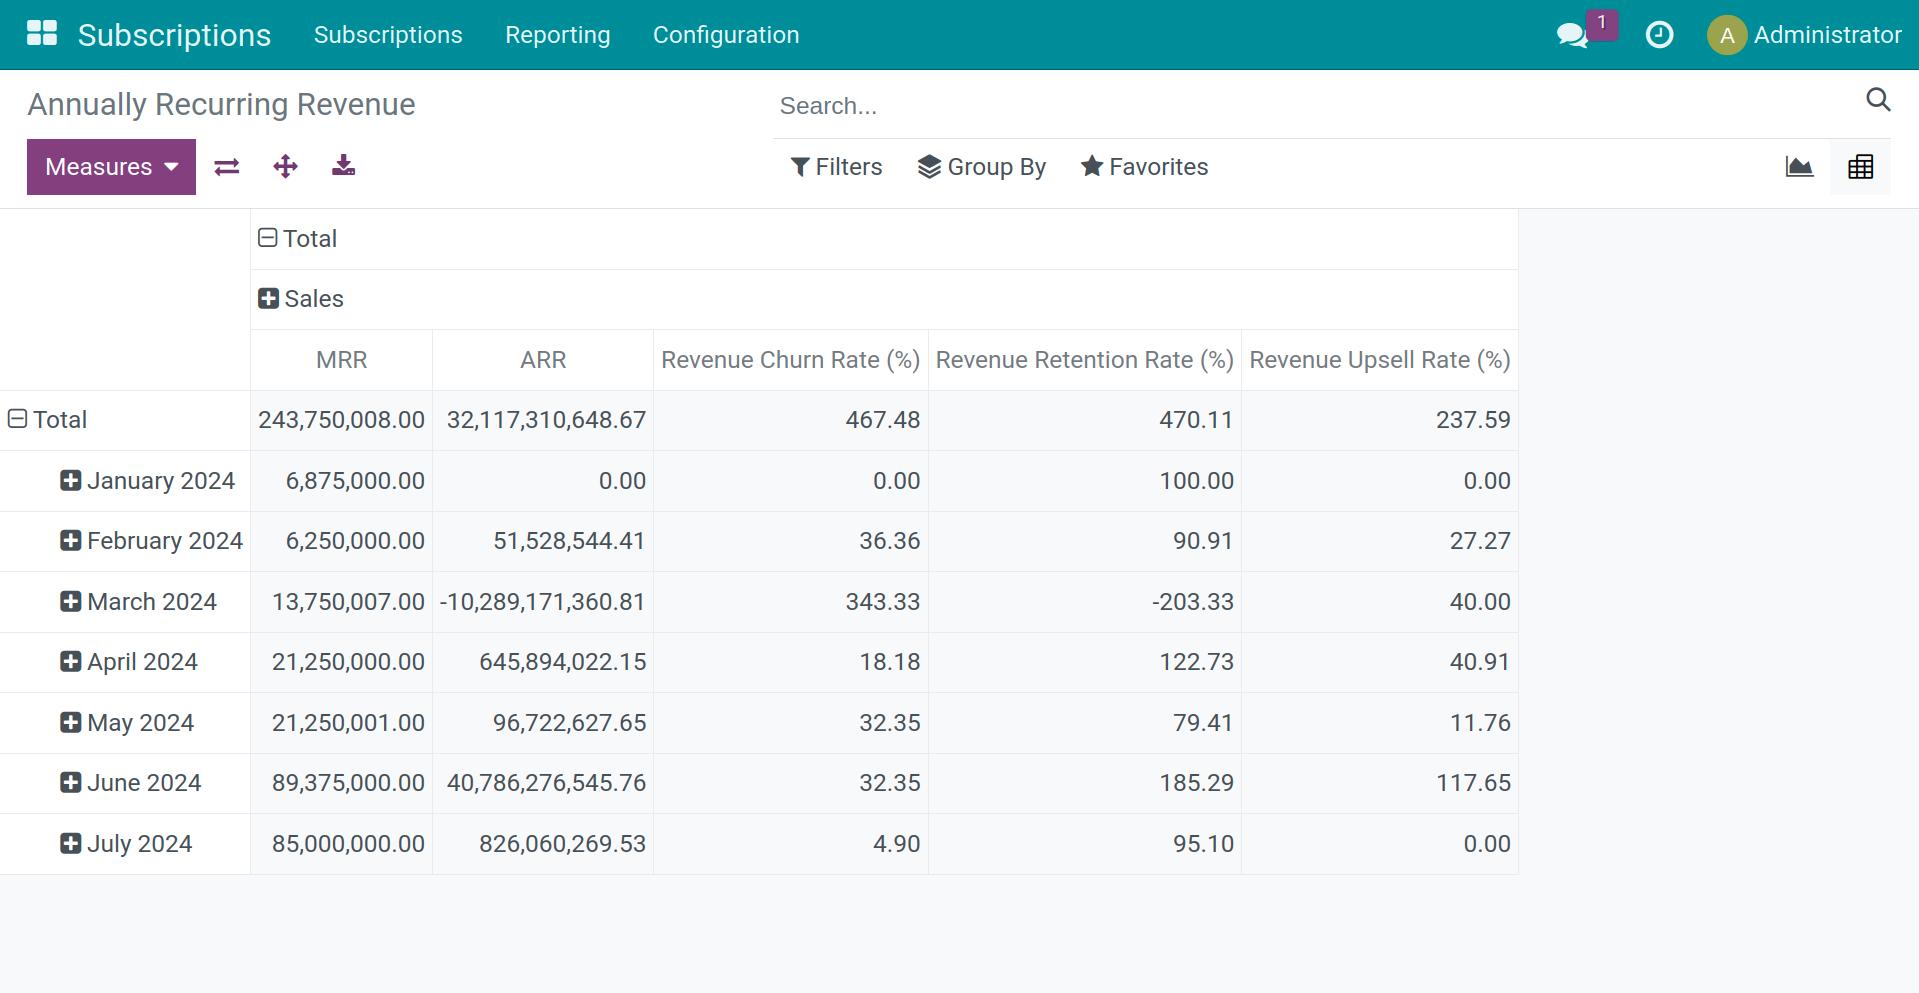
Annually Recurring Revenue (ARR) Report
Annual Recurring Revenue is a crucial metric in business’s yearly recurring revennue from services or products provided to customers. It assists the business in forecasting future revenue and making informed business decisions.
To view the Annual Recurring Revenue (ARR) report, you can access Subscriptions > Reporting > ARR, which displays the ARR report calculated using the following formula:

For example, the ARR is calculated as follows:
Revenue Churn Rate Report
To view the Revenue Churn Rate report, you access Subscriptions > Reporting > Revenue Churn Rate. You will see the report in Cohort view.
This Cohort Analysis table helps measure the churn process over a specific period of time. You can select Day, Week, Month, or Year to determine the order cycle. The columns will display the churn rate based on the total churn rate of the previous and current months.
For example, the chart below tracks the churn process by month:
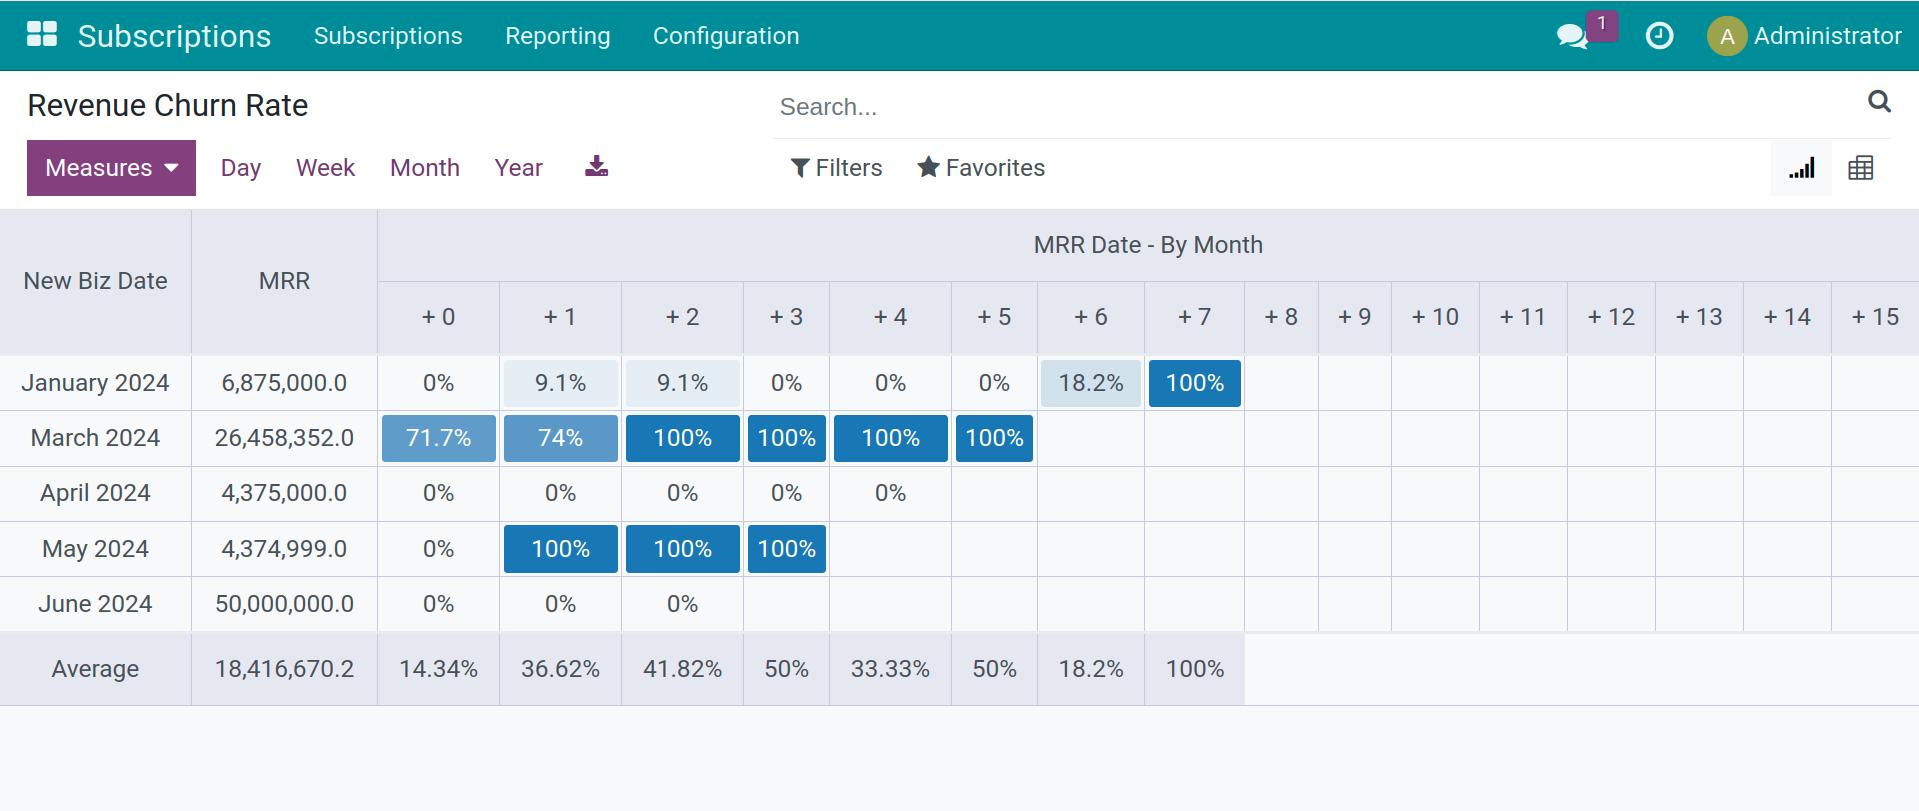
The MRR in March is 26,458,352 VND:
There is 1 subscription order with value of 18,958,339 VND churned in March. The value in the +0 column, row March 2024 = 0% + (18,958,339/26,458,352) x 100 = 71,7%.
There is 1 subscription order with value of 1,958,339 VND churned in April. The value in the +1 column, row March 2024 = 0% (In April, there were no churn orders) + (1,958,339/ 26,458,352) x 100 = 74%.
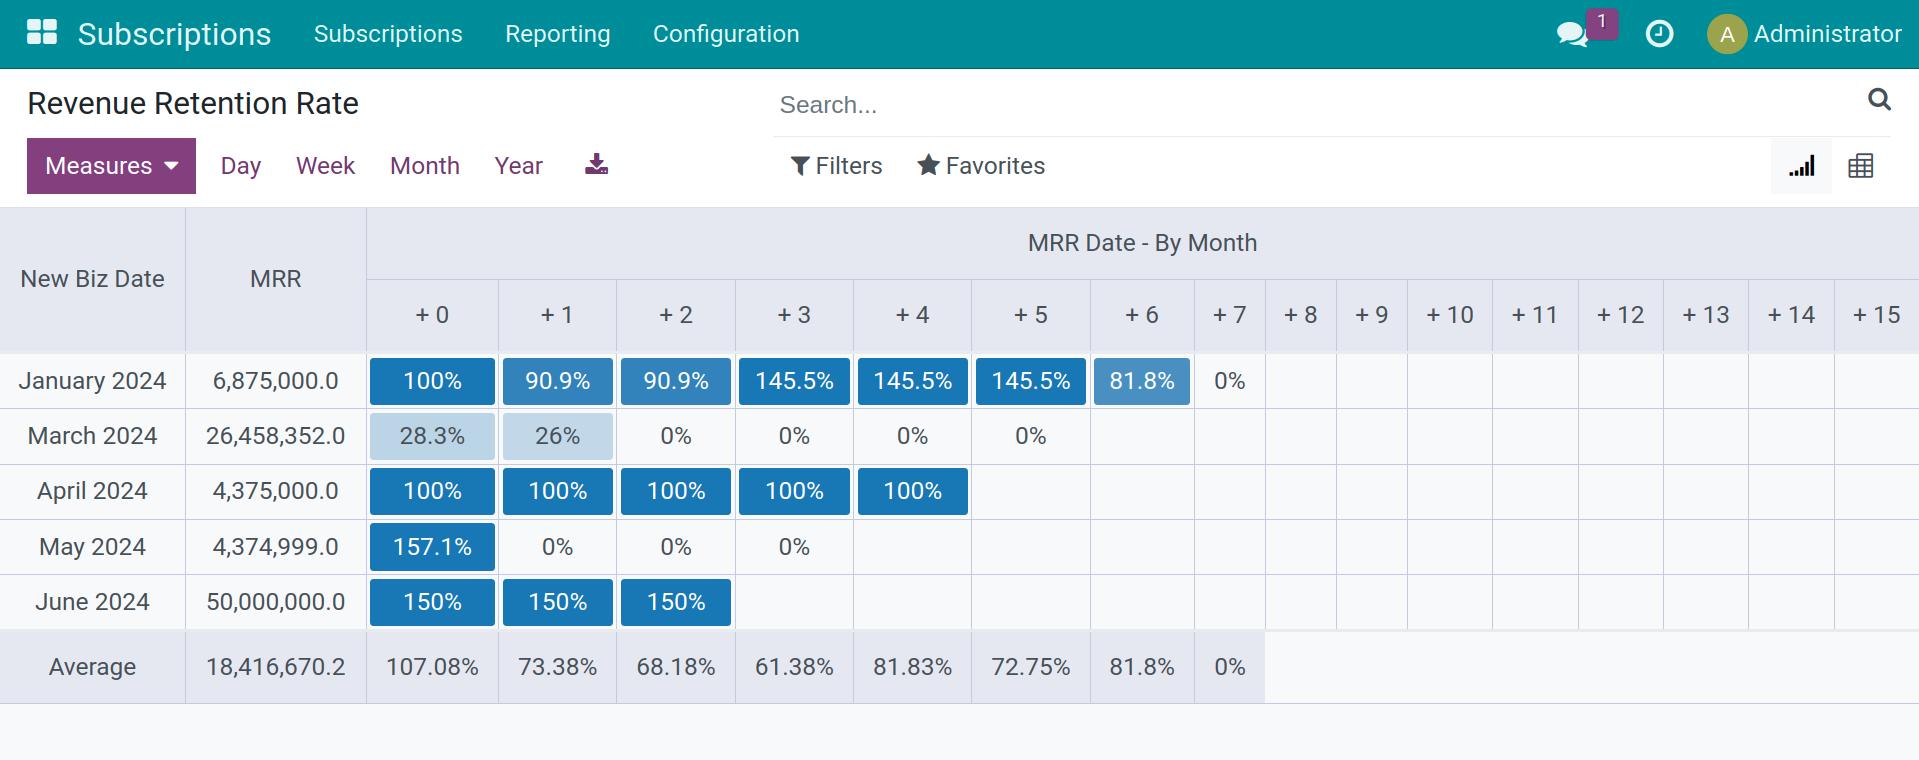
Revenue Retention Rate Report
To view the Revenue Retention Rate report, you access Subscriptions > Reporting > Revenue Retention Rate. Similar to the Revenue Churn Rate report, the Viindoo software provides a Cohort analysis table to measure the customer retention process over a certain period of time. You can select Day, Week, Month, or Year to choose the cycle of the subscription. The columns will display the revenue retention rate based on the time criteria you have selected.
See also
Related article:
Optional module