How to understand manufacturing reports
Manufacturing reports allow the manager to keep track of the manufacturing information in your enterprise including the quantity of the finished product, cost incurred, current operations, and the efficiency of the units joining in the manufacturing process. The reporting system of Viindoo Manufacturing app helps the manager update the manufacturing situation easily, fully, and instantly through the following reports:
Work orders report;
Manufacturing orders report;
Overall Equipment Effectiveness report;
Production Cost Report;
Loss Components Analysis.
Requirements
This tutorial requires the installation of the following applications/modules:
Manufacturing orders report
Navigate to Manufacturing > Reports > Manufacturing Orders to see the manufacturing orders report.
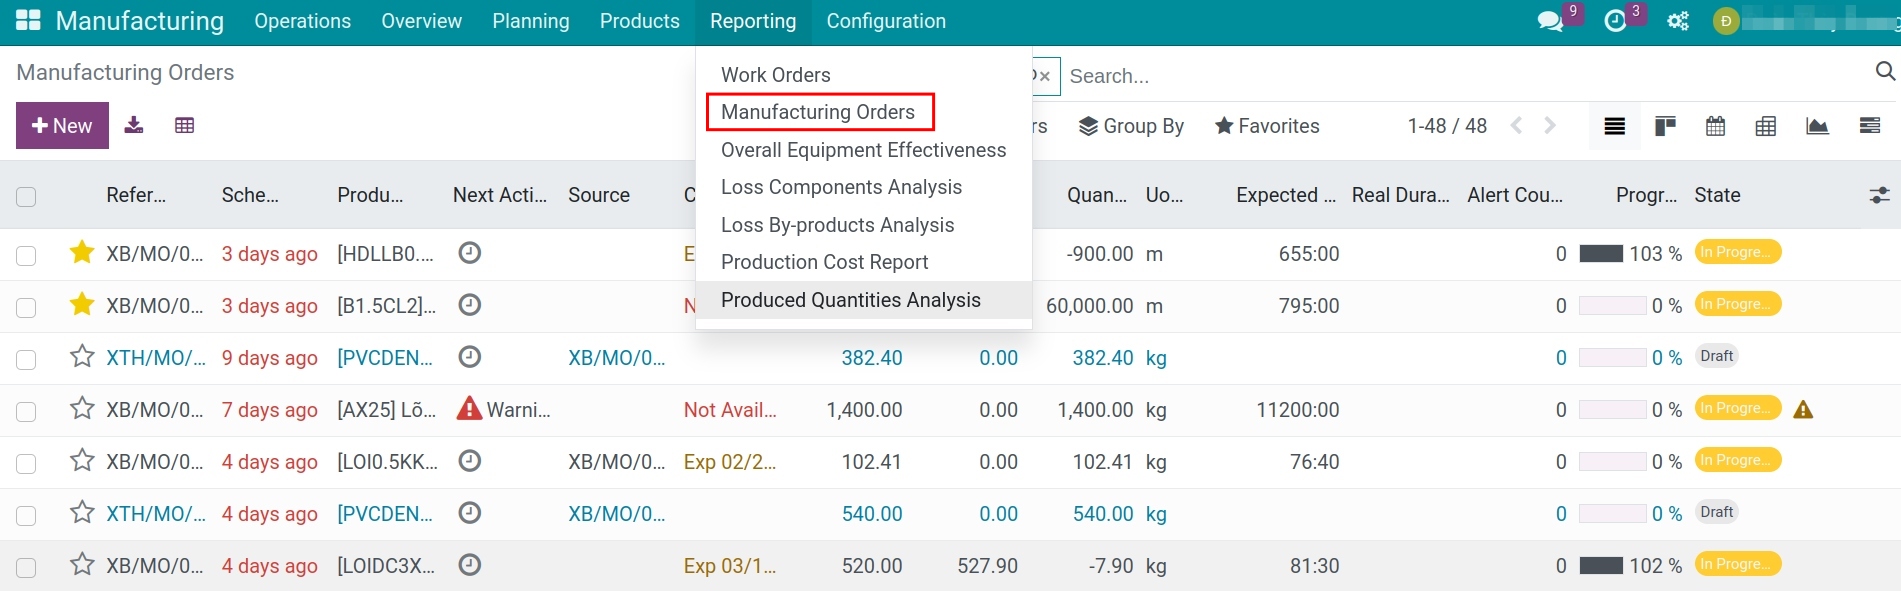
Depending on the job position or the user’s purpose, you can choose different types of report views. For example, chart formats provide visual comparisons of the quantity for each production order; pivot formats are for deeper, more detailed, and multidimensional analysis purposes such as progress, the quantity of unfinished products, or the cost of production items; … The software supports you to view the following formats:
Report in chart format (bar chart, line chart, pie chart);
Pivot analysis report;
Gantt chart analysis report.
To view the reports you select, click on the icon in the top right corner of the report screen you want to view, and you will be directed to the detailed interface.
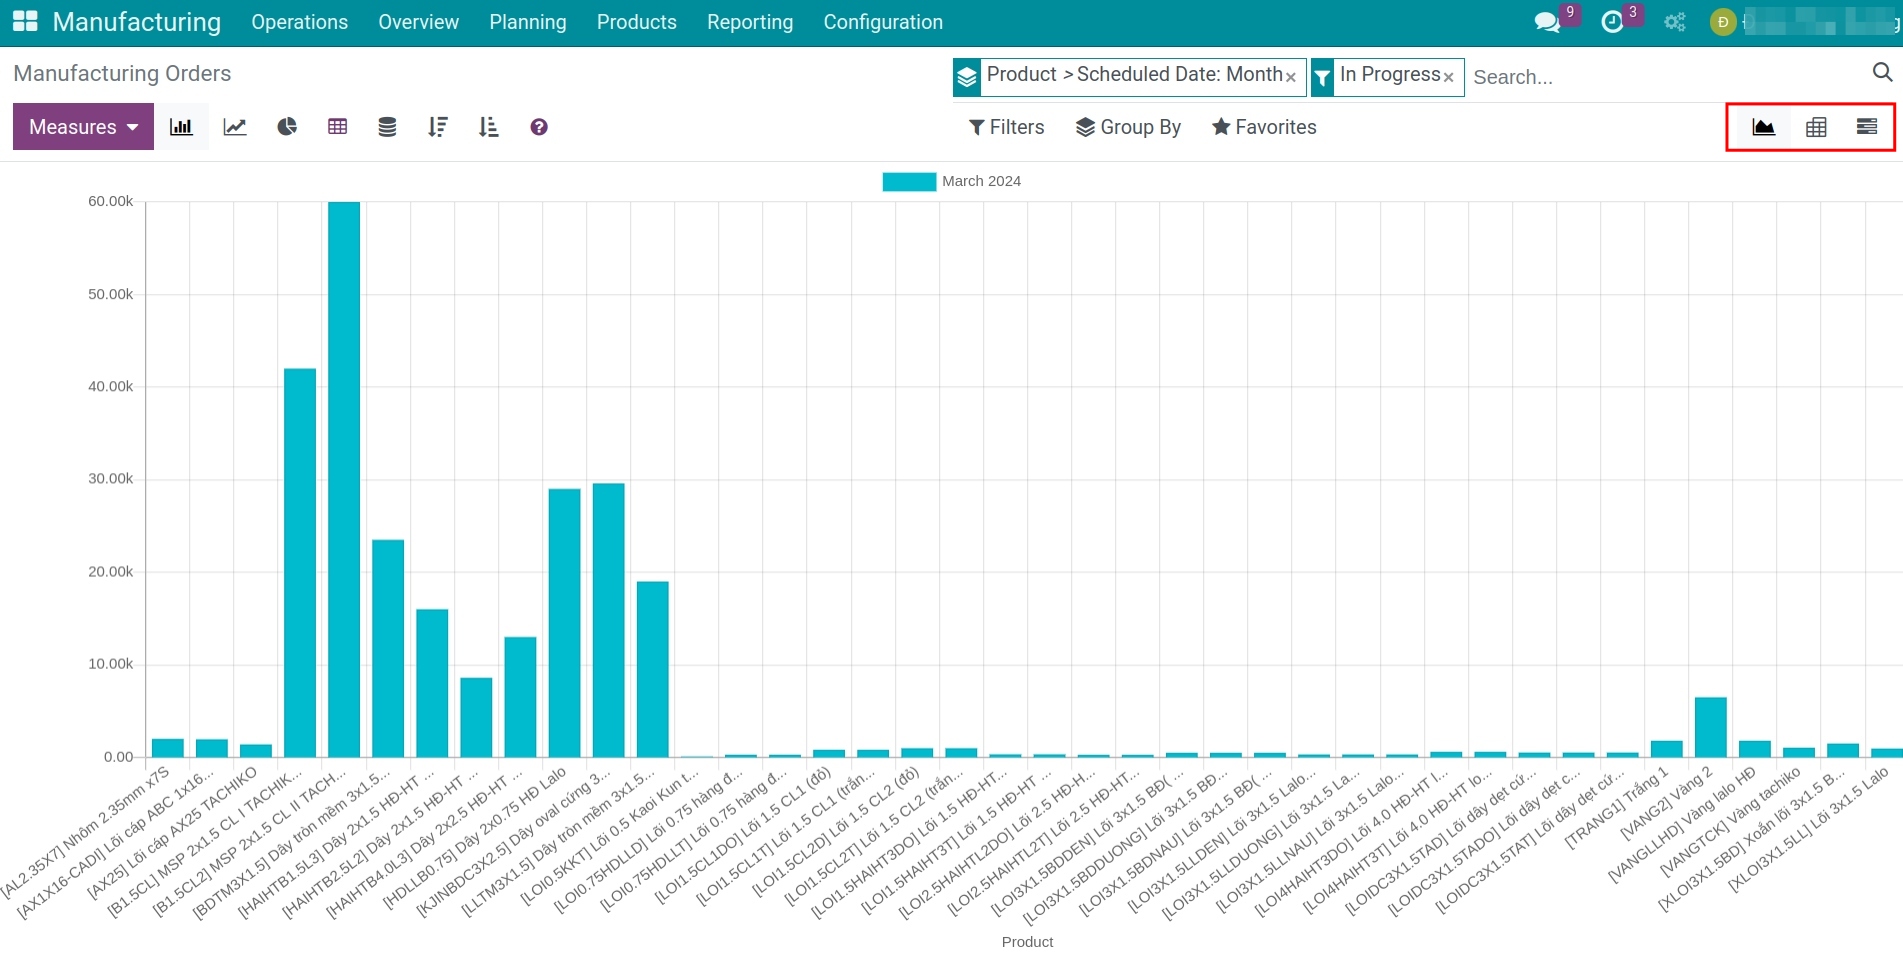
1. Report in chart format
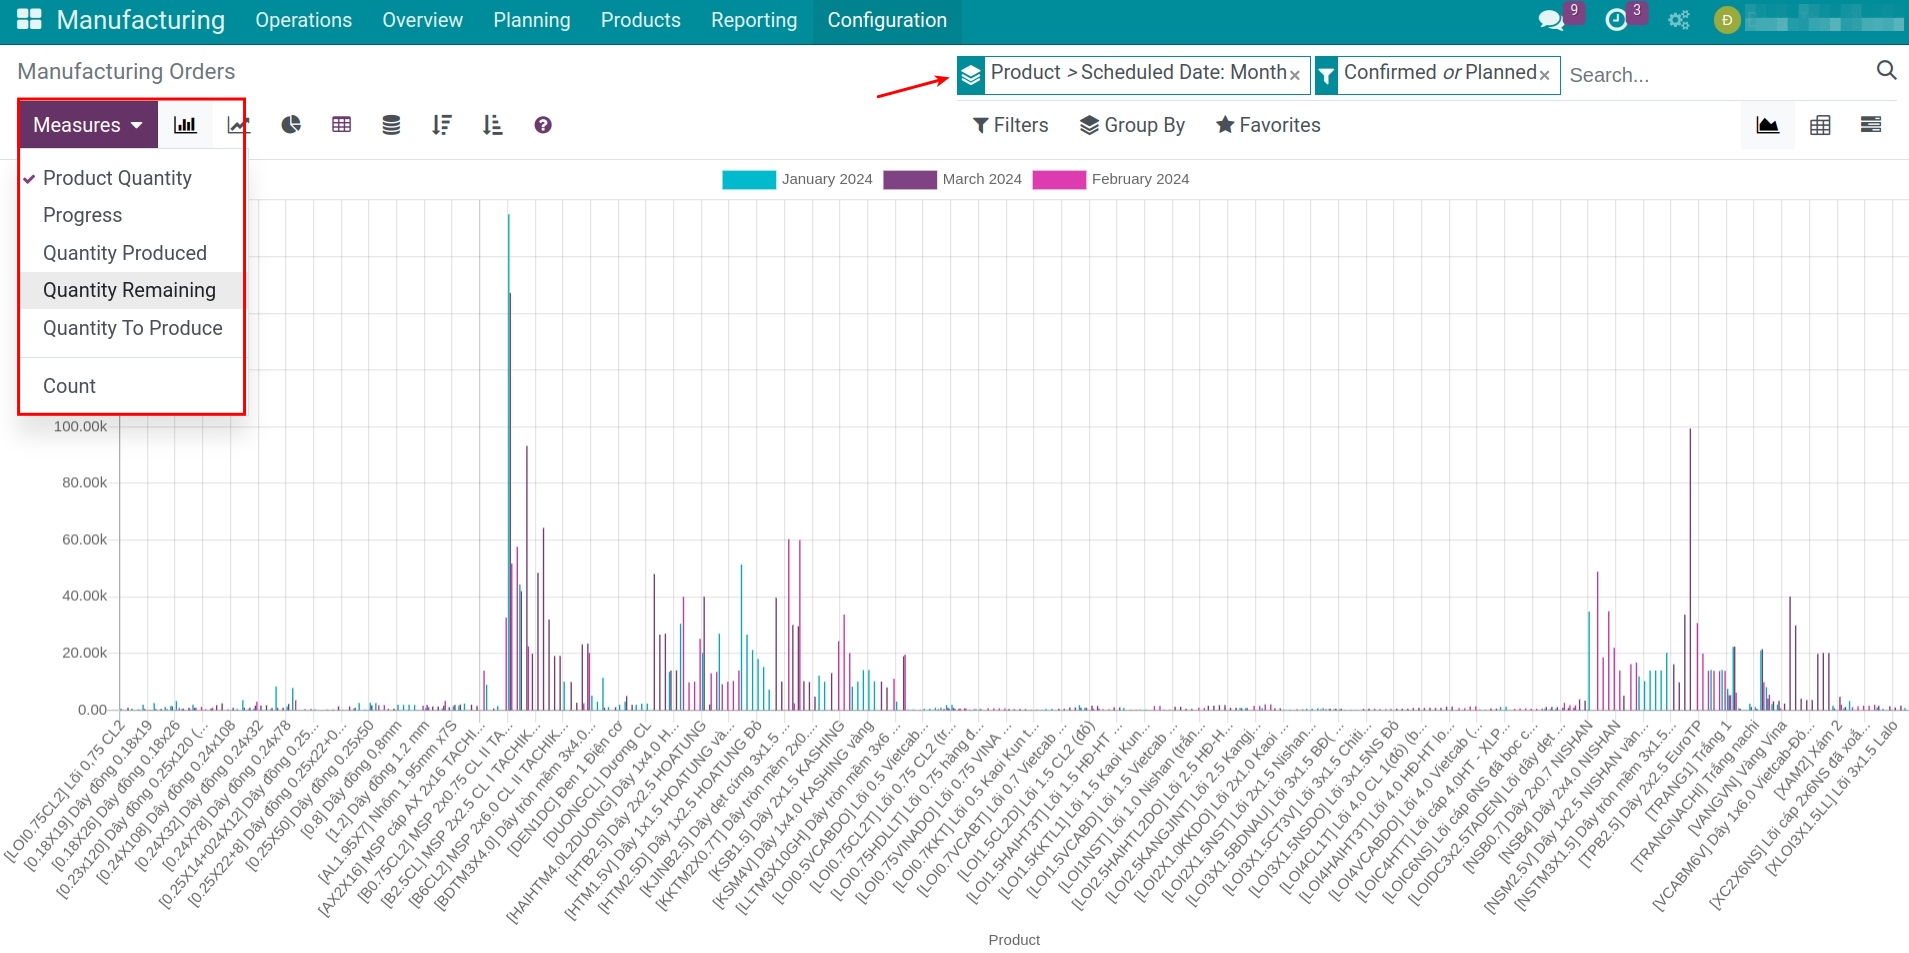
With this viewing method, you can use filtering tools to filter data according to your needs. For example, by time range, various metrics, grouping by one or multiple products with the same criteria, and so on.
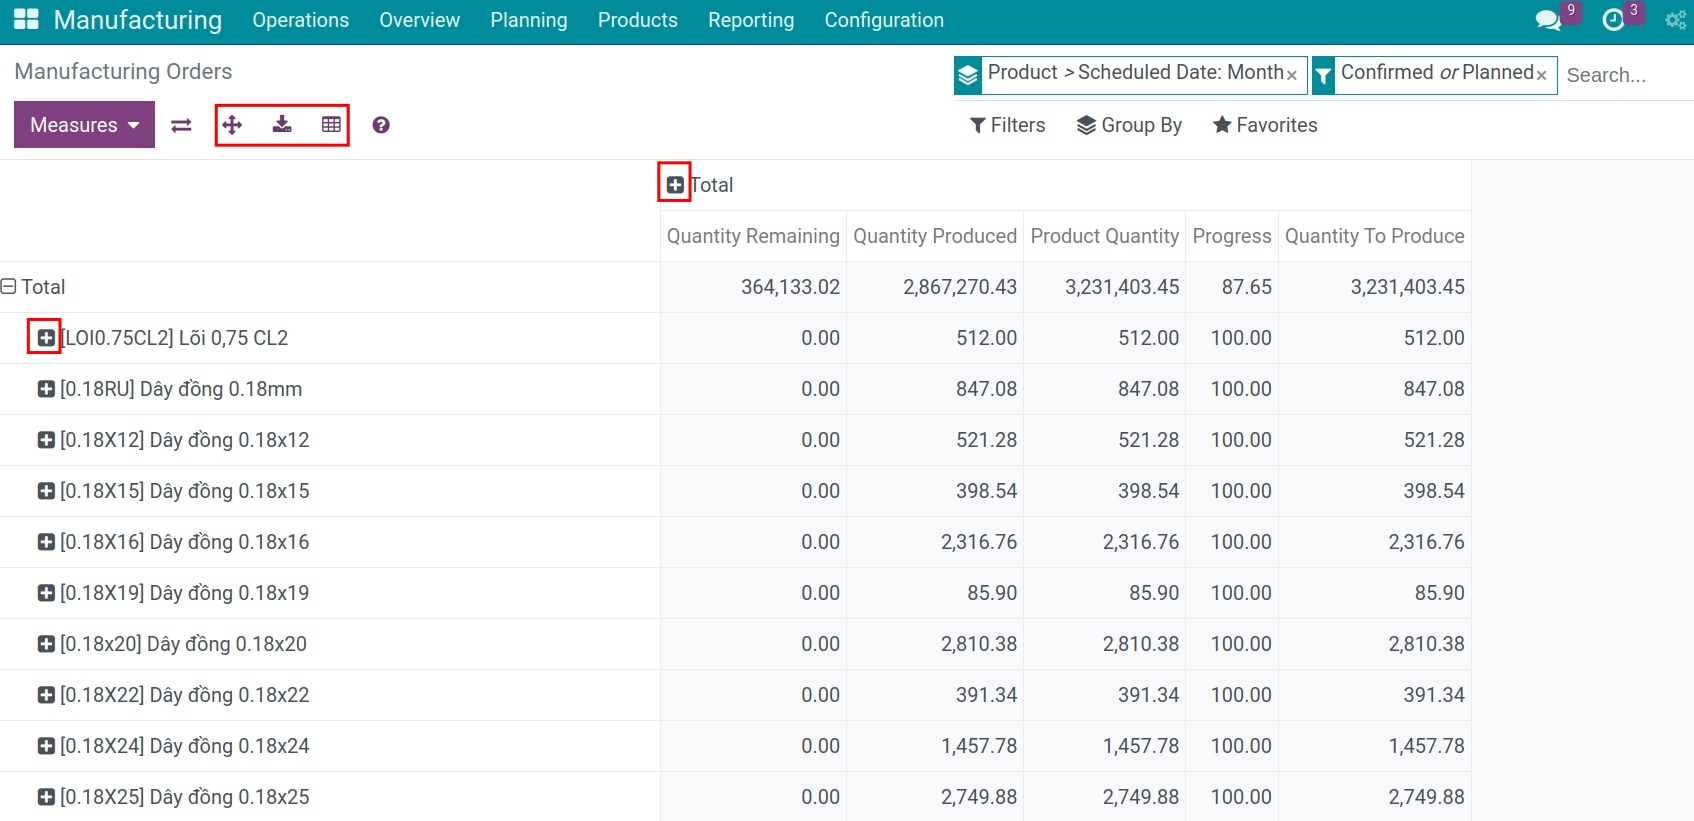
2. Pivot analysis report
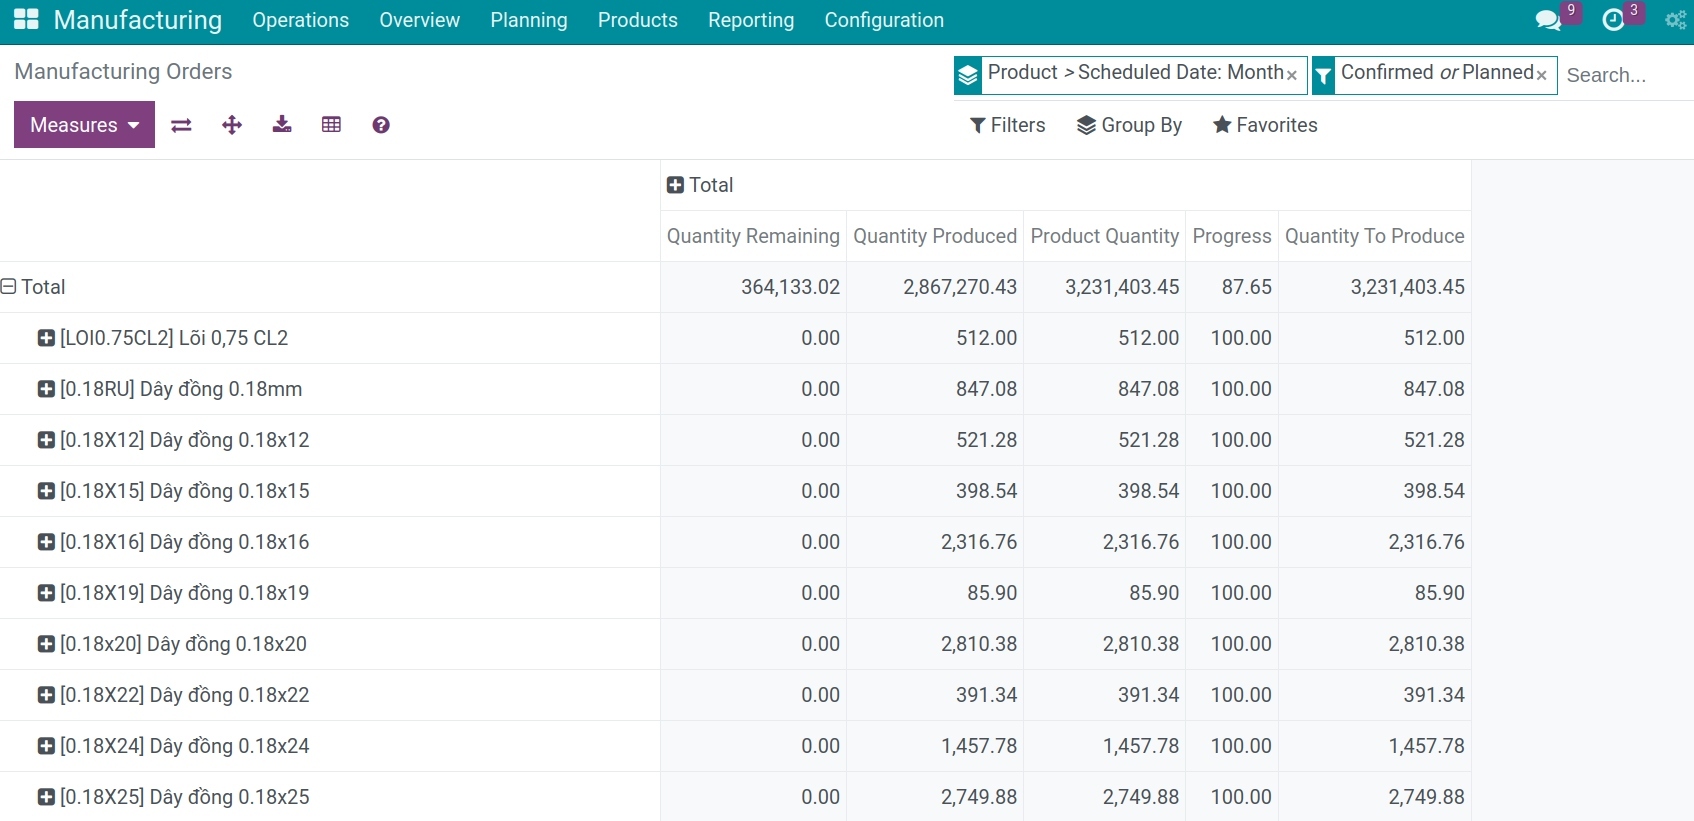
The pivot analysis report supports the following features:
Exporting the report to an Excel file for use.
Adding parameters to columns by clicking on the plus sign (+) or clicking on the minus sign (-) when you want to hide the values of those parameters.
Changing the axis of the report or expanding all selected values.
Note
The criteria of the report are displayed in the order of selection. For example, if you want to view the production order analysis report by date and by product, the order of selecting criteria would be Planned Date >> Product >> Reference (production order).
3. Gantt chart analysis report
Refer to the article: Manufacturing report in Gantt.
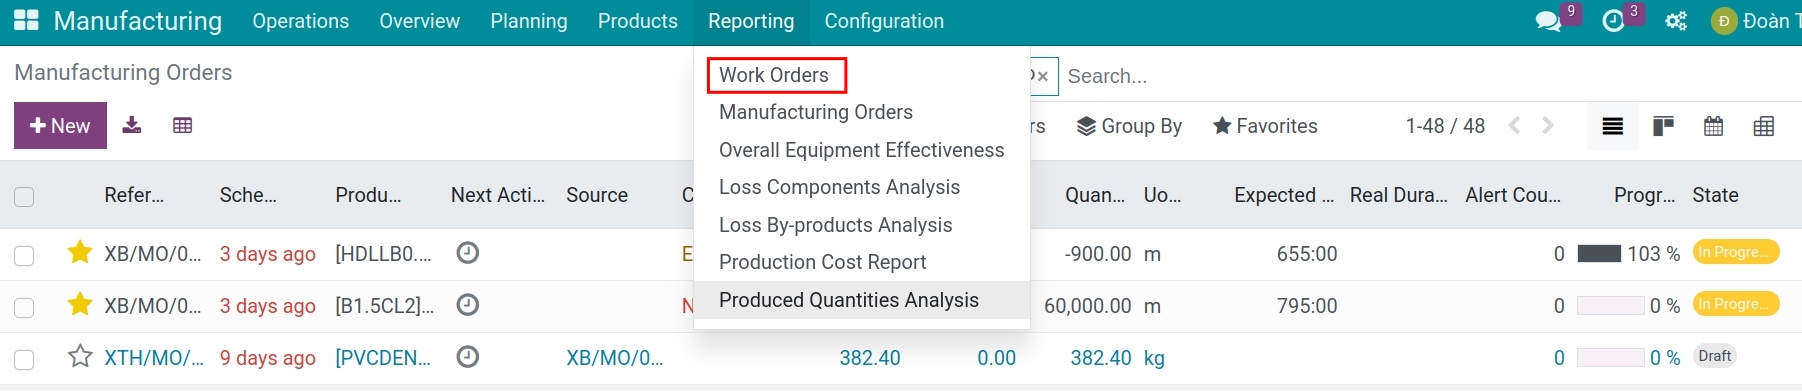
Work orders report
Navigate to Manufacturing > Reporting > Work Orders to see the report about the works of the manufacturing process.
Similarly to other reports, you can also view this report in various formats, including charts, pivot tables, and lists.
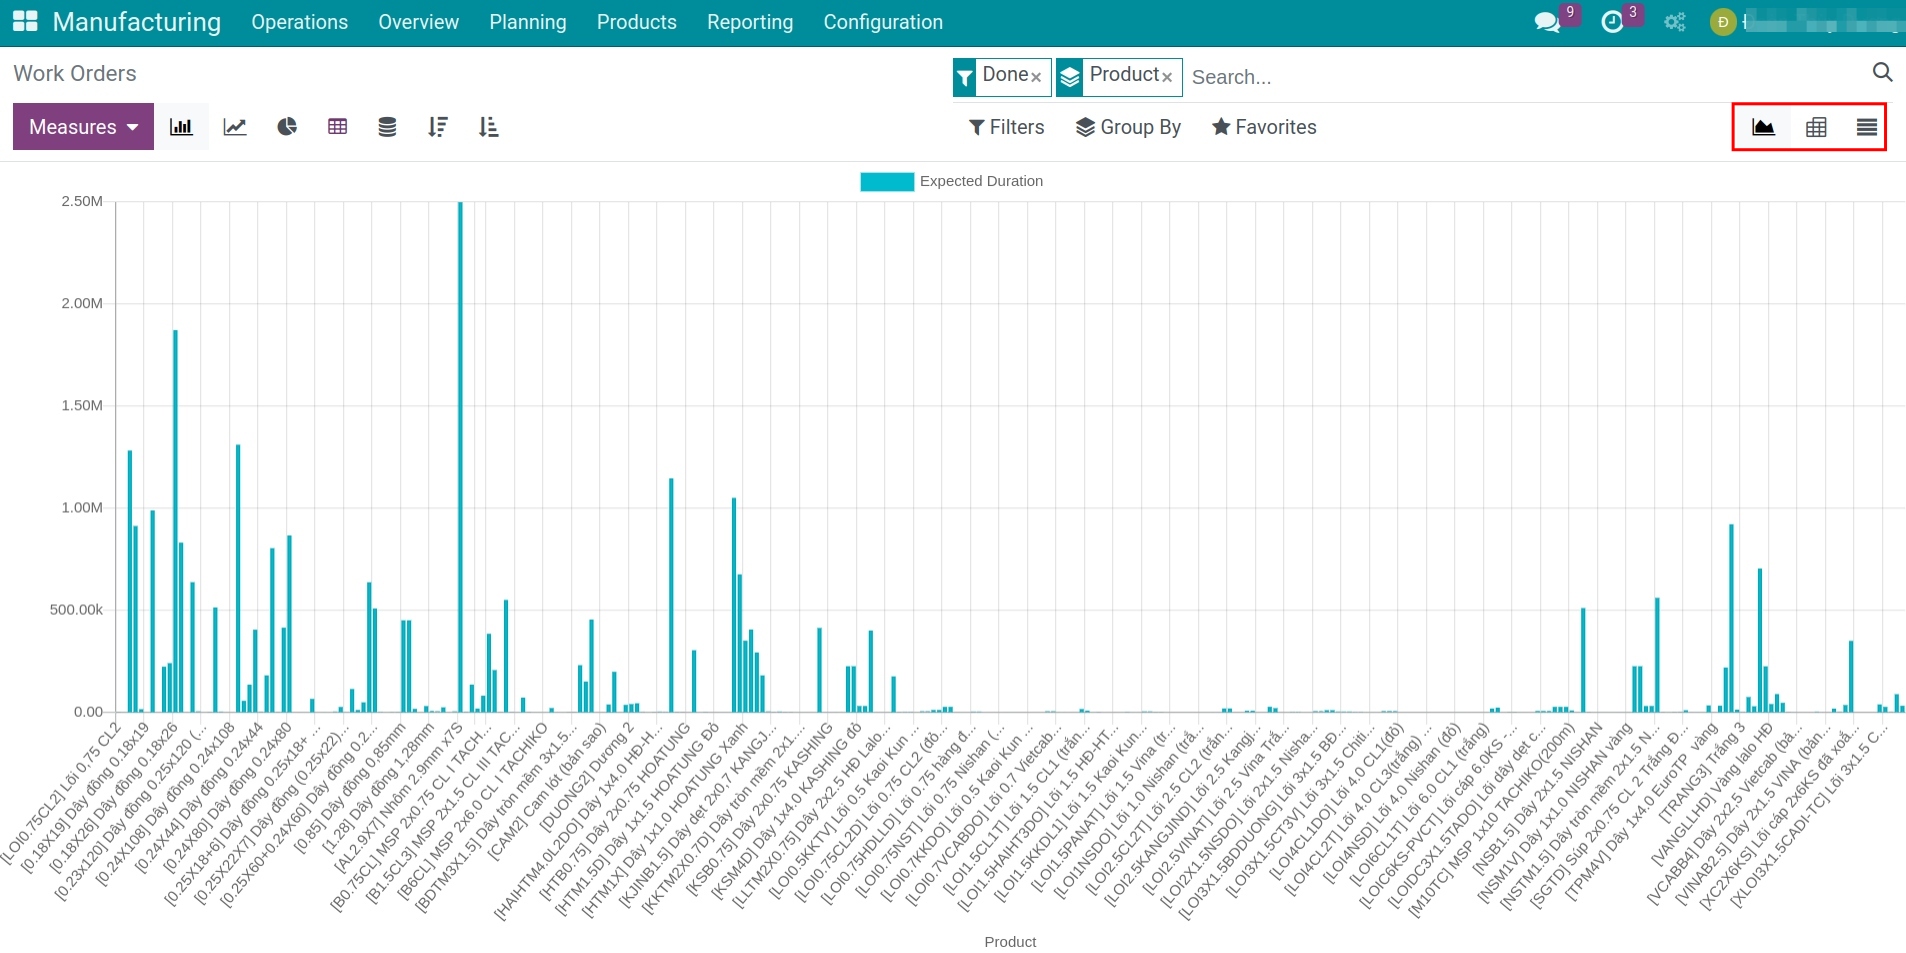
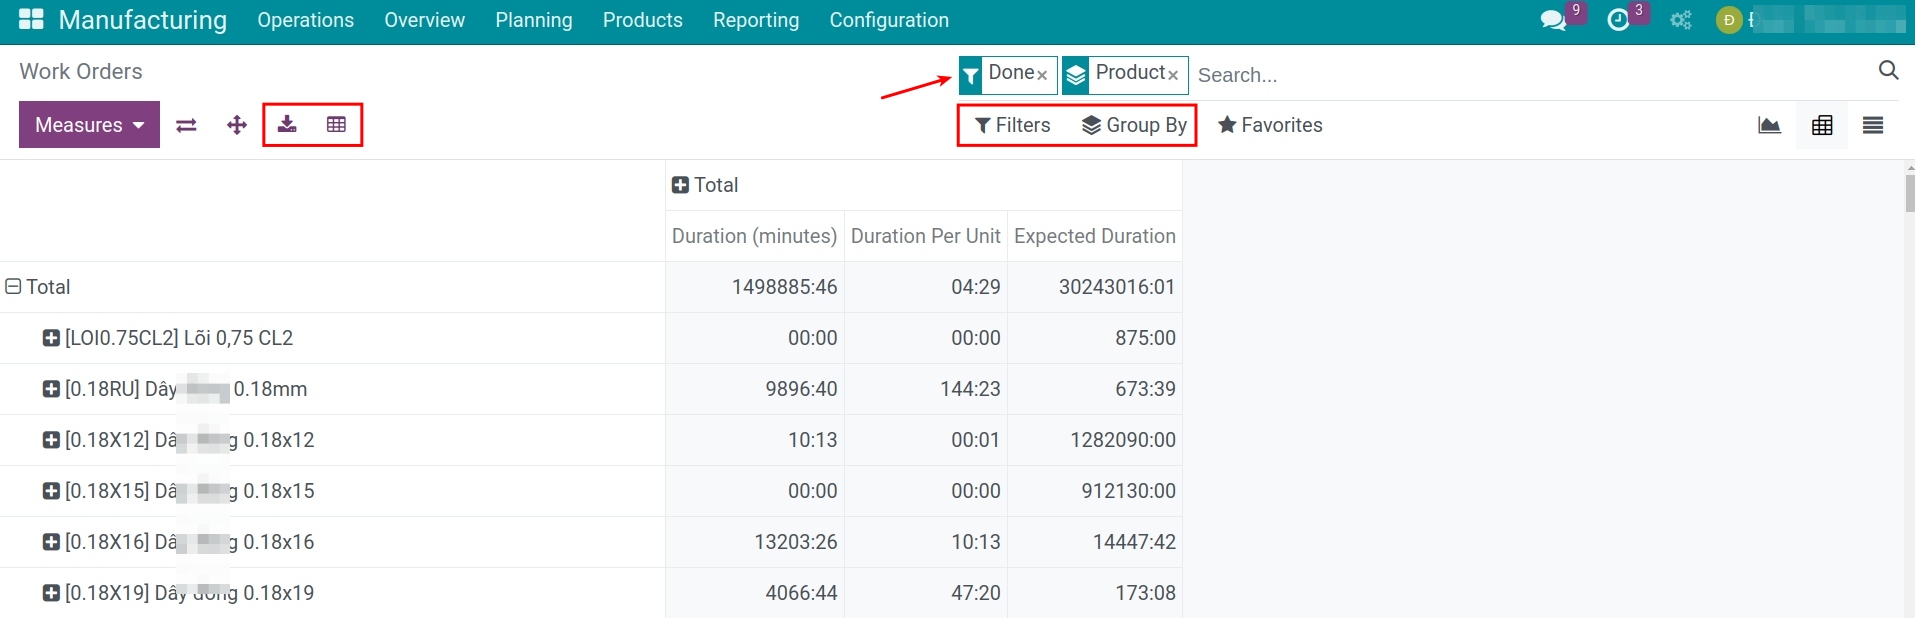
With this report, you can view detailed quantities, costs, and durations of each product or production capacity by selecting Measures and activating the measurement criteria.
You can also use the filter and group to filter the needed criteria or press the download button to download this report under an Excel file.
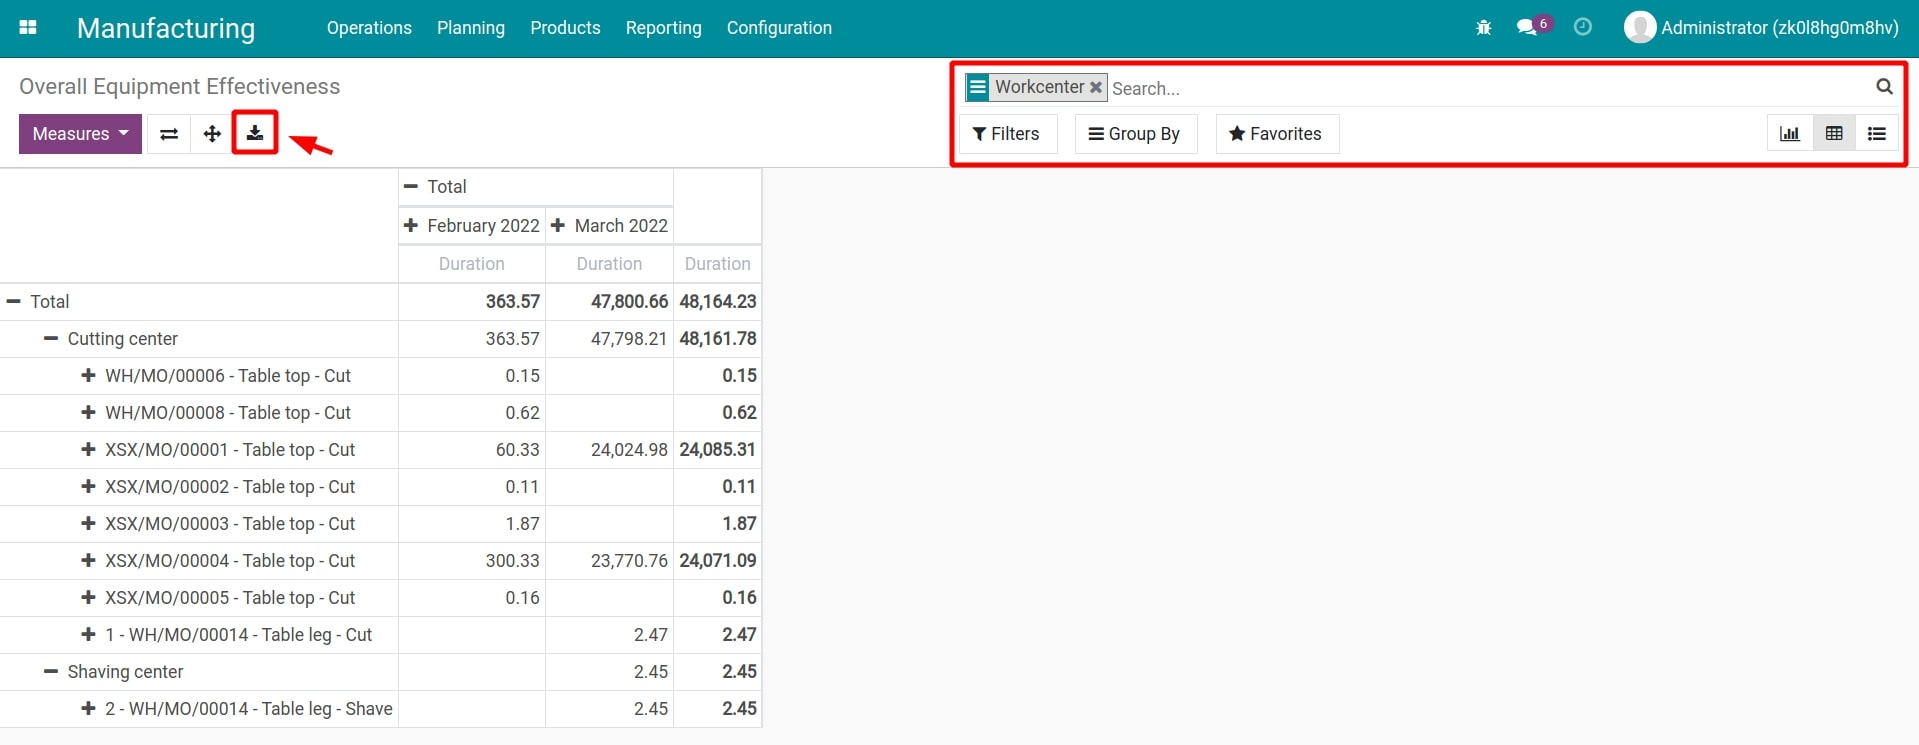
Overall Equipment Effectiveness report
Navigate to Manufacturing > Reporting > Overall Equipment Effectiveness to view the report of the effectiveness of the units joining in the manufacturing process.
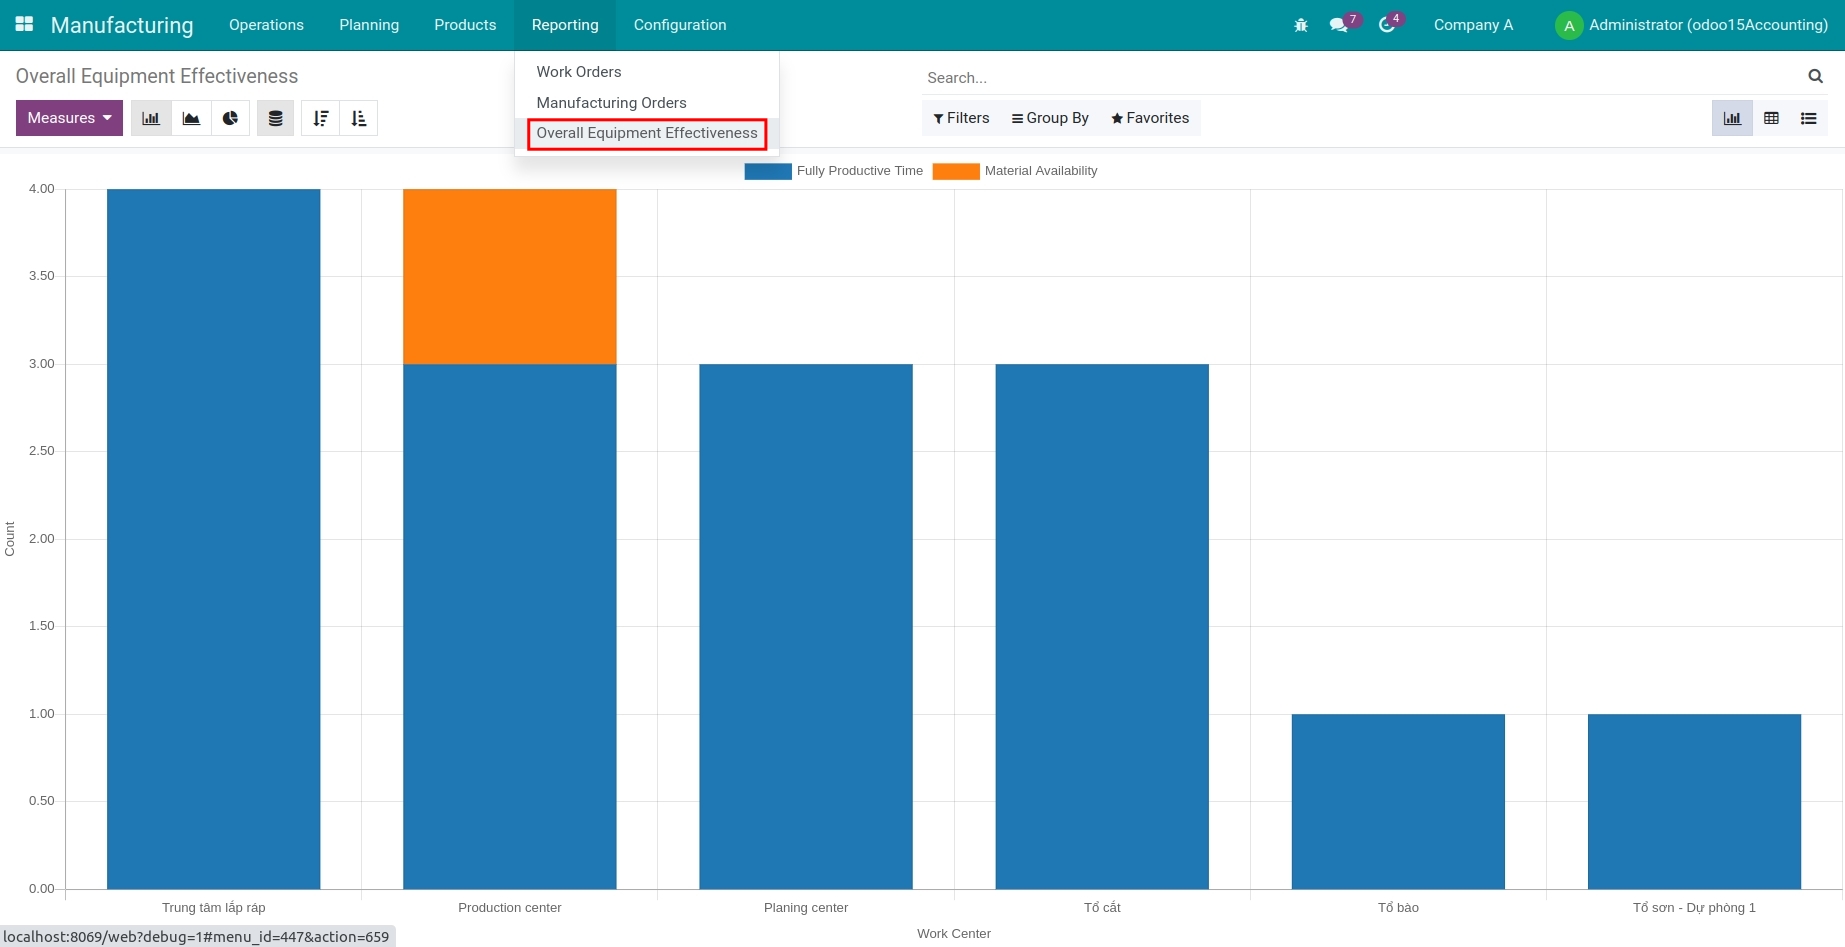
With the overall equipment effectiveness report, the system support 3 types of report which are graph, pivot, and list.
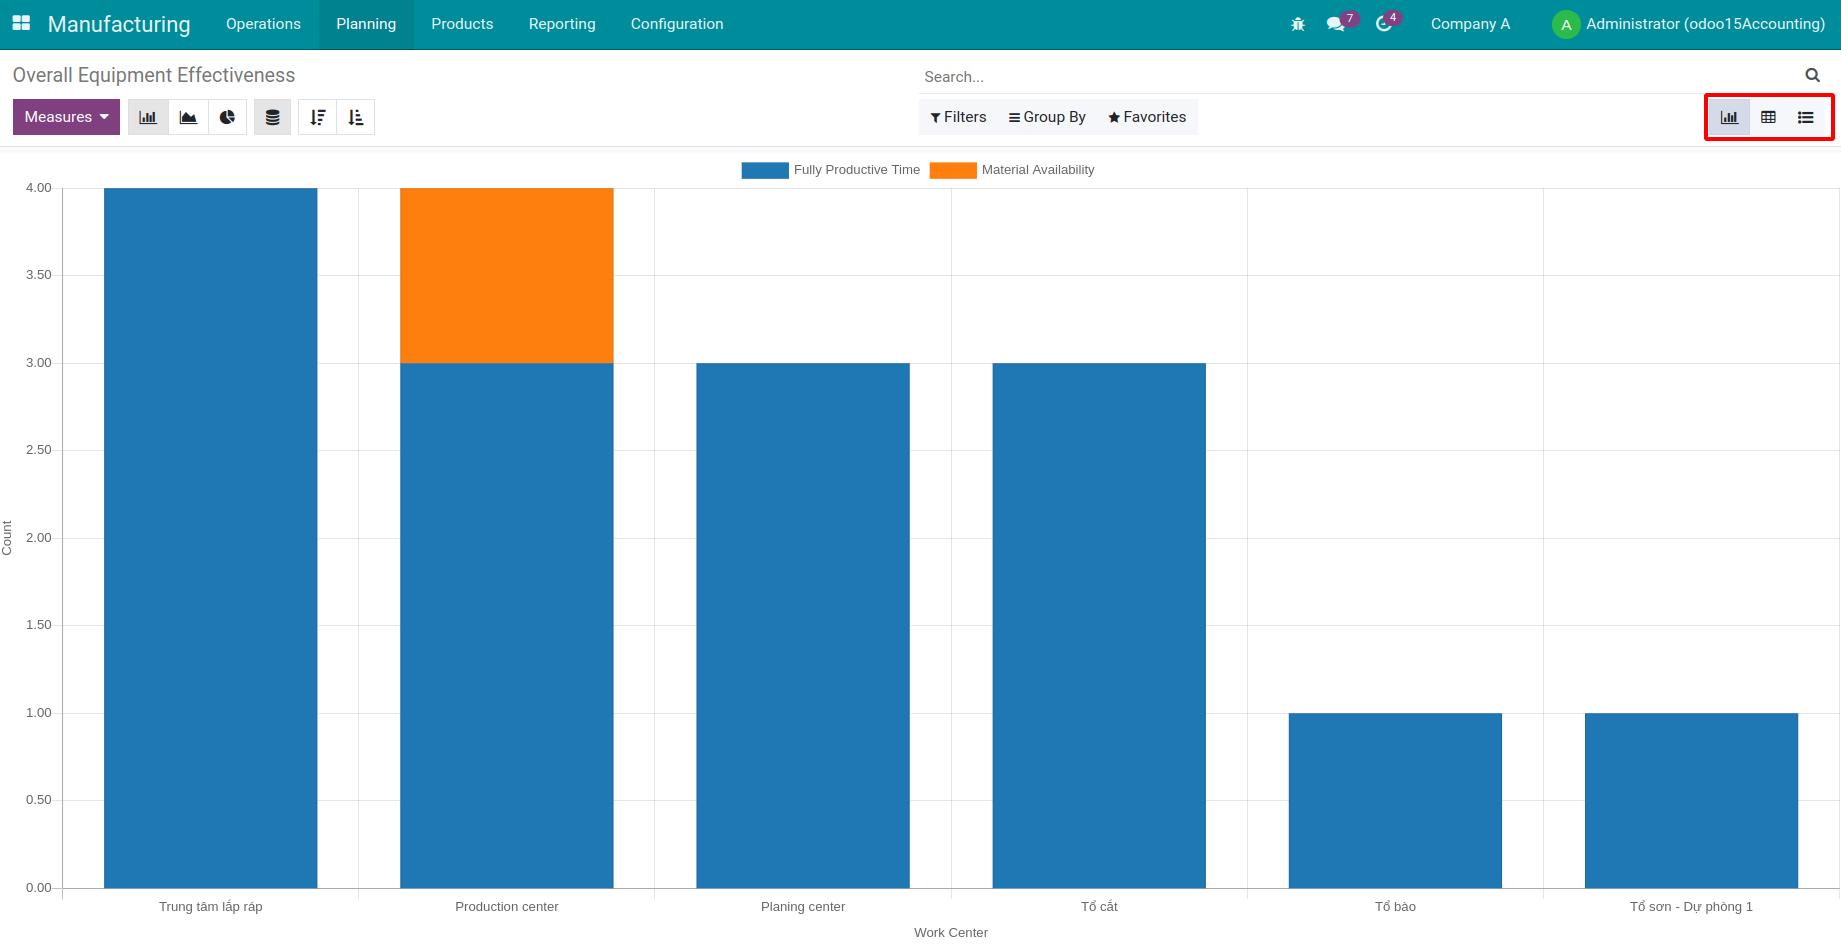
In this article, we will focus on the pivot report. At the current view, select the pivot icon on the top right corner.
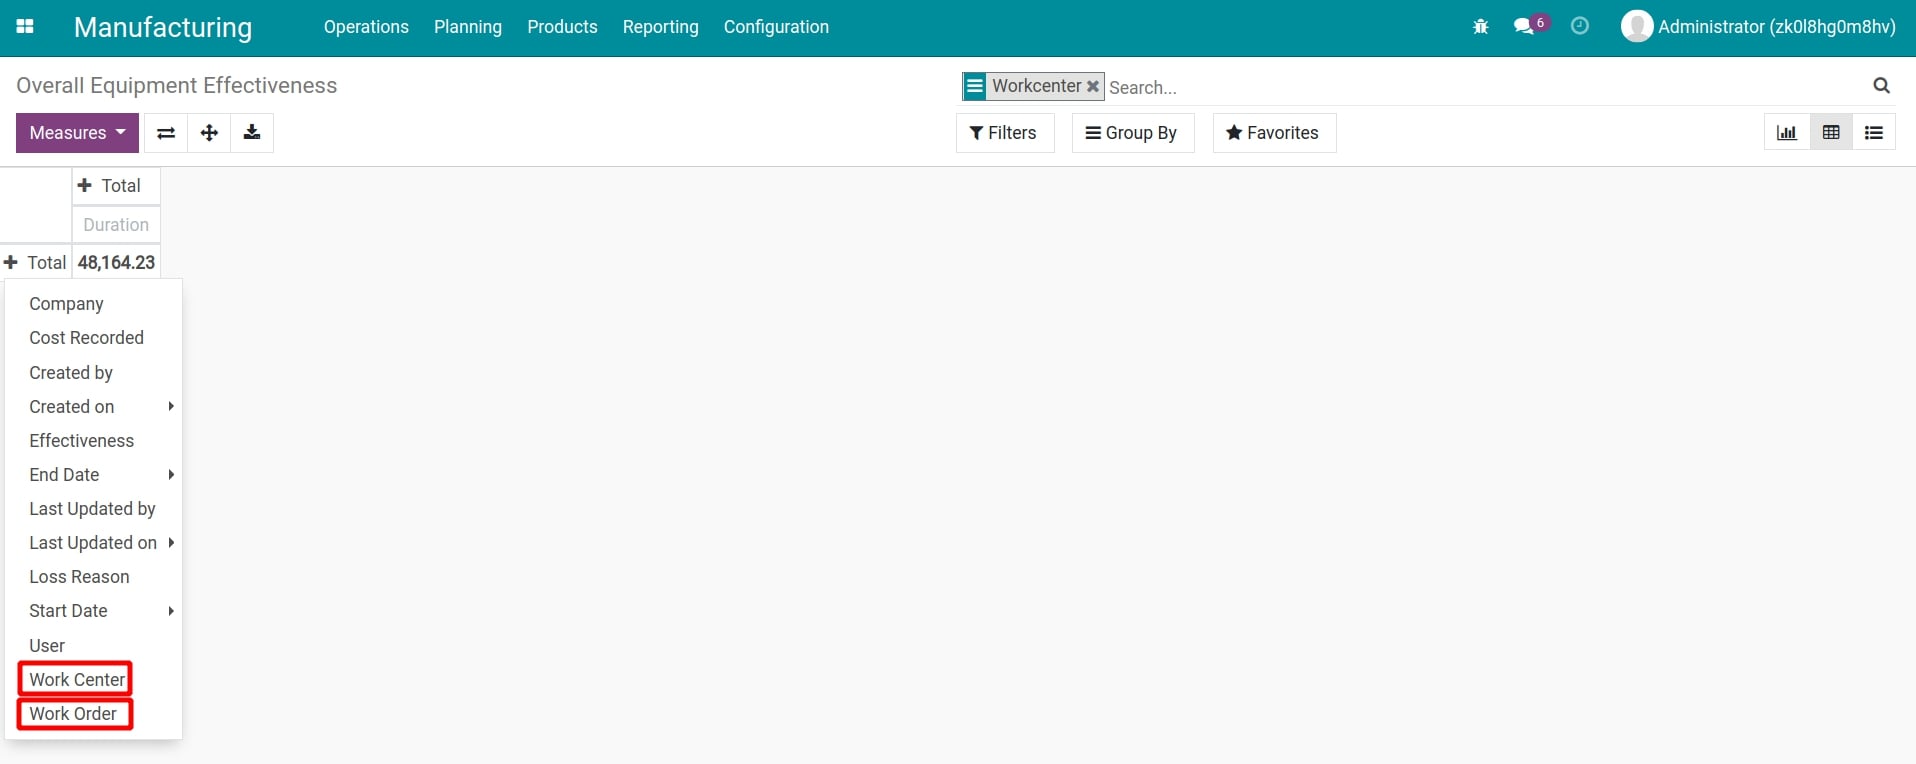
For the report column, select Work Center and Work Order.
For the report row, select Create On (Day/Week/Month/Quarter/Year) to view the needed stage.
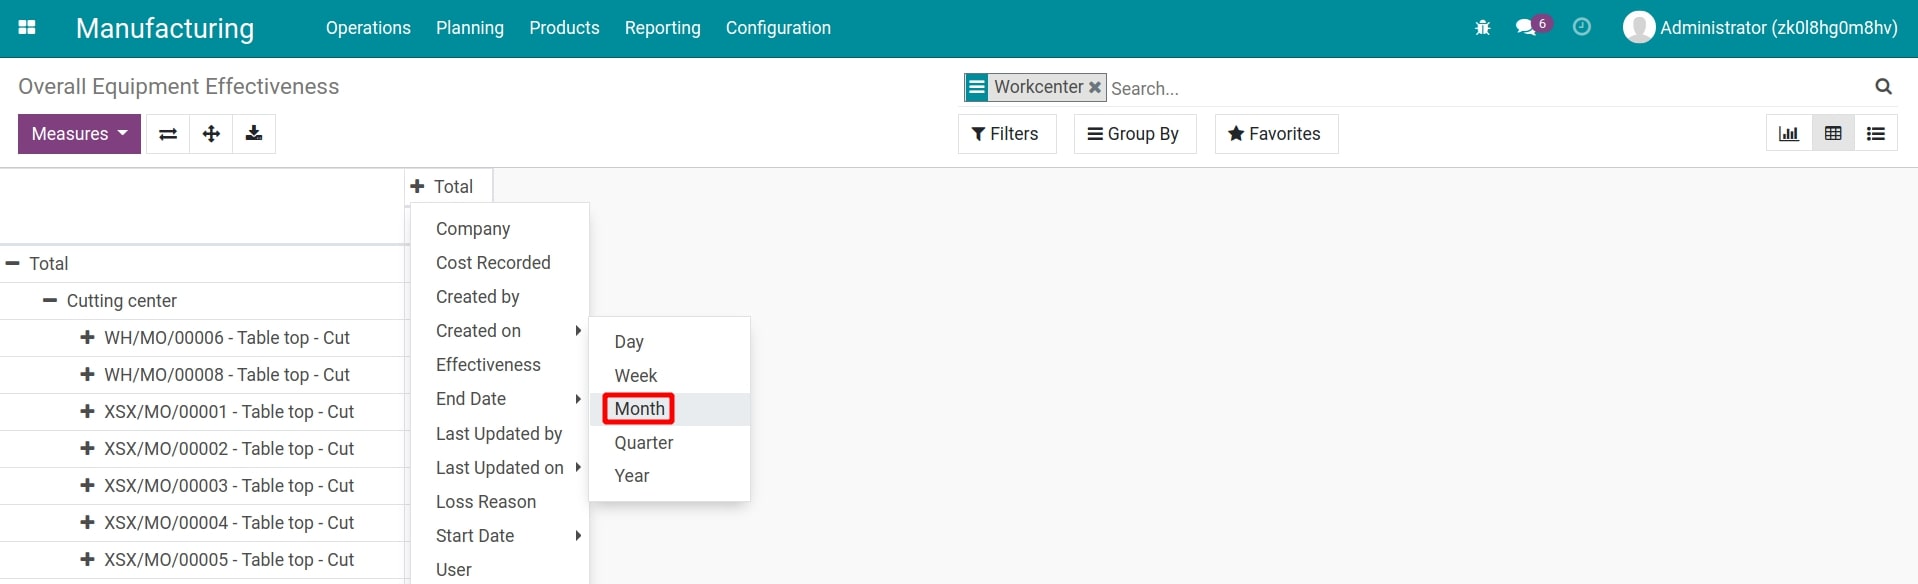
You can also use filters to filter, group by the wanted criteria, or press download to download the report under Excel.
Production Cost Report
The Production Cost Analysis report helps manage and control production costs. It allows for identifying the cost components that make up the product’s cost price. By tracking and analyzing costs, managers can identify underlying issues and implement corrective measures. Navigate to Manufacturing > Reporting > Production Cost Report
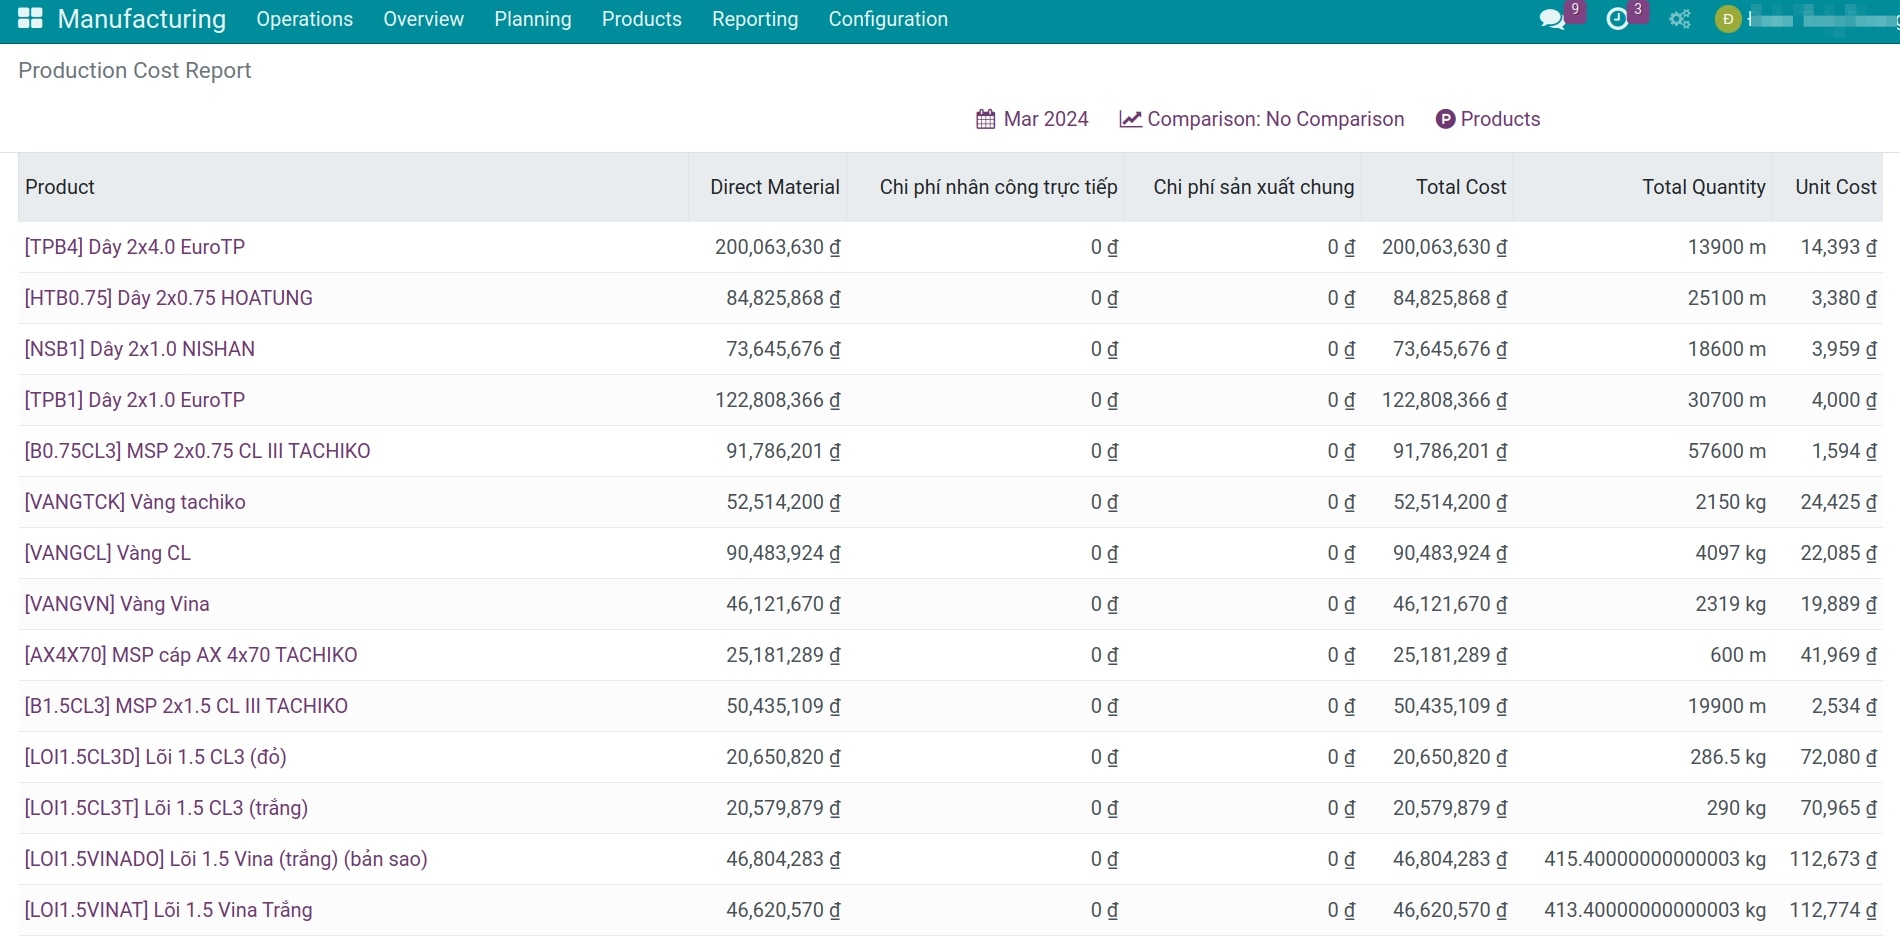
To learn more about the Production Cost Analysis Report, refer to the article Cost accumulation and product cost report.
Note
This report is only accessible to accounts with the Accounting role or higher permissions.
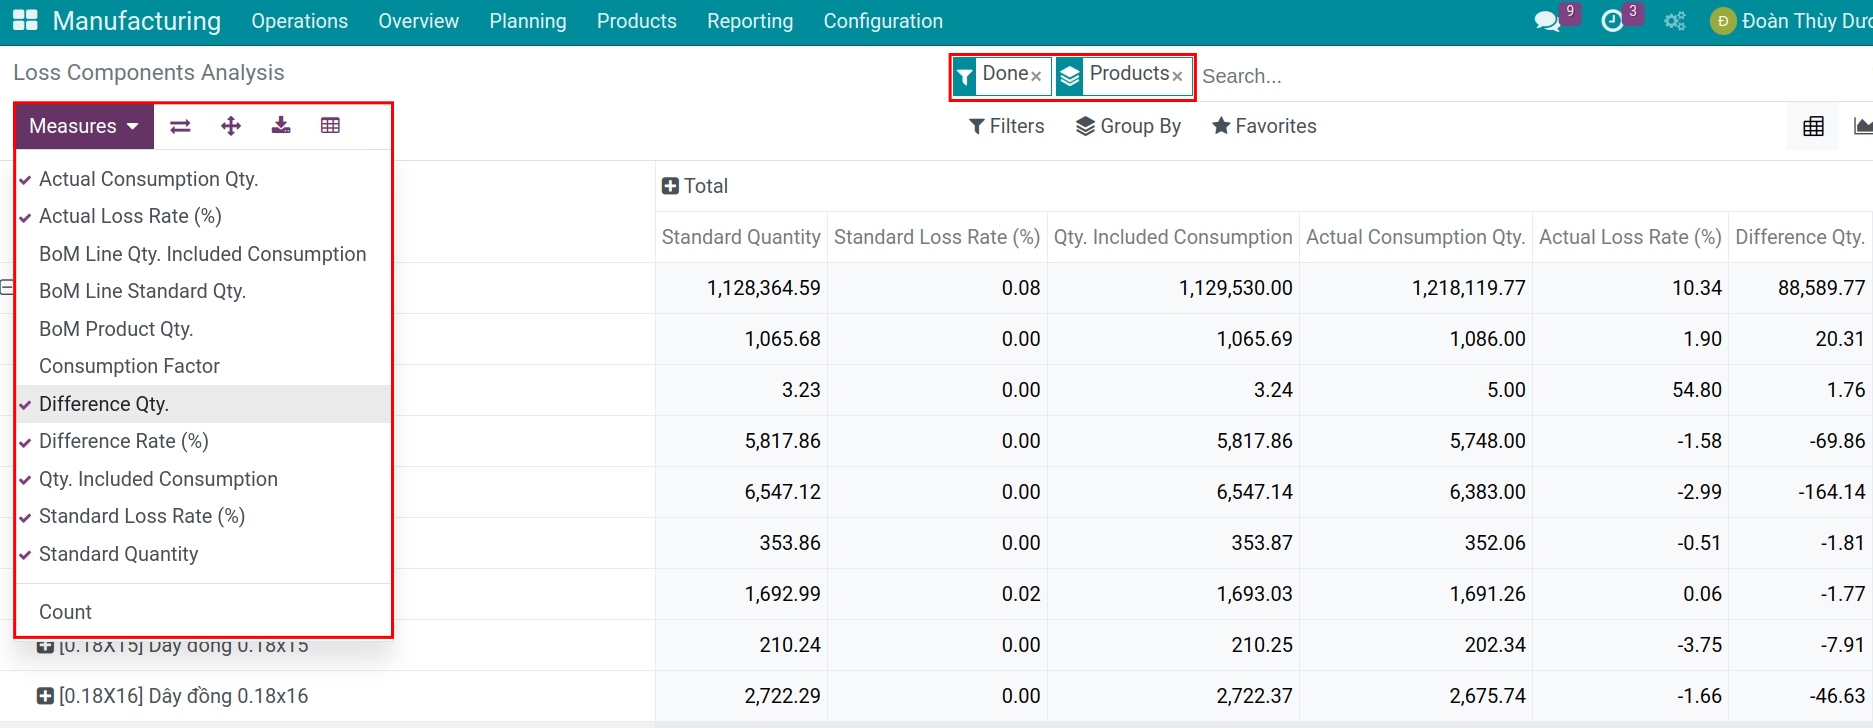
Loss Components Analysis Report
Access Manufacturing > Reporting > Loss Components Analysis to view the report on the scrap rate of materials used in production between the standard and actual values.
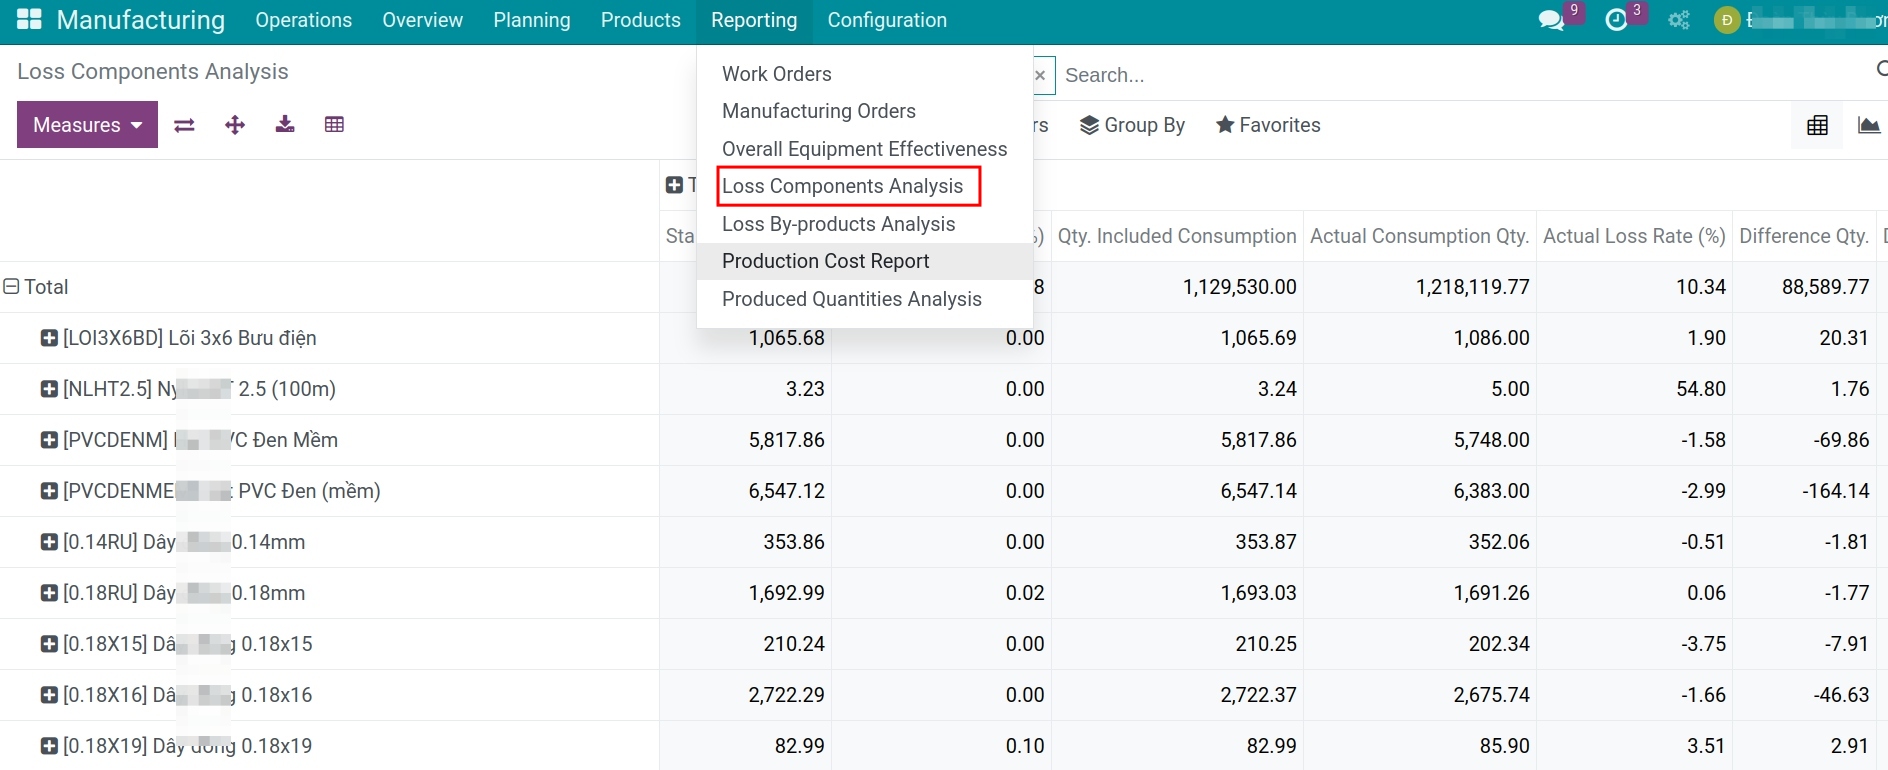
The scope of this guide will focus on instructing you on how to use the report in pivot format.
Use Metrics to display more detailed data with specific numbers.
Utilize filters and groupings to add evaluation criteria. Click on the “+” or “-” icon to expand/collapse the criteria.
See also
Related article
Optional module