Reports of the Marketplace
Requirements
This tutorial requires the installation of the following applications/modules:
You can refer to the article Views and Reports before learning the details of the reports in the Marketplace application.
Note
As a merchant on the Marketplace, you can also view Sales Reports and Commission Fee Reports with data related to you and your stores.
Sales Reports
The sales report in the marketplace provides comprehensive insights into revenue and performance of the merchants over a specific period. To view the sales report, navigate to Marketplace ‣ Reports ‣ Sales Reports.
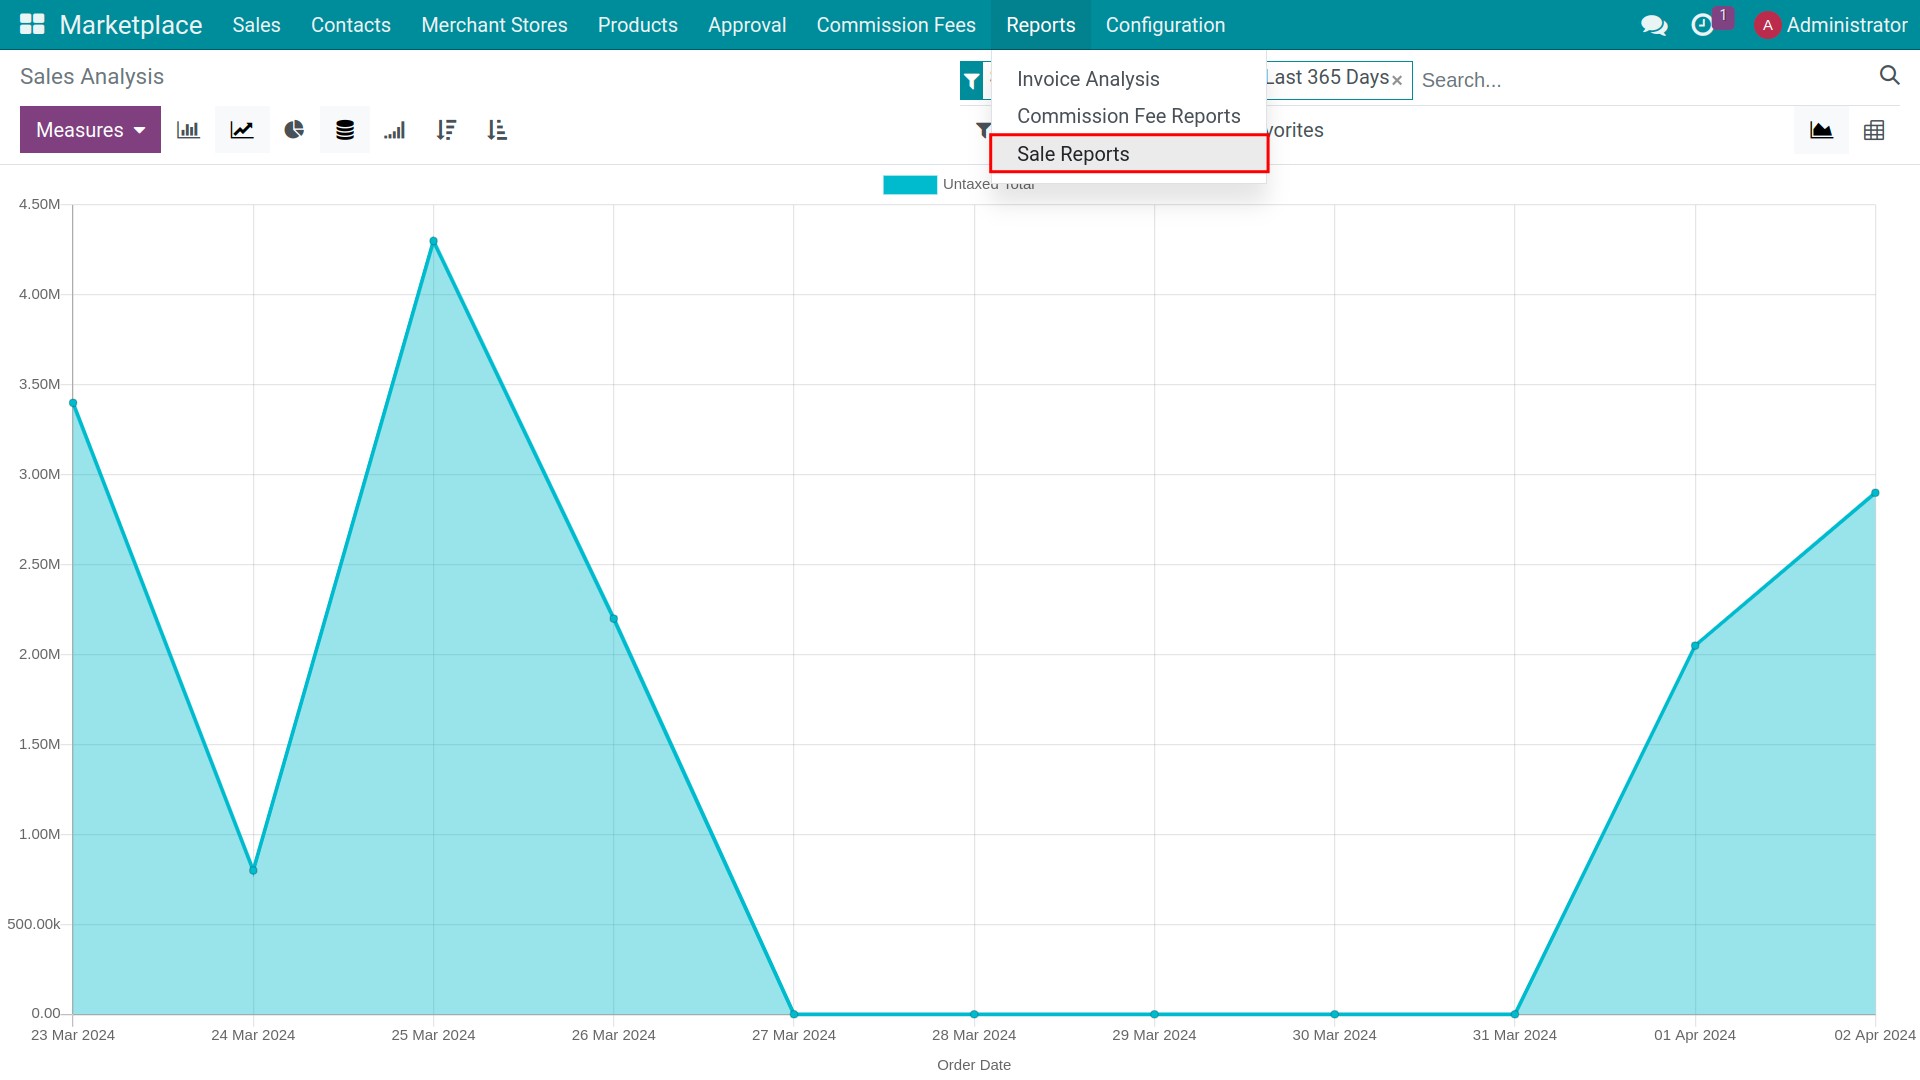
Graph report view
By default, the system will display the report in the graph view. You can also click on Graph icon to go to this view. The software suggests filter: Sales Orders and Order date according to last 365 days.
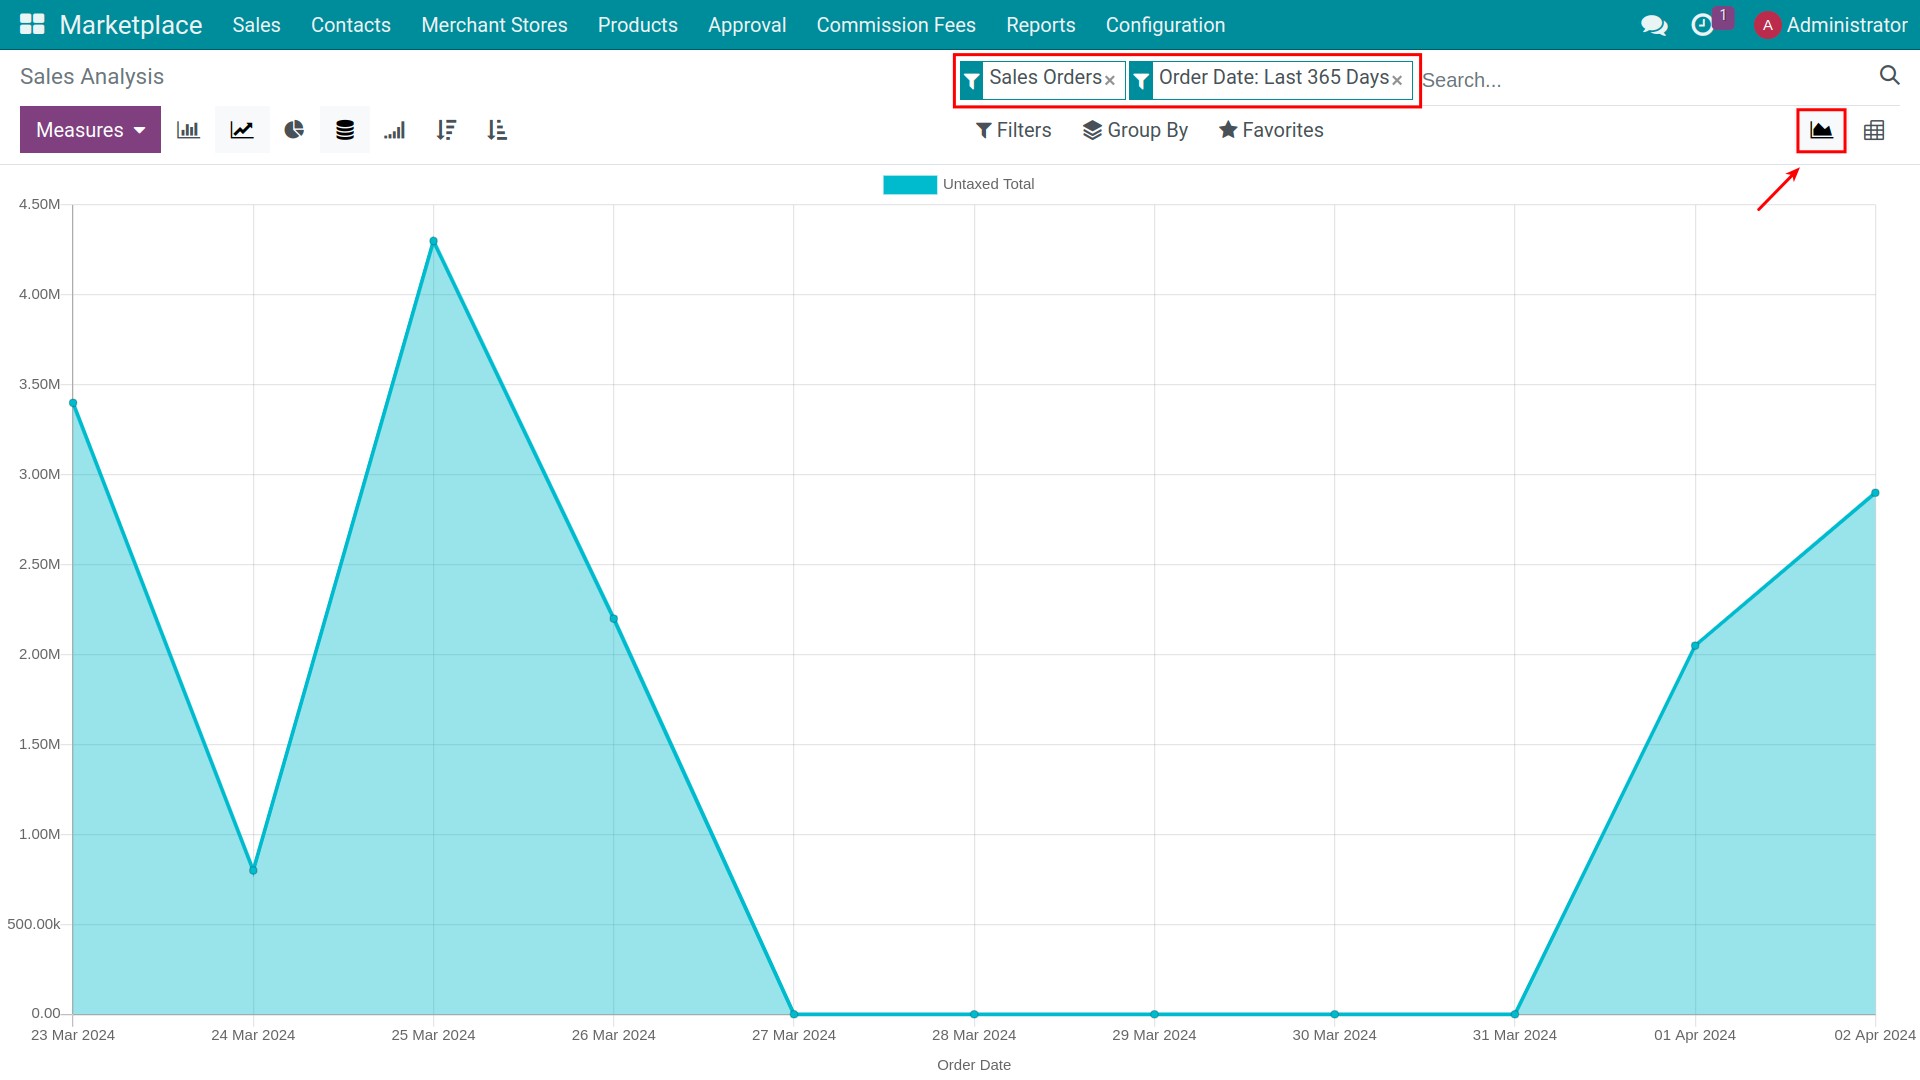
You have the flexibility to use other filters, groups and measures to get the report you want.
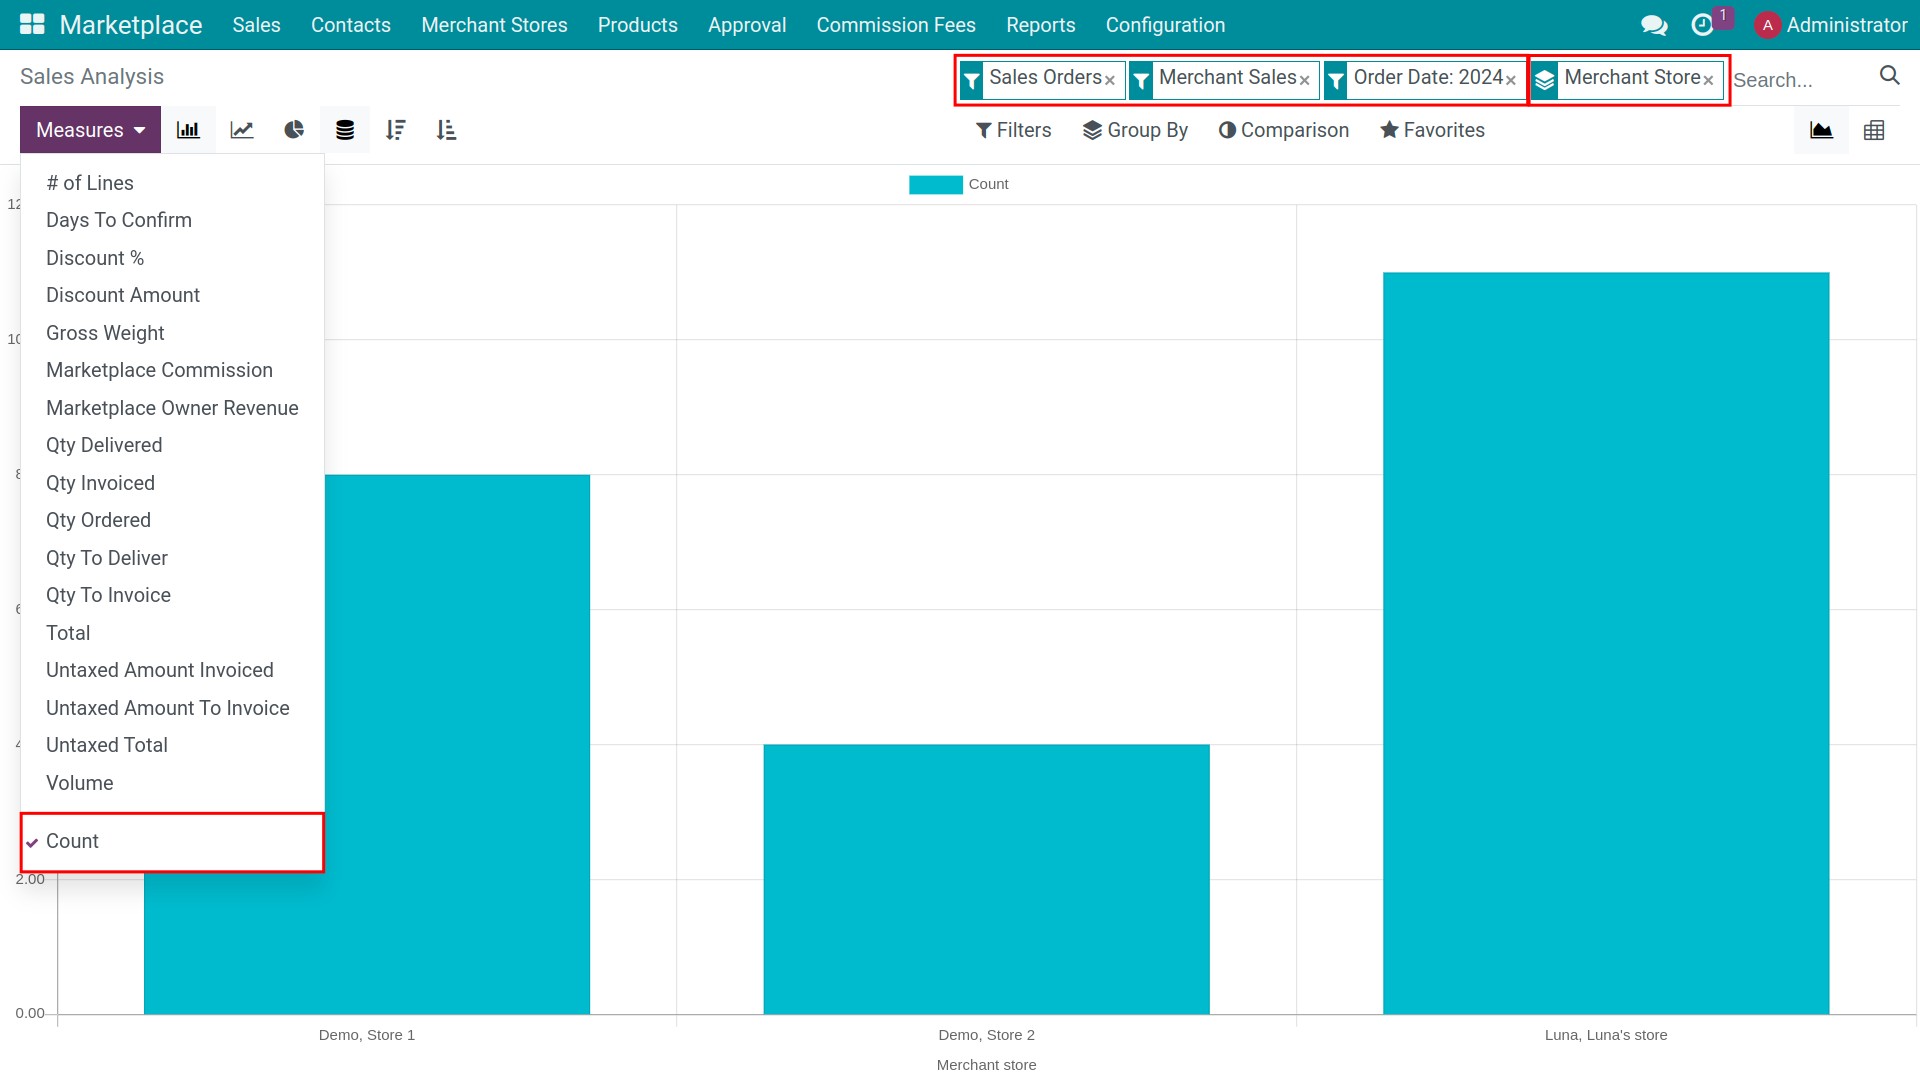
- For example:
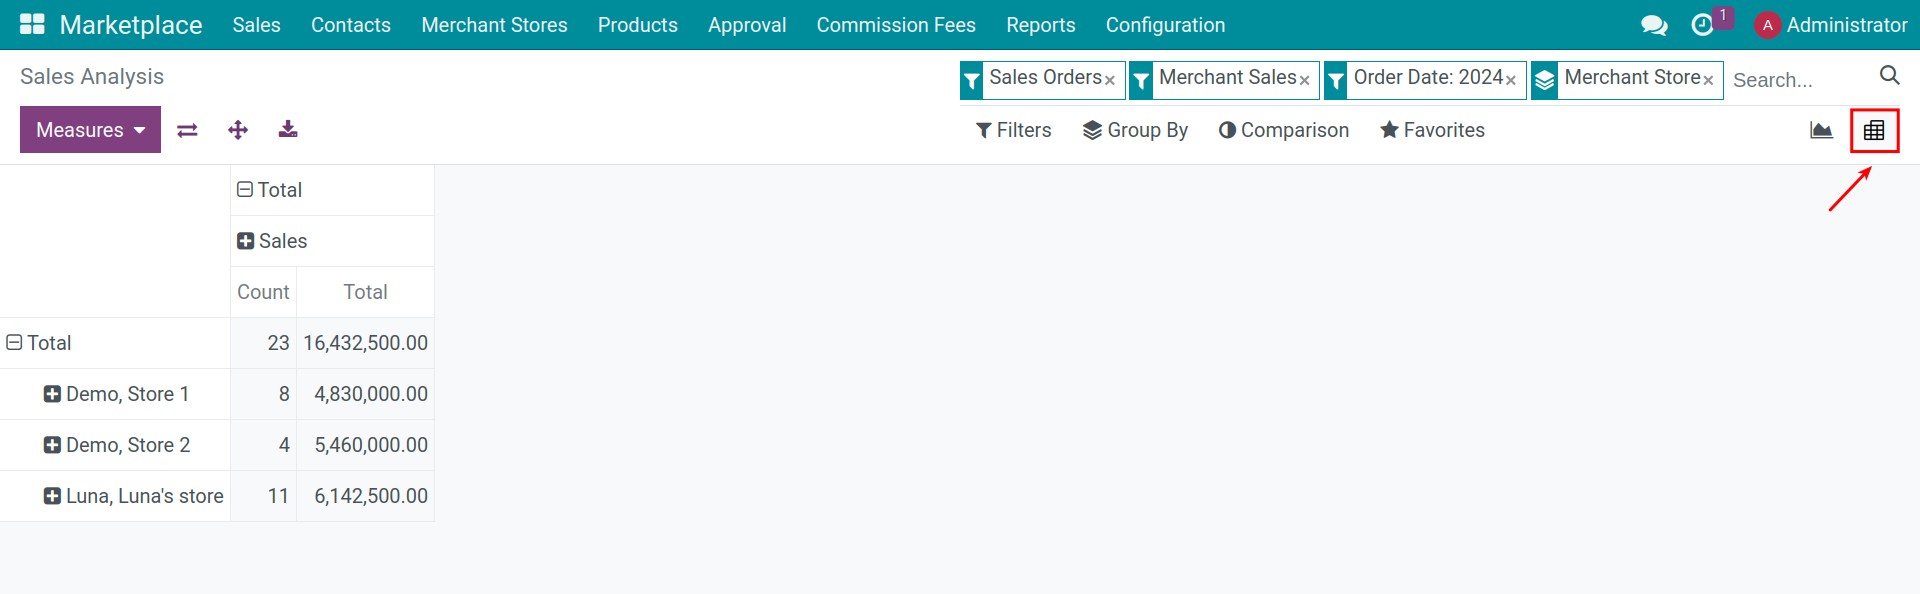
Filter by: Filter by “Sales Orders”, “Merchant Sales” and “Order date in 2024”, the reported data will only be the sales orders belong to the merchant of 2024;
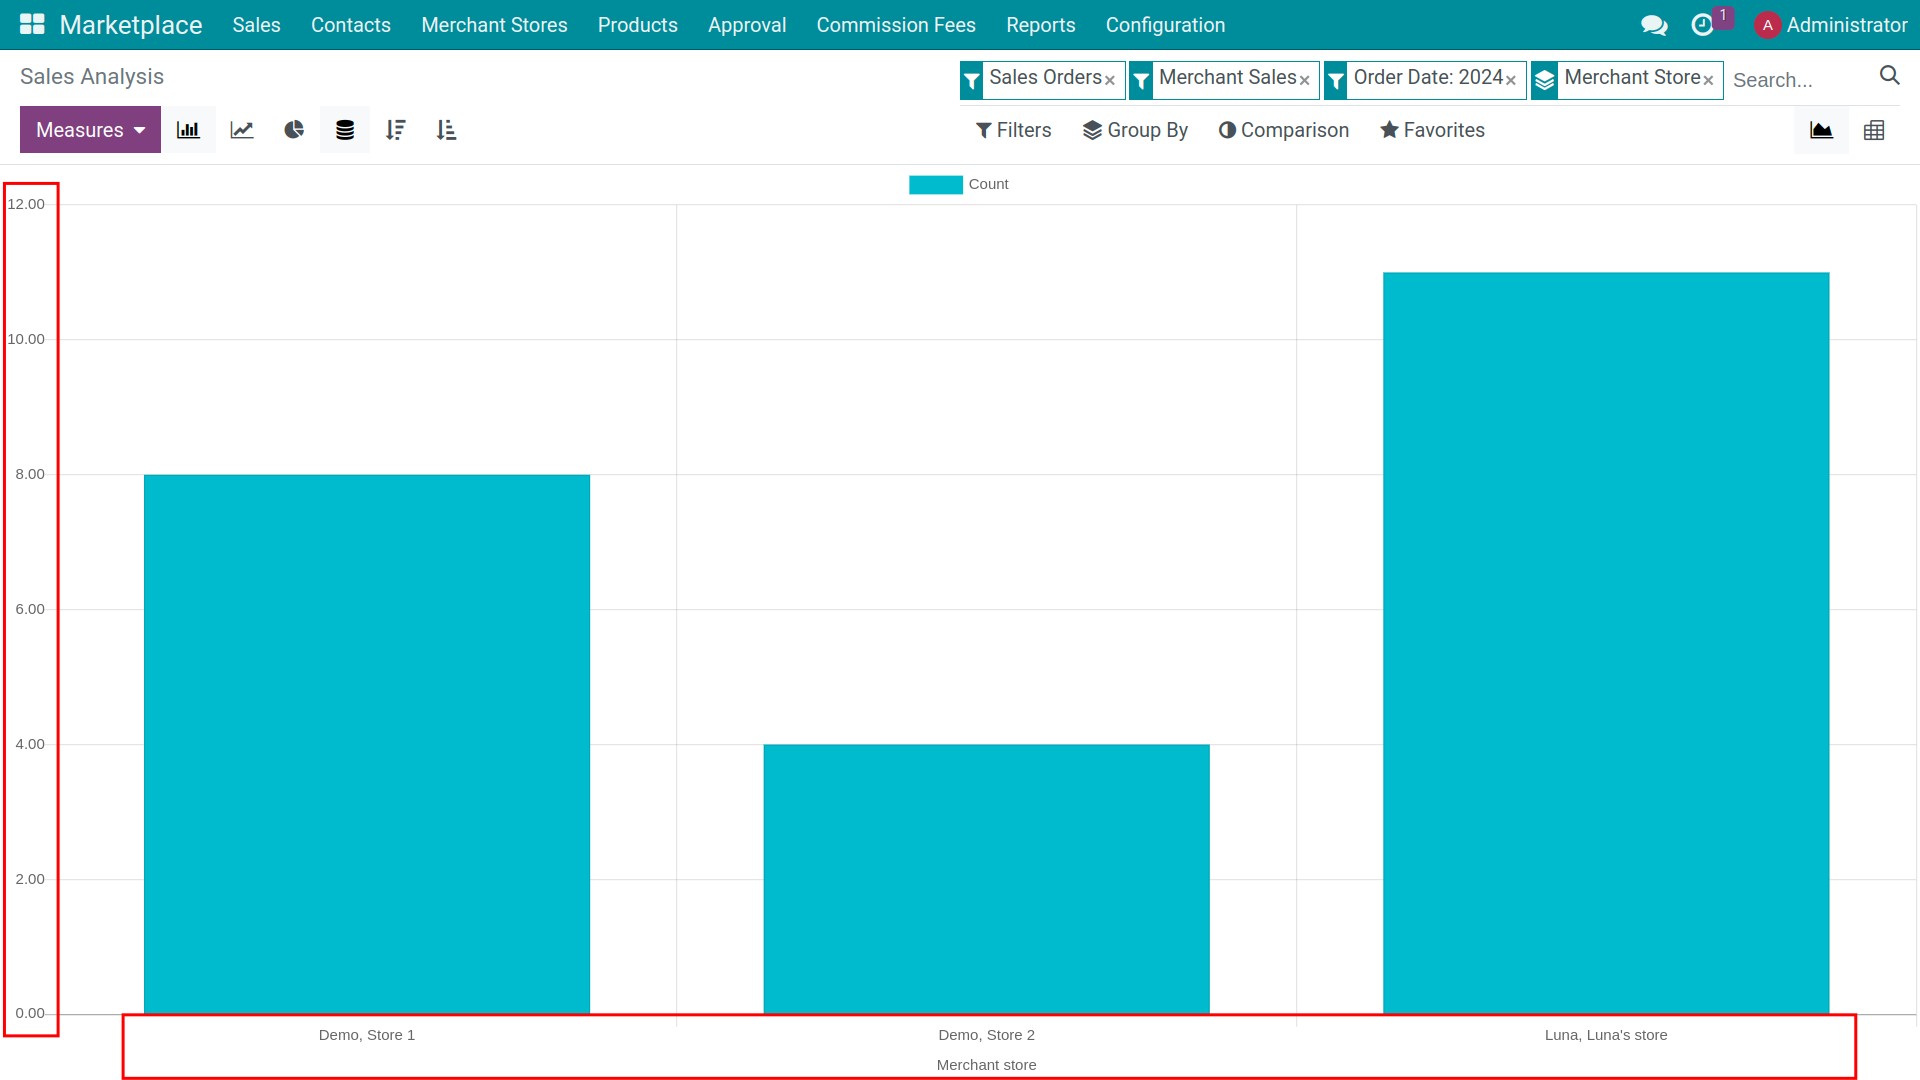
Groups by: Group by “Merchant Store”, the horizontal axis of the report groups the data according to the Merchant Store;
Measure: Select “Count”, the vertical axis of the report displays the number of sale orders.
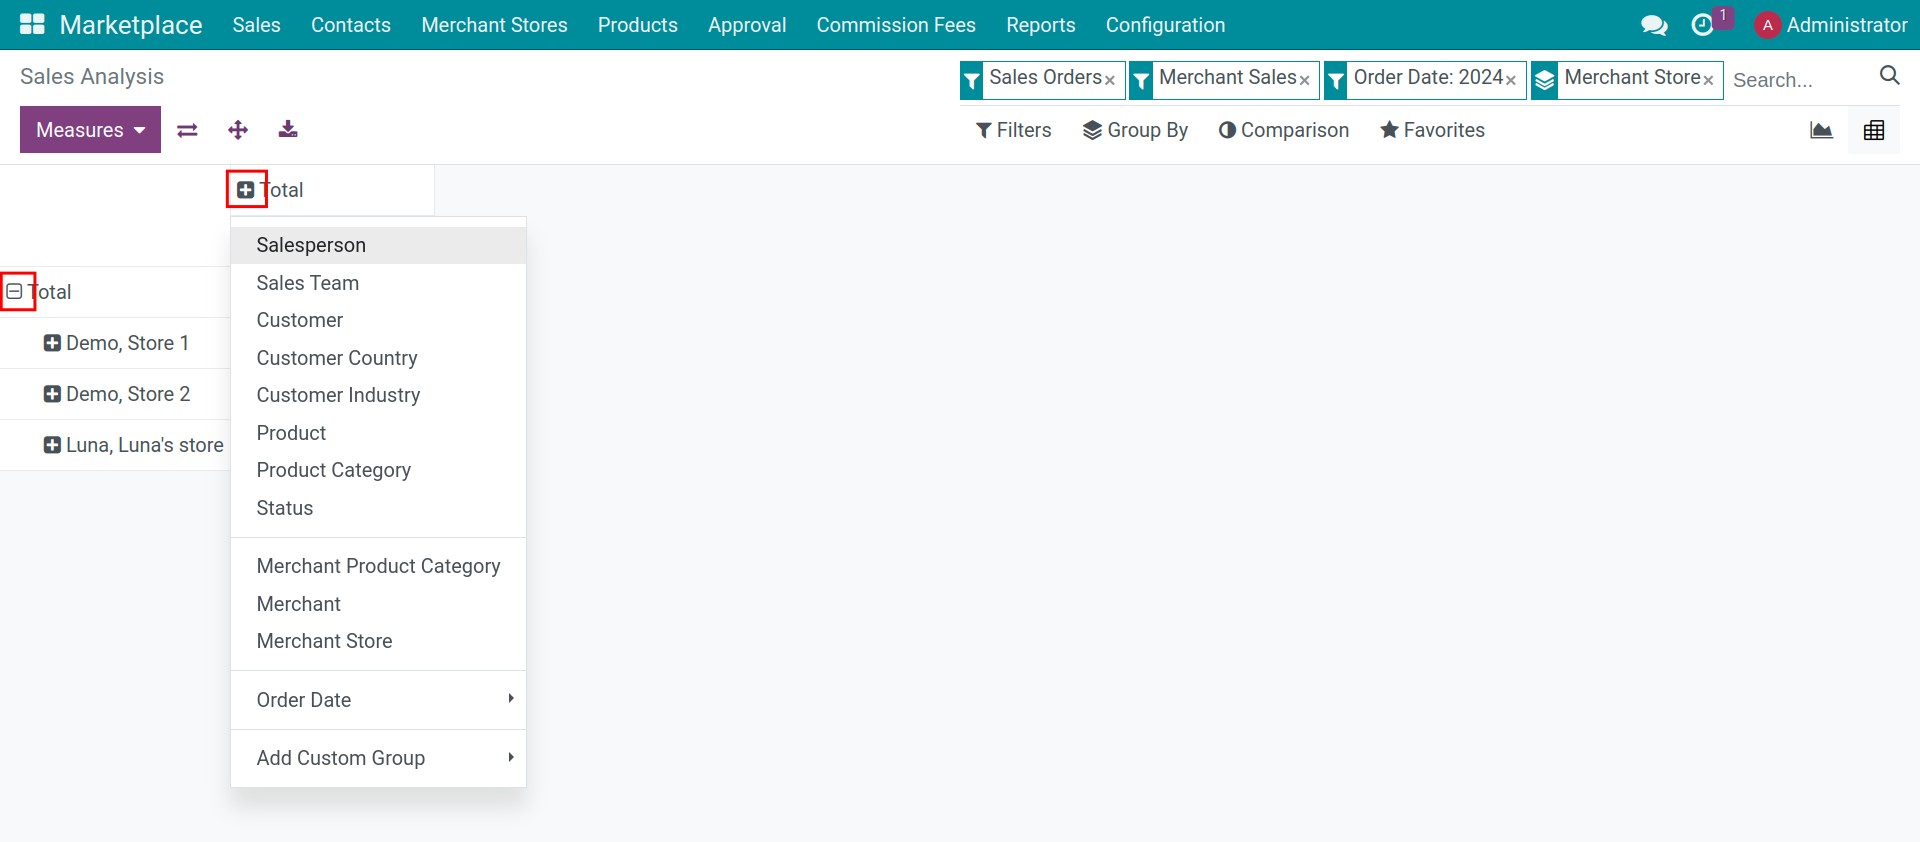
Pivot report view
Click on the Pivot icon to view the report under the Pivot table view. You press on “+” or “-” icon to expend/close the evaluation criteria.
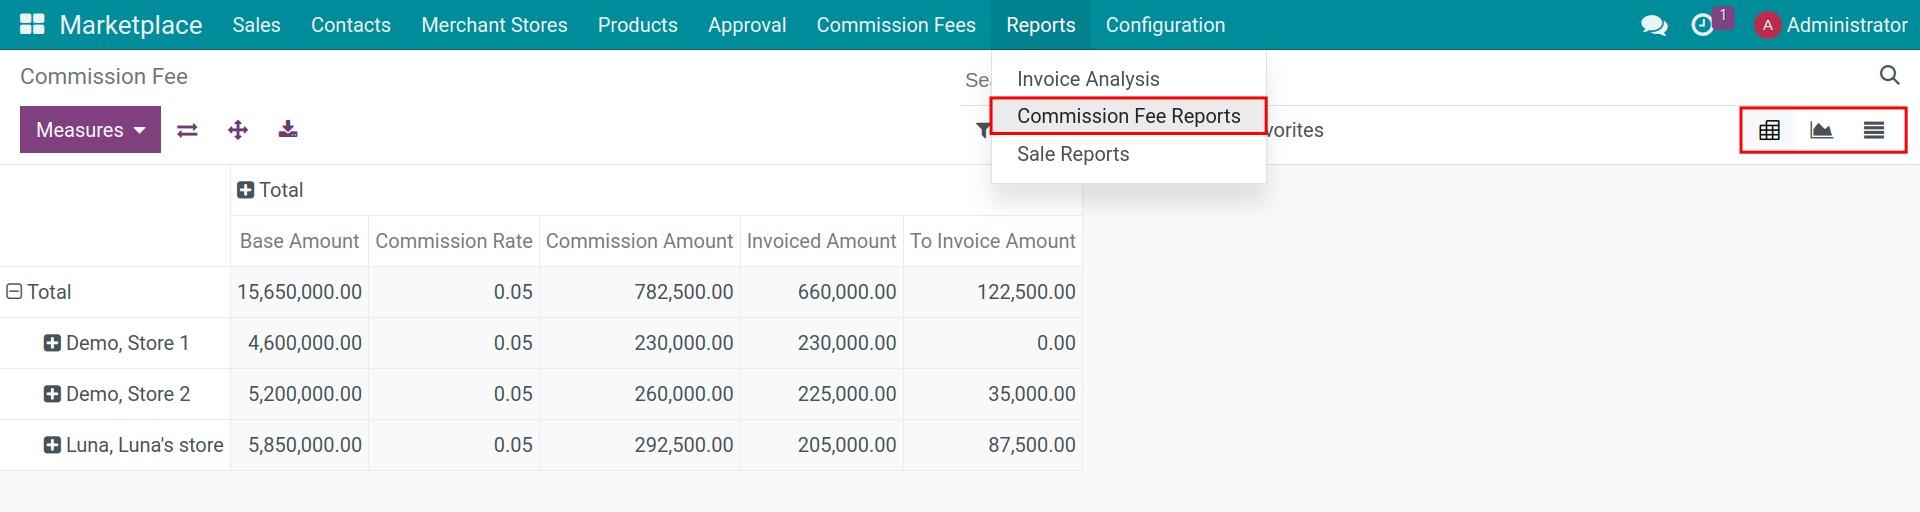
Commission Fee Reports
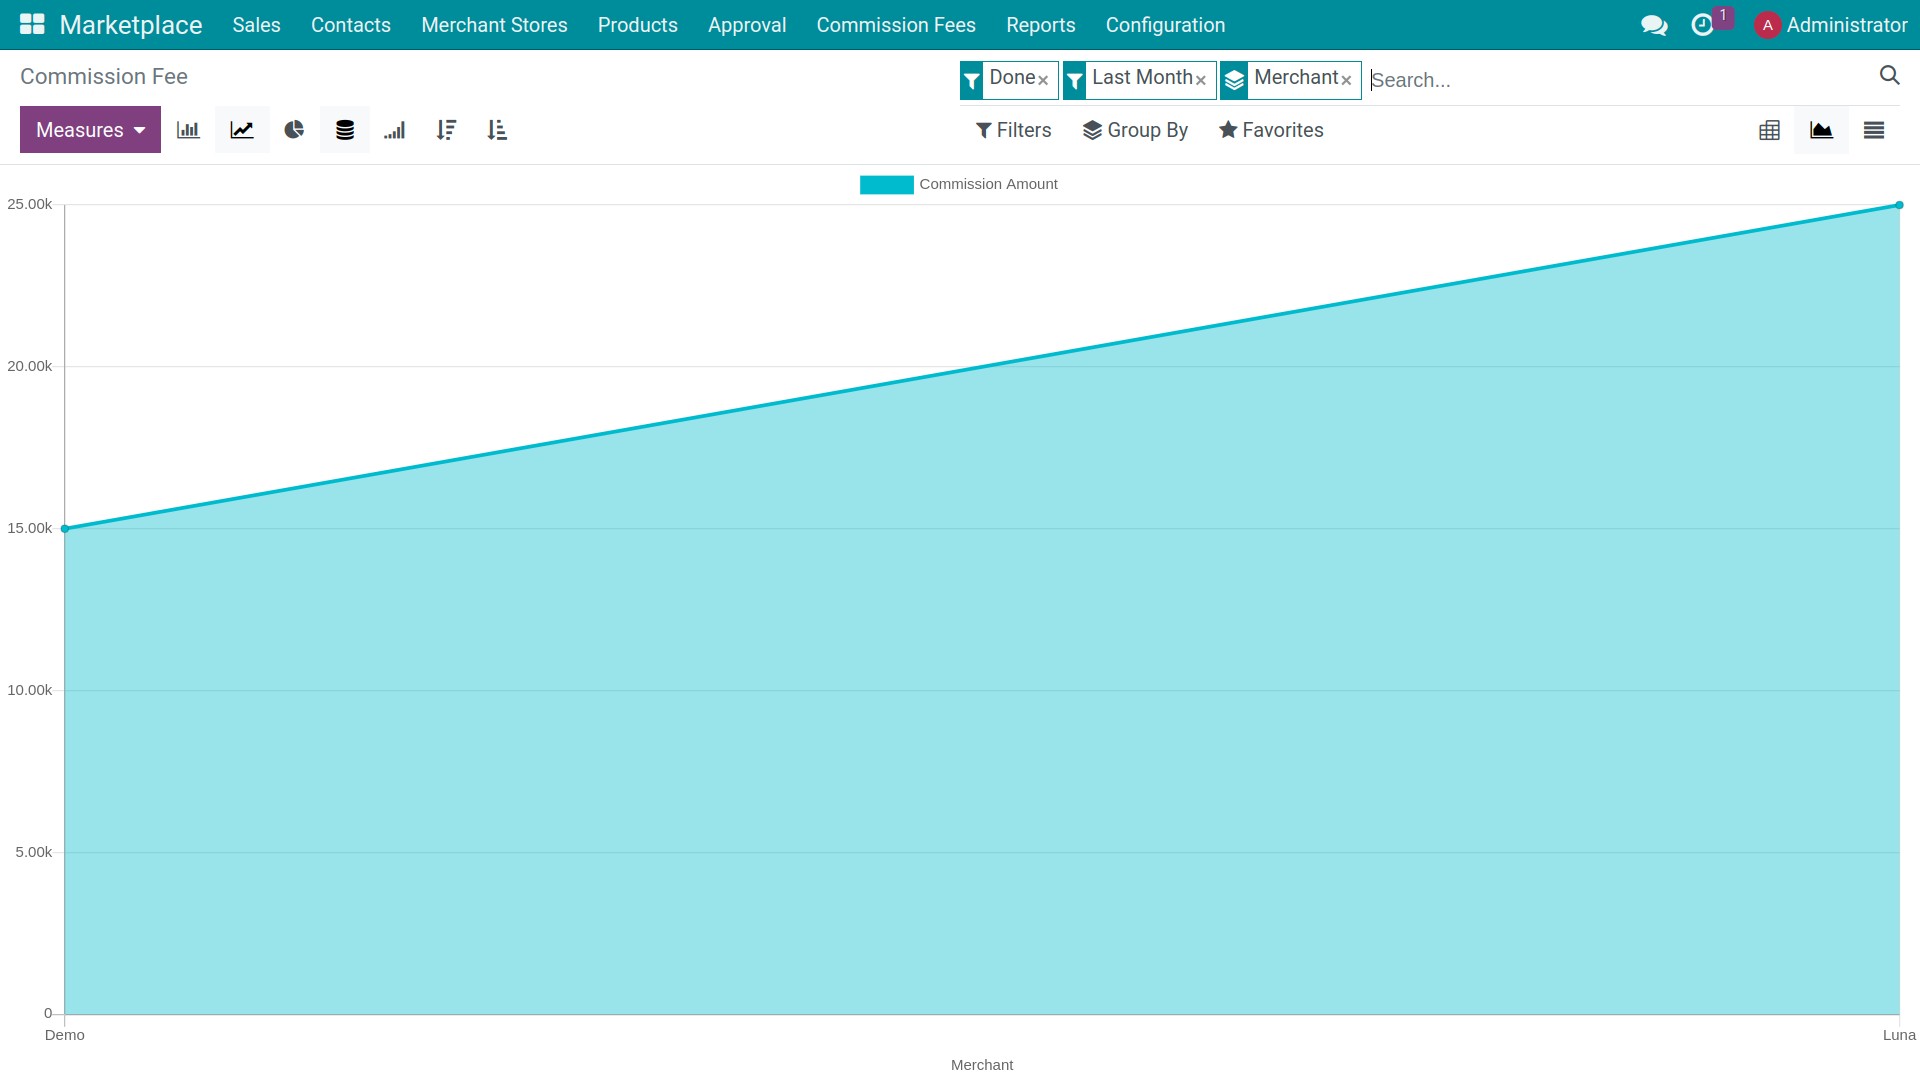
Commission fee report provides comprehensive overview of fees that the Marketplace charges merchants for each successful order generated on the marketplace. Navigate to Marketplace ‣ Reports ‣ Commission Fee Reports to view the report of commission fee. Here, Viindoo supports displaying report under 03 view types: Pivot, Graph and List:
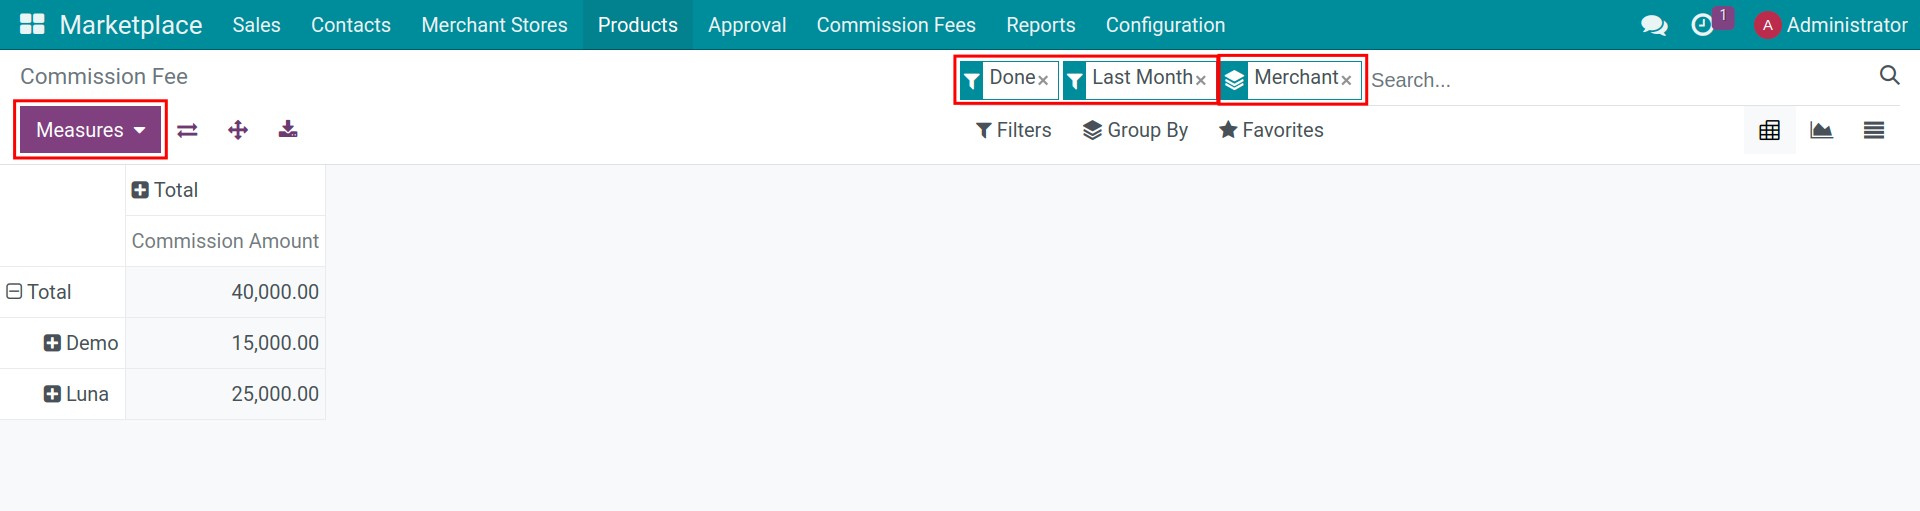
You can use Filters, Group By, Measures flexibly to view the best report for you.
- For example:
Filter by: Filter by “Done” and “Last month”, the reported data will only be the commission fee in Done state of Last month;
Groups by: Group by “Merchant”;
Measure: Select “Commission Amount”.
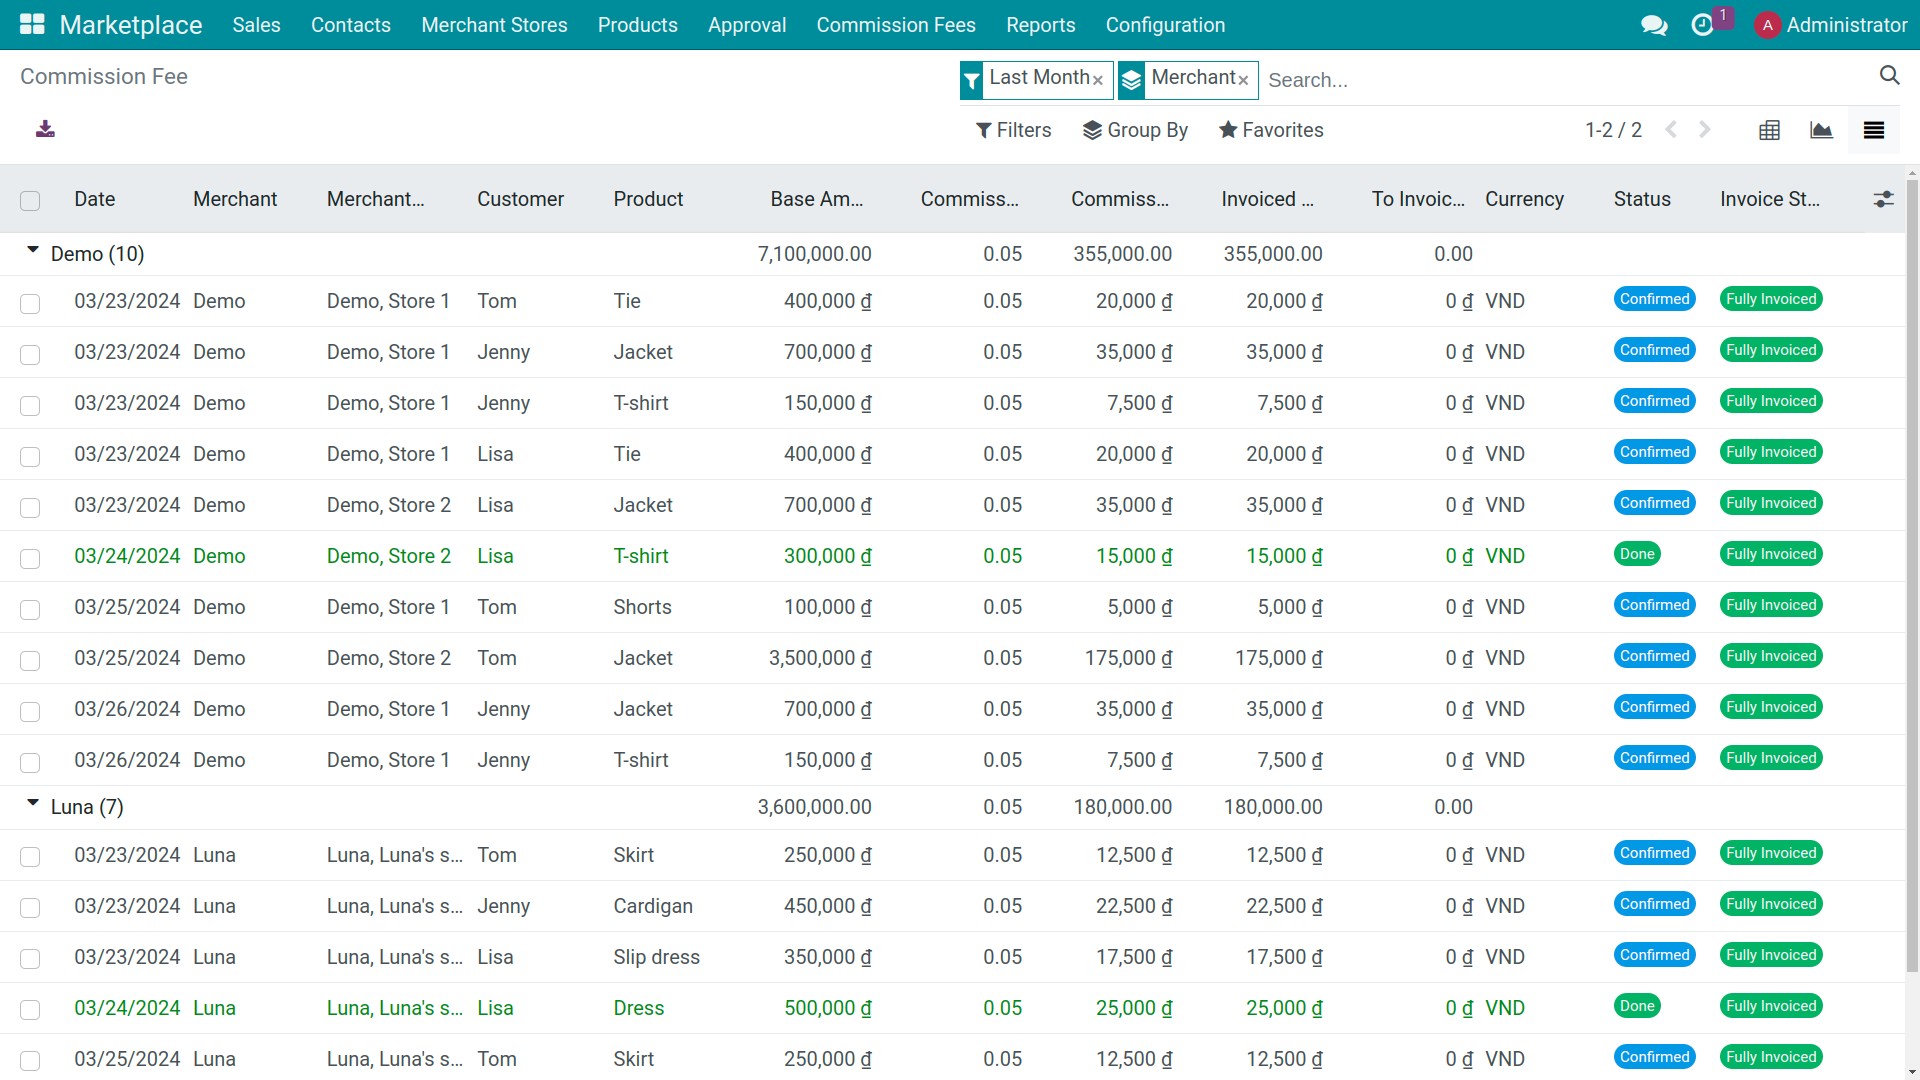
At the list view, in the report you will see following fields:
Date: The date of occurrence of this commission fee.
Merchant: The commission fee will be charged to this merchant.
Customer: The customer who bought something that generates this commission fee.
Product: The product that generates this commission fee when sold
Base Amount: It is the amount used to calculate the commission fee.
Commission Rate: Refers to the percentage applied to calculate this commission fee.
Commision Amount: The amount of the commission fee.
Invoiced Amount: The amount that has been invoiced.
To Invoice Amount: The amount yet to be invoiced.
Currency: The currency unit on this commission fee.
Status: The status of the commission fee.
Invoice Status: The status of the invoice.
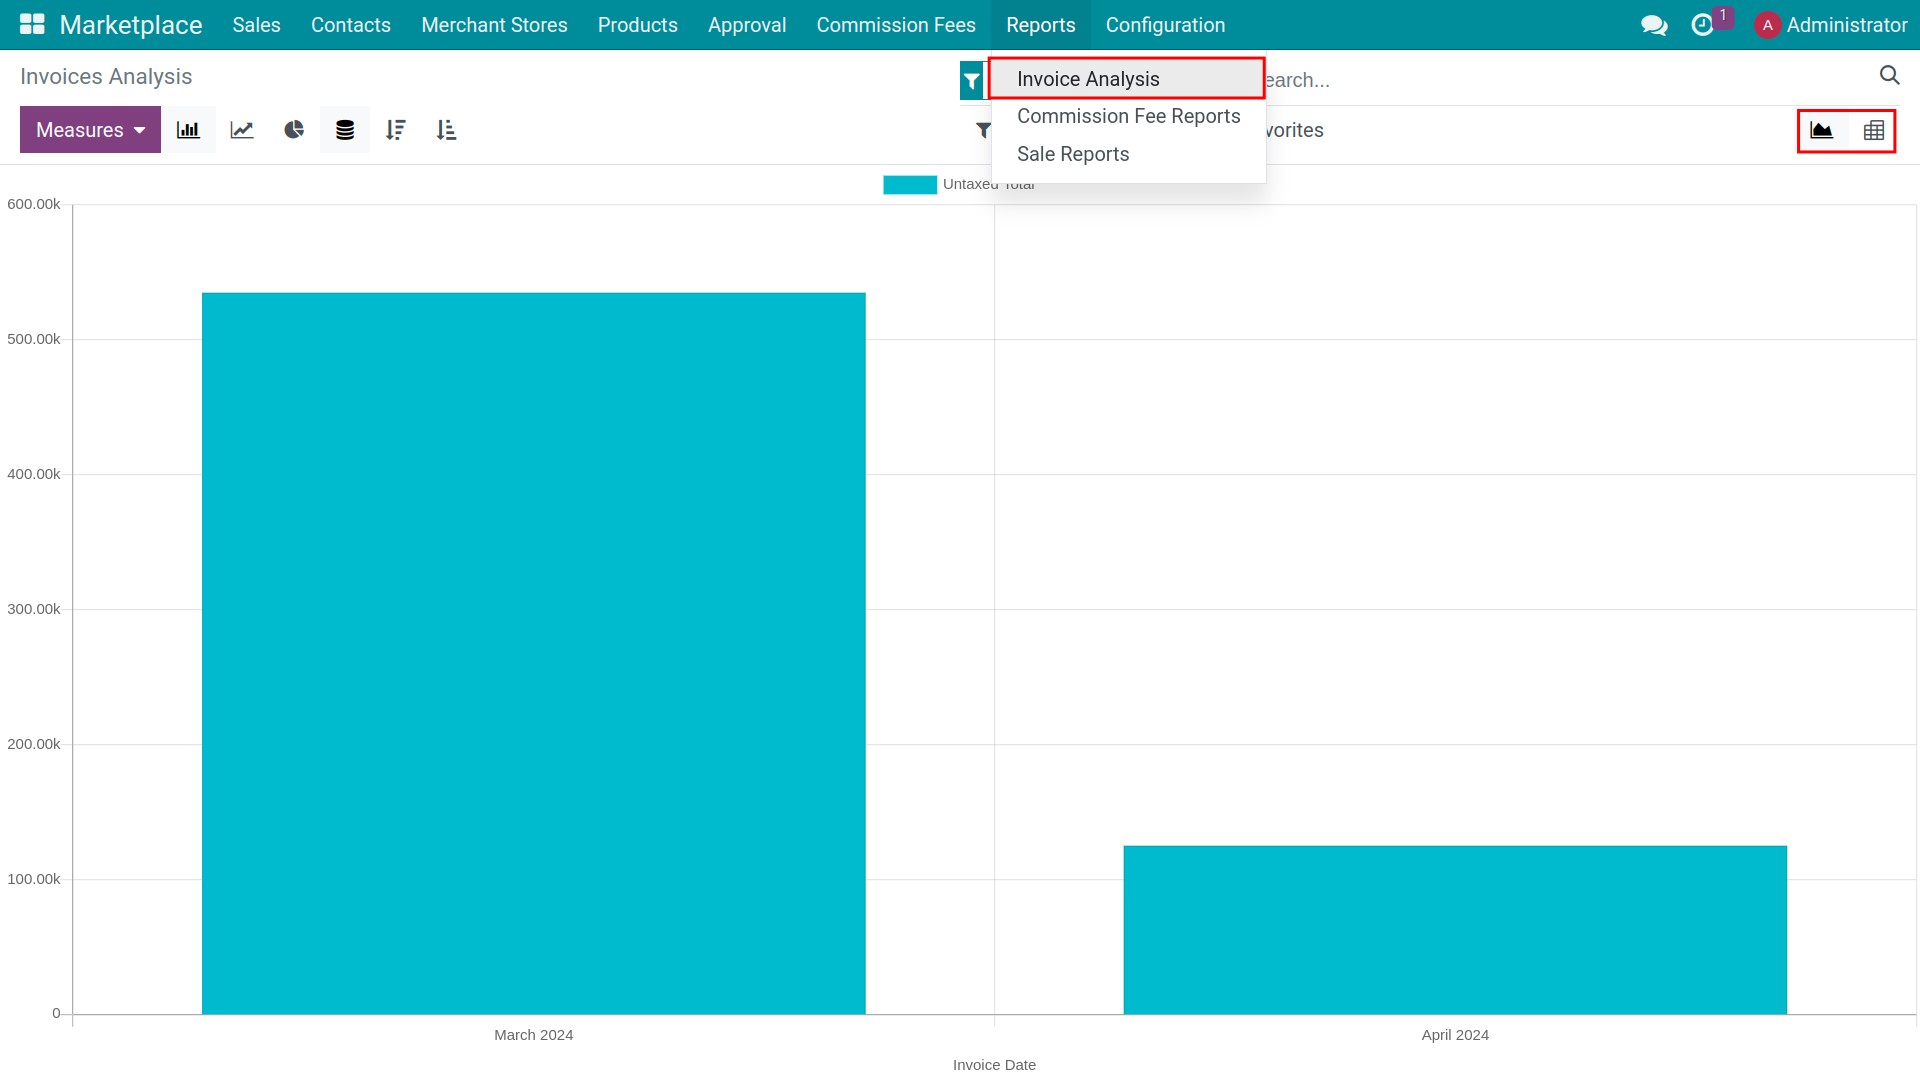
Invoices Analysis Reports
Invoices Analysis Reports offer detailed insights into financial transactions and summaries of invoicing activities within a specified period. To view this report, you need go to Marketplace ‣ Reports ‣ Invoices Analysis. You can view report as a Graph or a Pivot table.
Note
Users with the configured access right as Administrator of the Marketplace app can see the Invoices Analysis Reports. See more at: Overviews of Marketplace in Viindoo.
See also
Related article