Event report in Viindoo
As an event manager, you will have the need to grasp information about an event or series of events in your charge before making decisions.
Requirements
This tutorial requires the installation of the following applications/modules:
Viindoo events app supports the Events and Attendants report with up-to-date and visual data.
Event Report
You go to Events App > Reporting > Events to view Event Reports.
Here you can see two report views which are Pivot Table and Graph.
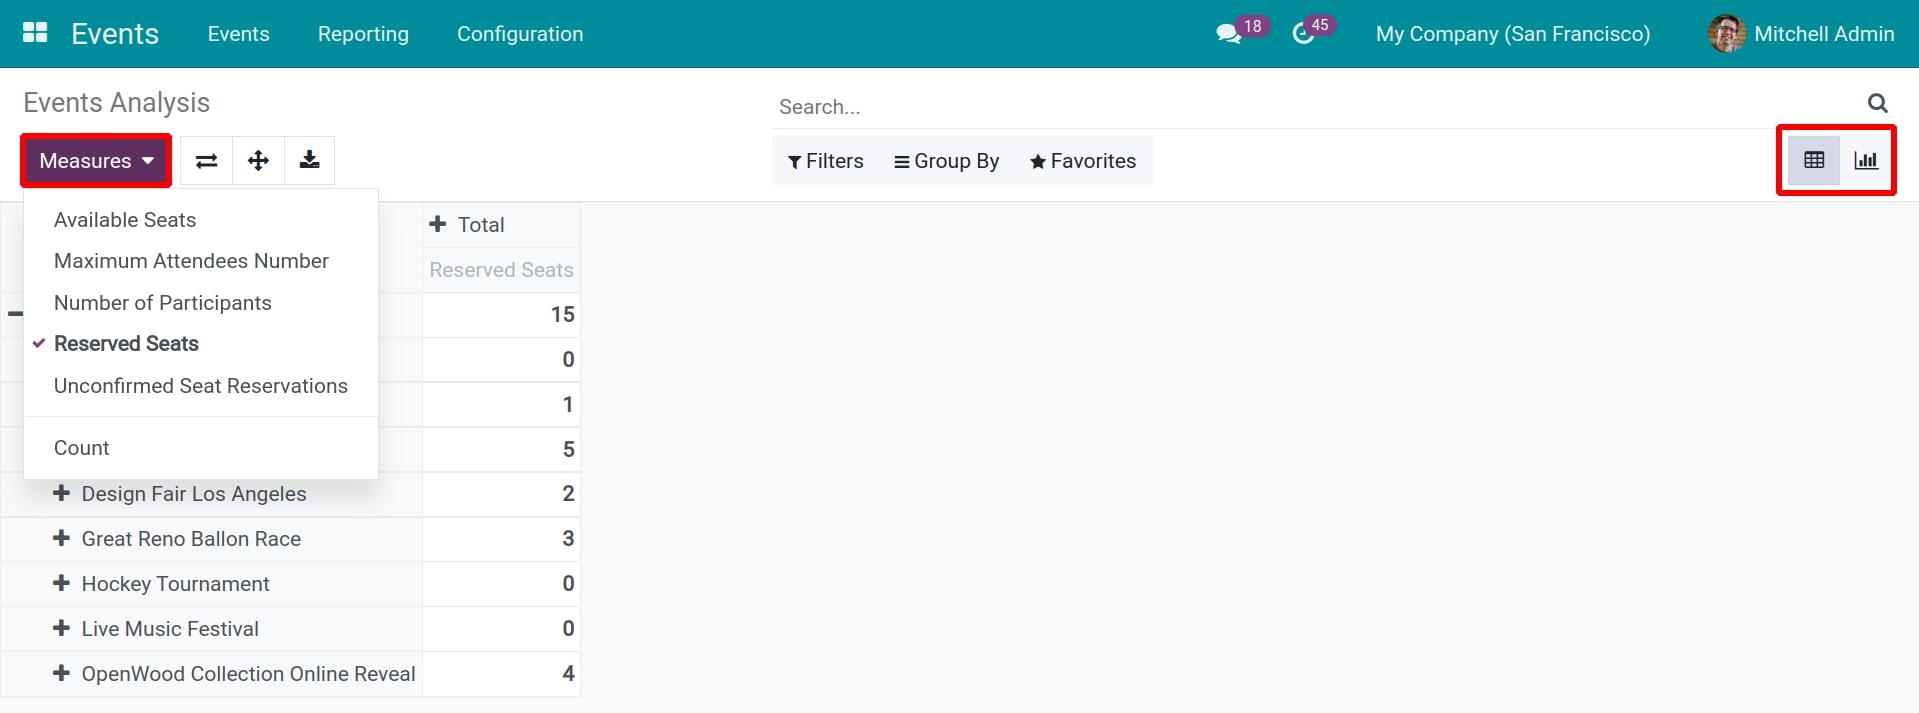
In Pivot Table view, you use Measures to select the parameters.
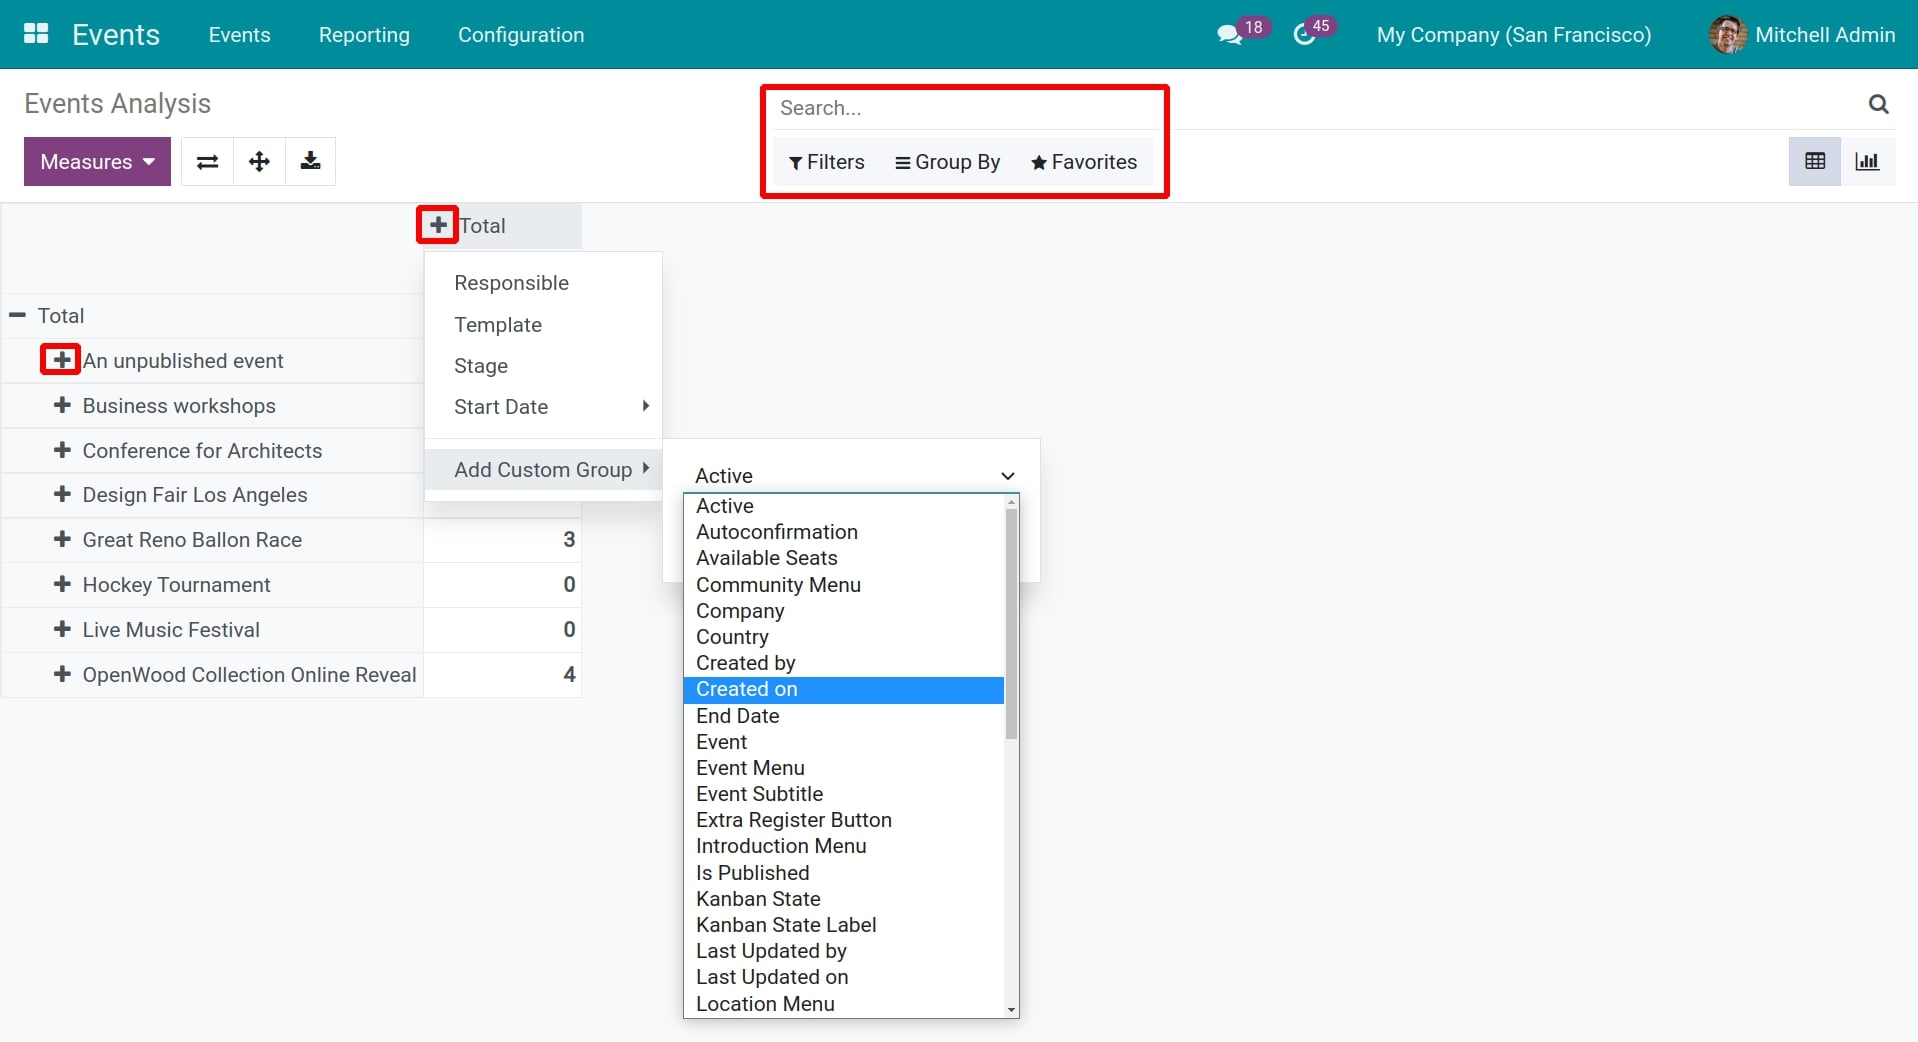
You click the + button to add the criteria for the report and use the filter, grouping tool to filter out the information or group by the criteria as your demand.
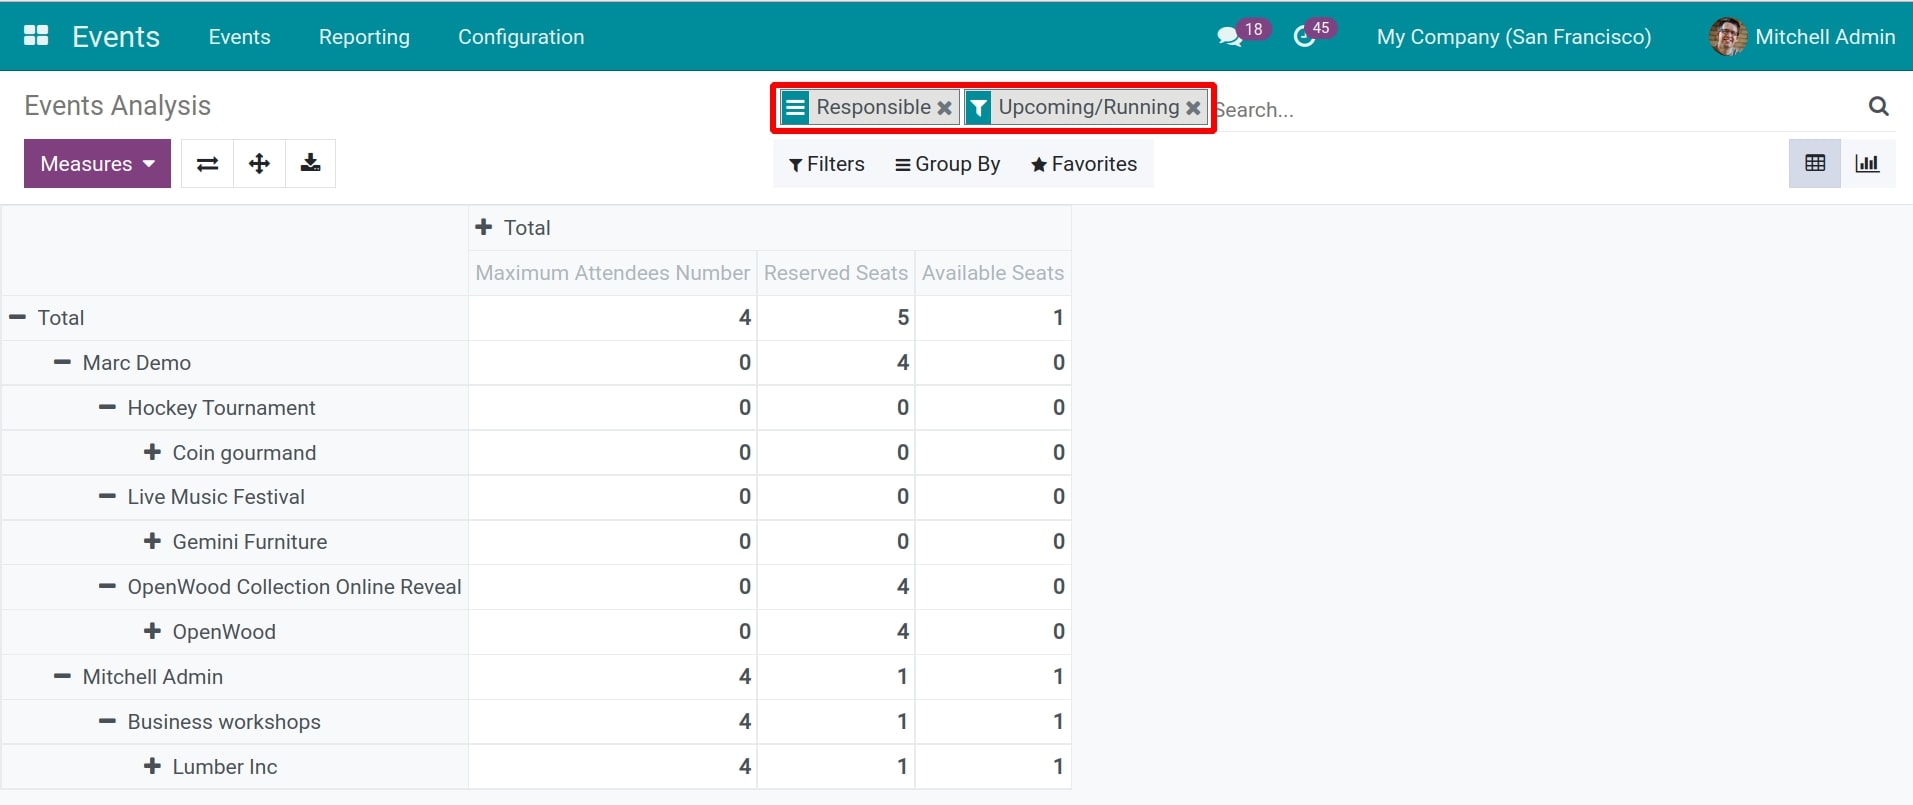
For example, you can see the current or upcoming events including organizers, responsible, maximum attendees number, reserved seats, and available seats in the Event report as follow:
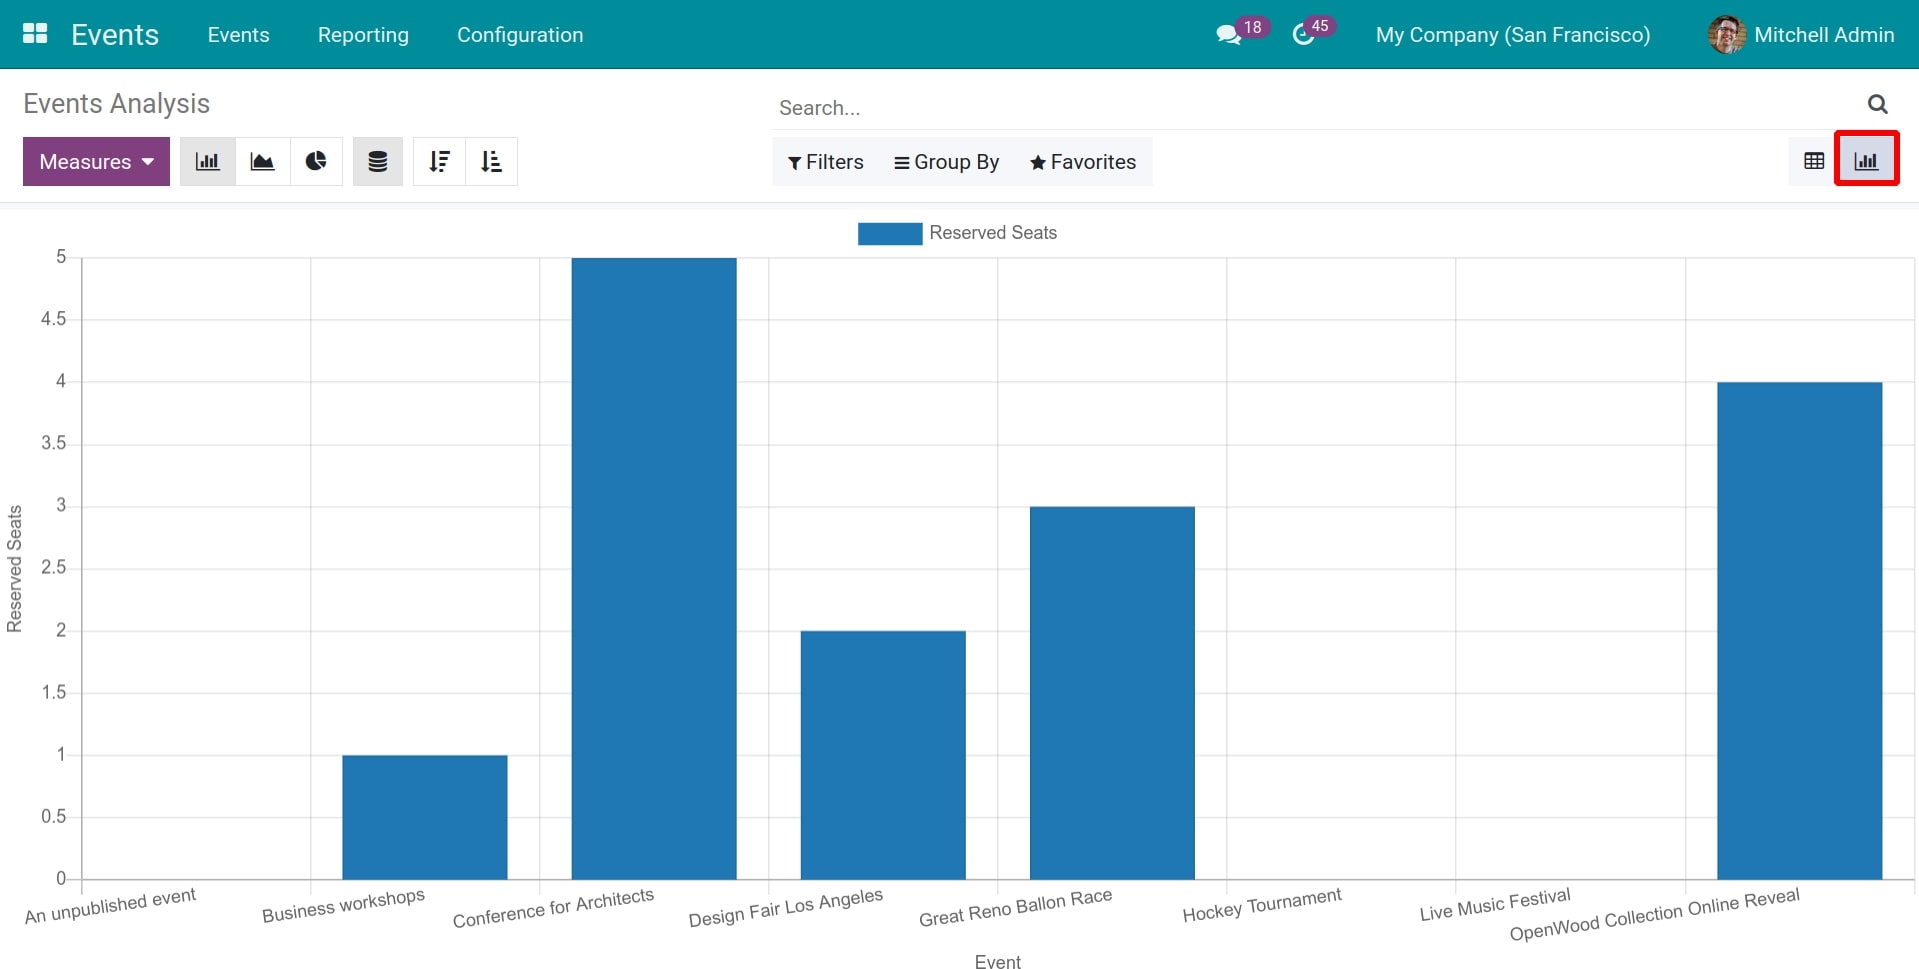
You can also view the Events Report as a chart for more visibility of the company events.
Attendee Report
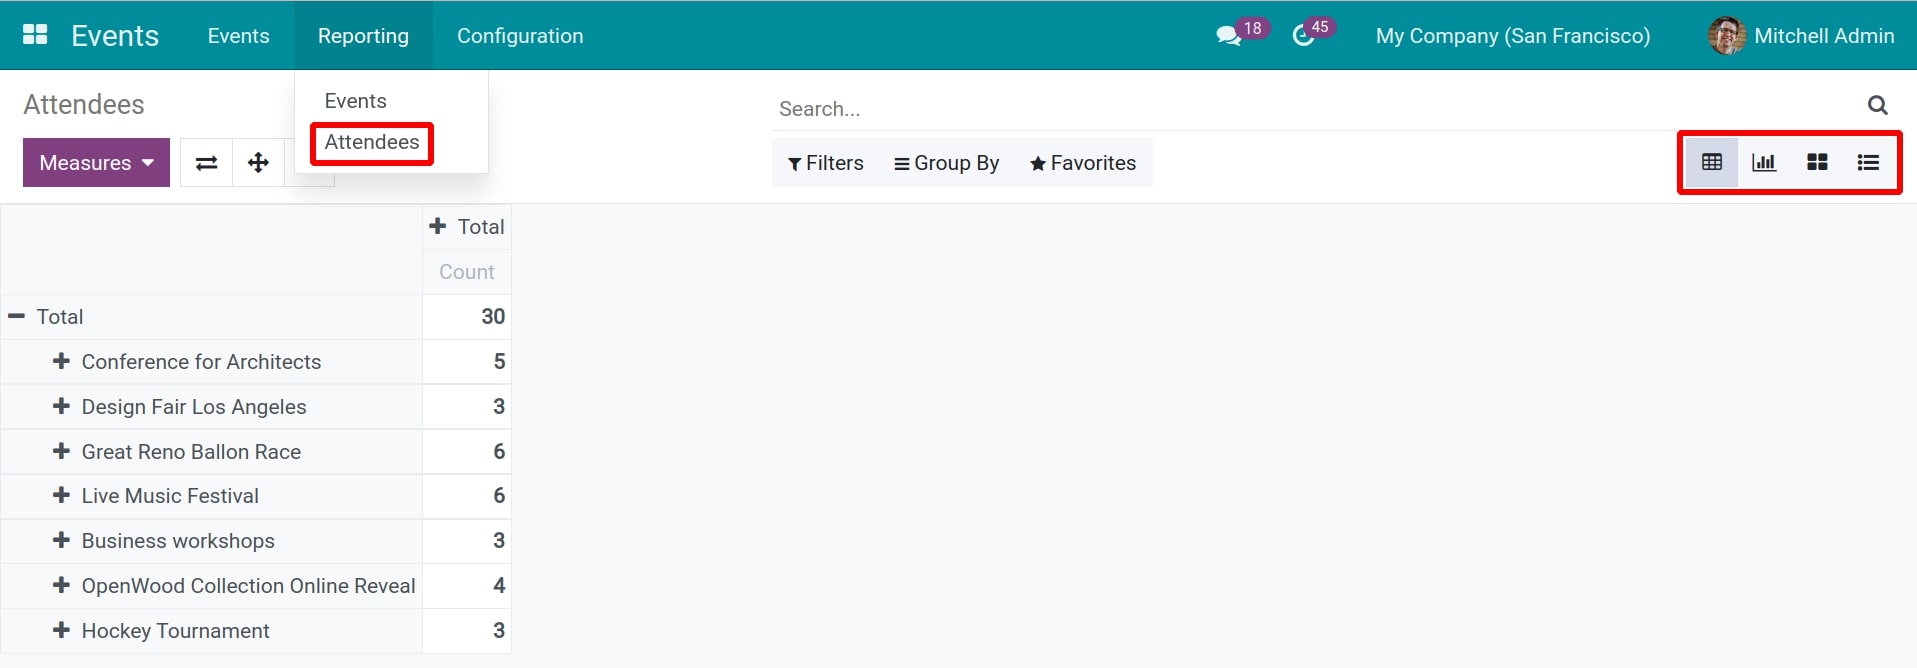
You go to Events App > Reporting > Attendees to view Attendee Reports of events.
The system supports 4 report views which are Pivot Table, Graph, Kanban and List.
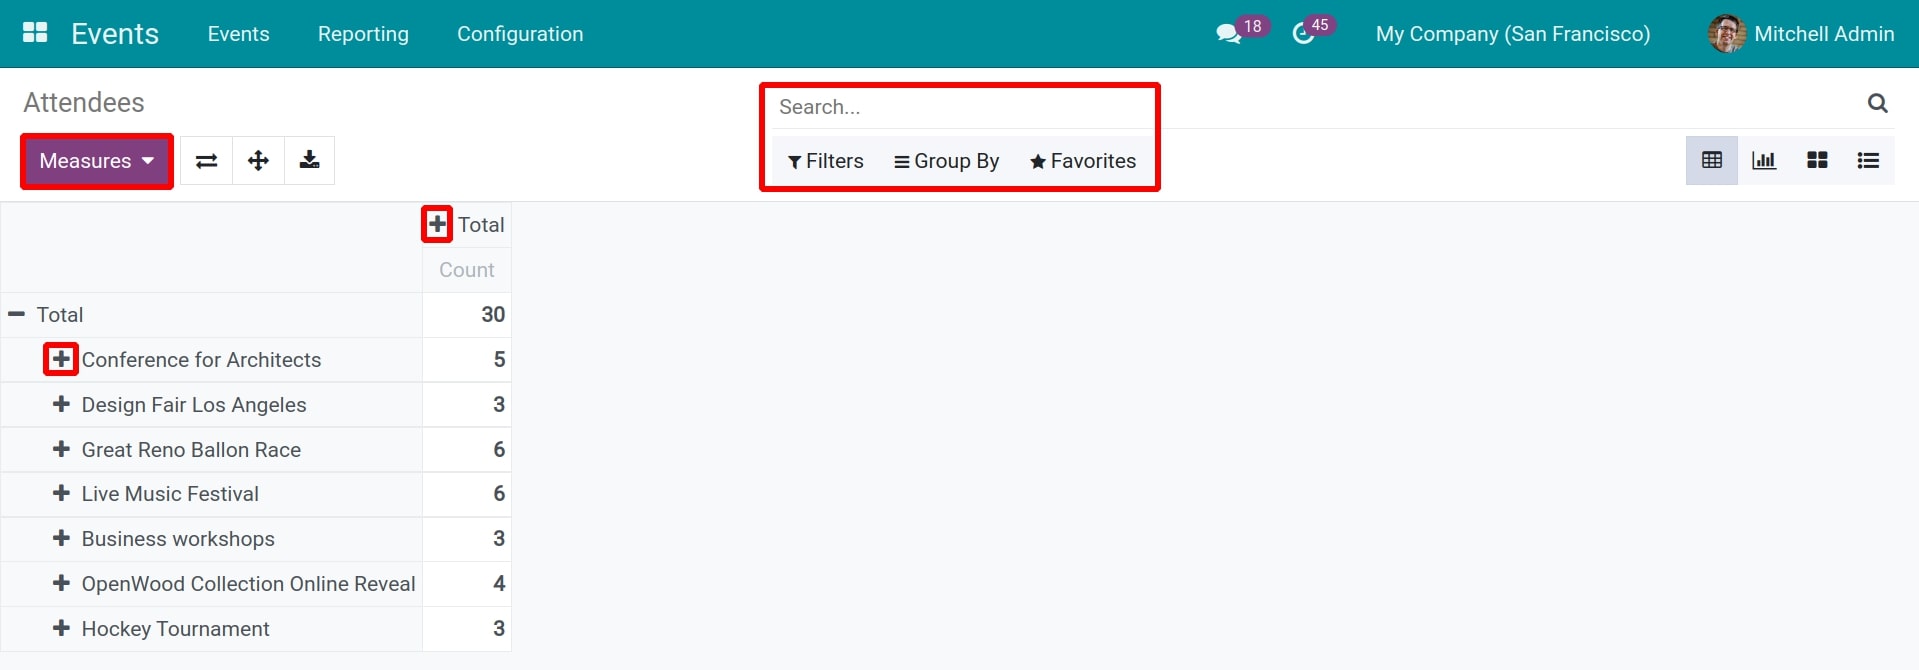
Similar to the Event Report, you can use Measures to select the parameters for the report, click the + button to add the criteria, or use the filter and grouping tools.
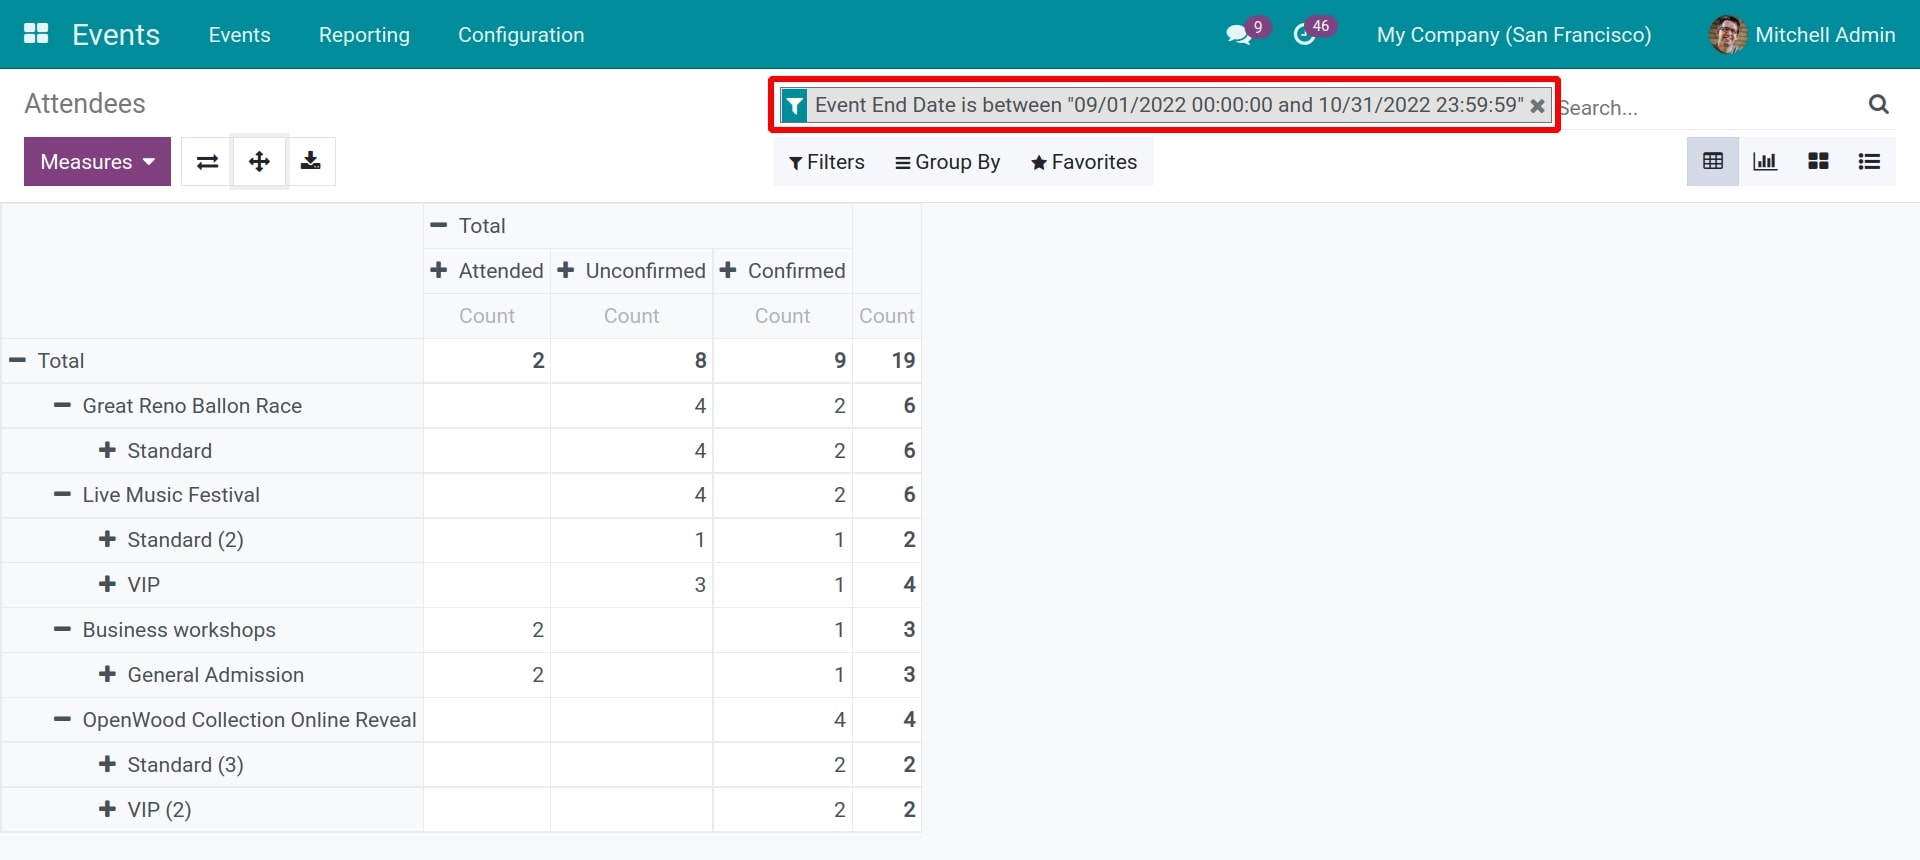
For example, you can see the event registration status report for a period of time as follow:
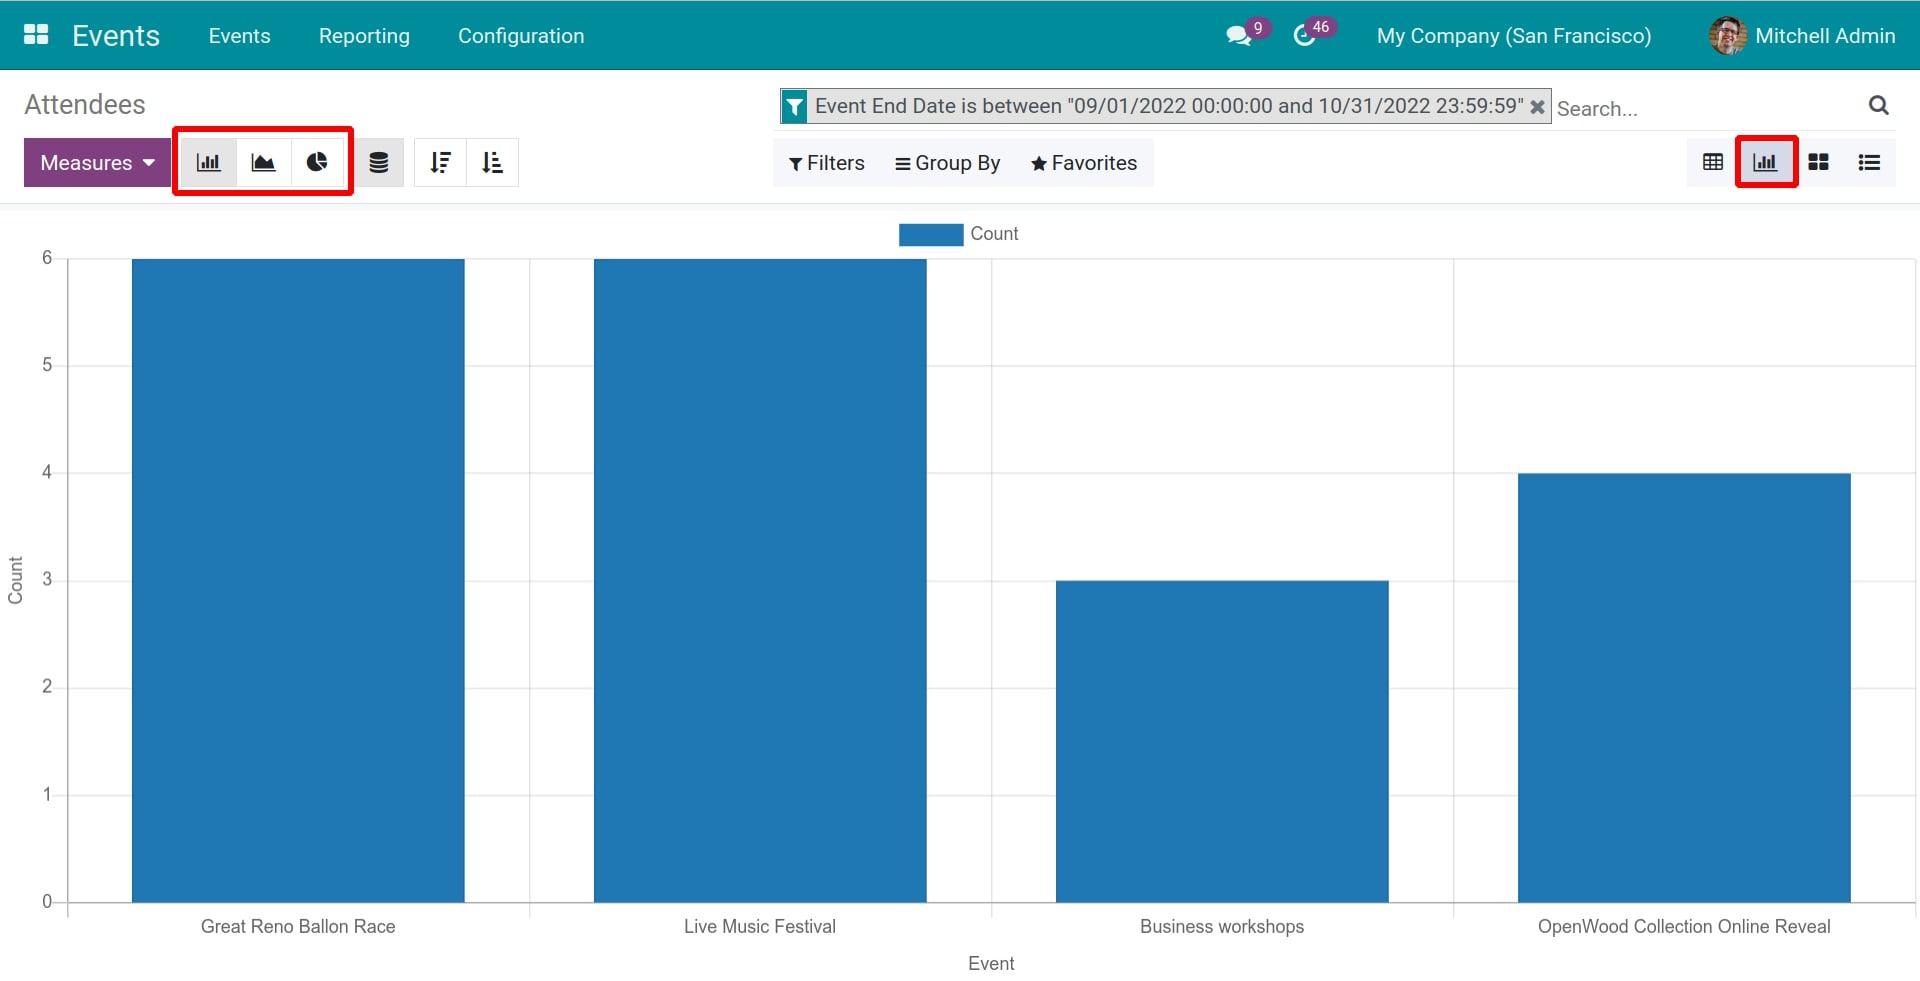
In addition, you can view the Attendee Report in the visual chart or other familiar views in the system as the kanban and list views.
See also
Related articles
Optional modules