CRM Report on Lead/Opportunity Annalysis
Leads/Opportunities analysis reports is a tool to help track the indexes related to customer care service, such as the number of opportunities, expected revenue, closing rate, etc.
This article will guide you through the Leads/Opportunities analysis feature in the CRM app.
Note
Based on the access right in the Sales app, you can access the reports to analyze the leads/opportunities of your own or your teams or your whole company.
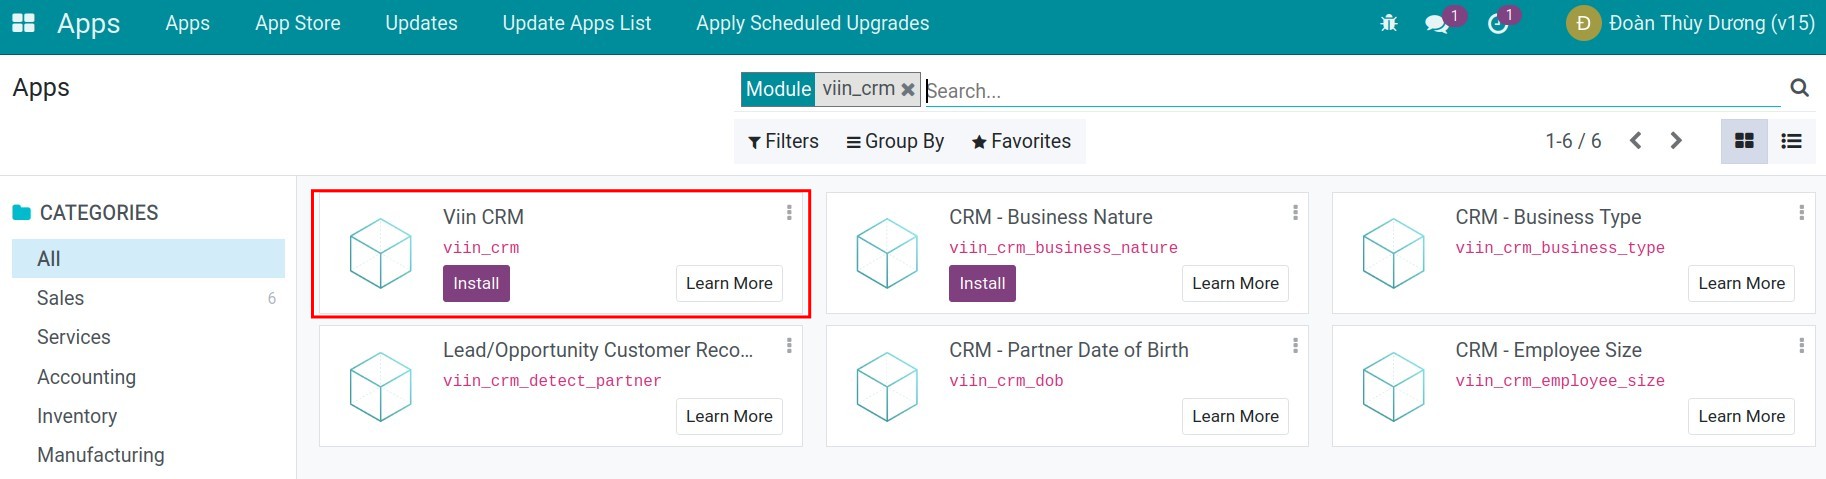
First, you can install the module viin_crm to see more different report types such as corhort report, dashboard, etc. Navigate to Apps, remove the Apps default filter, find the module viin_crm and press install:
Leads/Opportunities Analysis Reportings
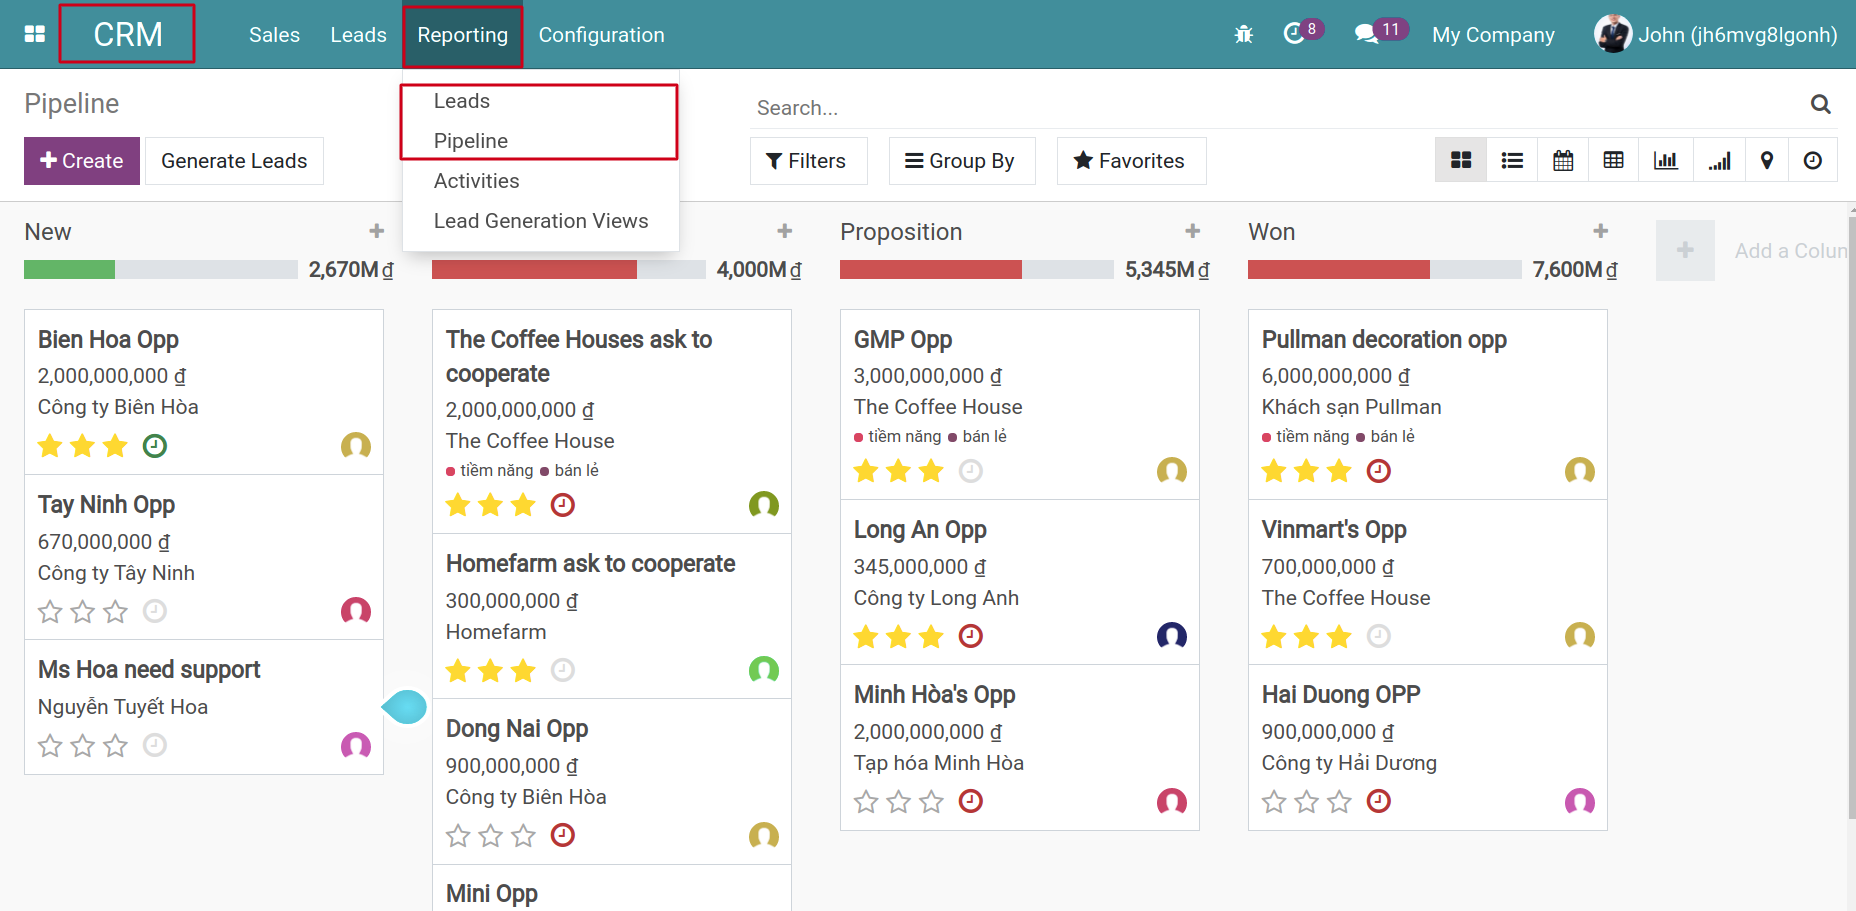
To view the Leads/Opportunities analyze Reportings, navigate to CRM > Reporting app, select Leads or Pipeline to view the respective report.
Depending on the needs of each position or the purpose of the users, you can use different charts for different purposes: for example, Graph chart to see the general changes of leads, opportunities based on different measures; Pivot for deeper analysis purposes.
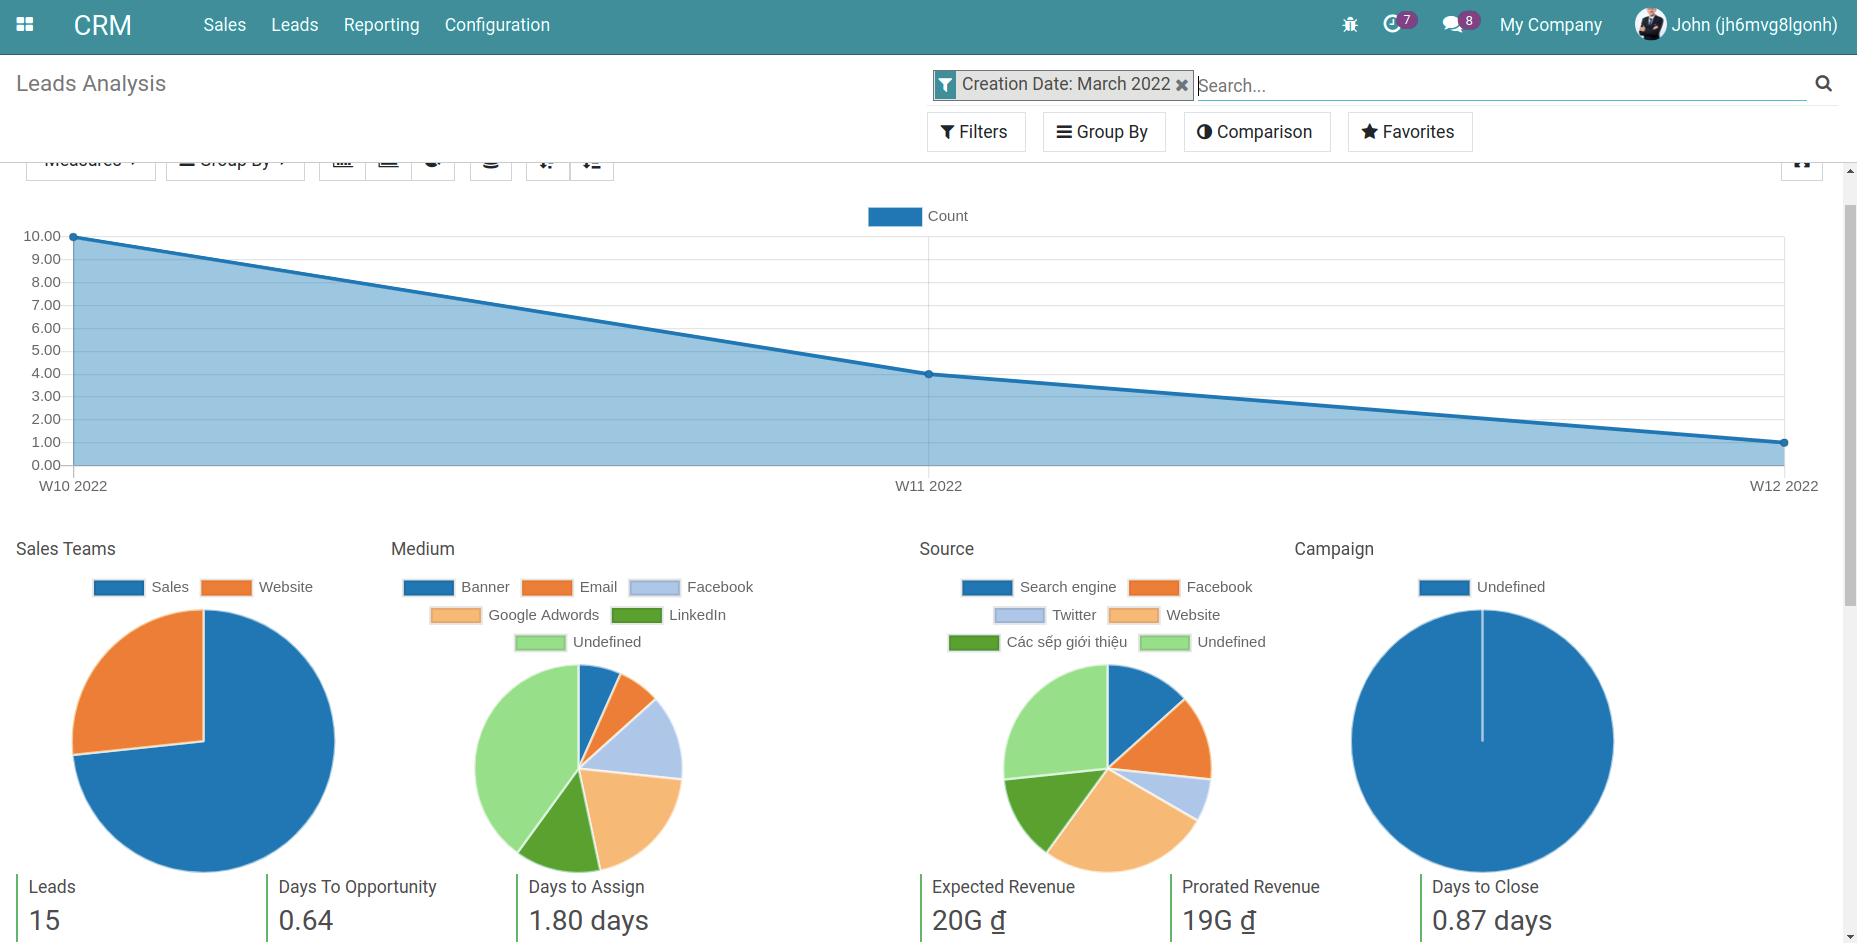
Graphs and charts
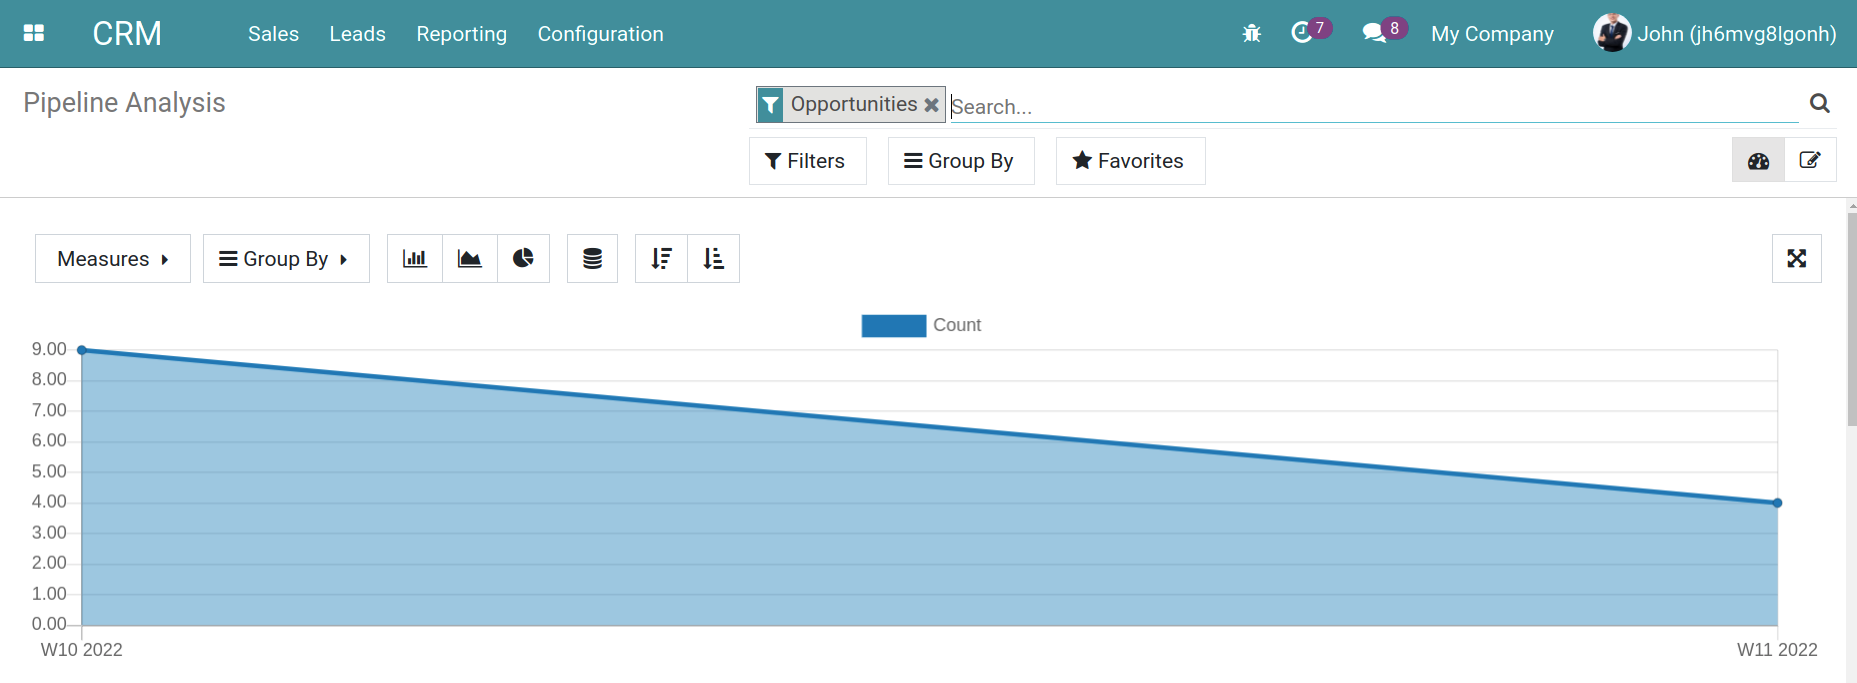
You can view the Leads/Opportunities analysis reportings by using Bar chart, Line chart, Pie chart, etc.
Line chart
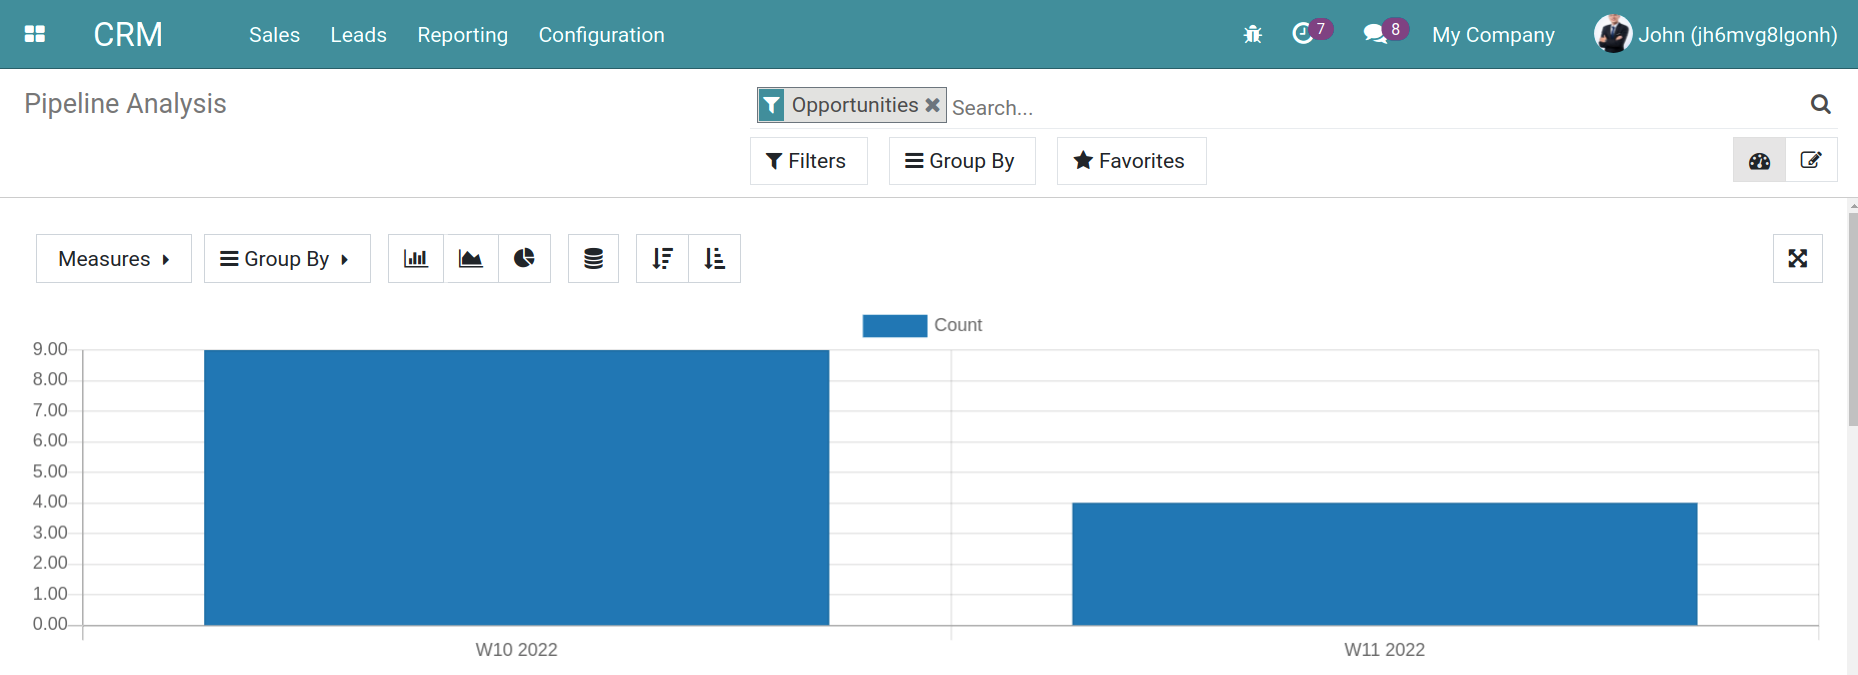
Bar chart
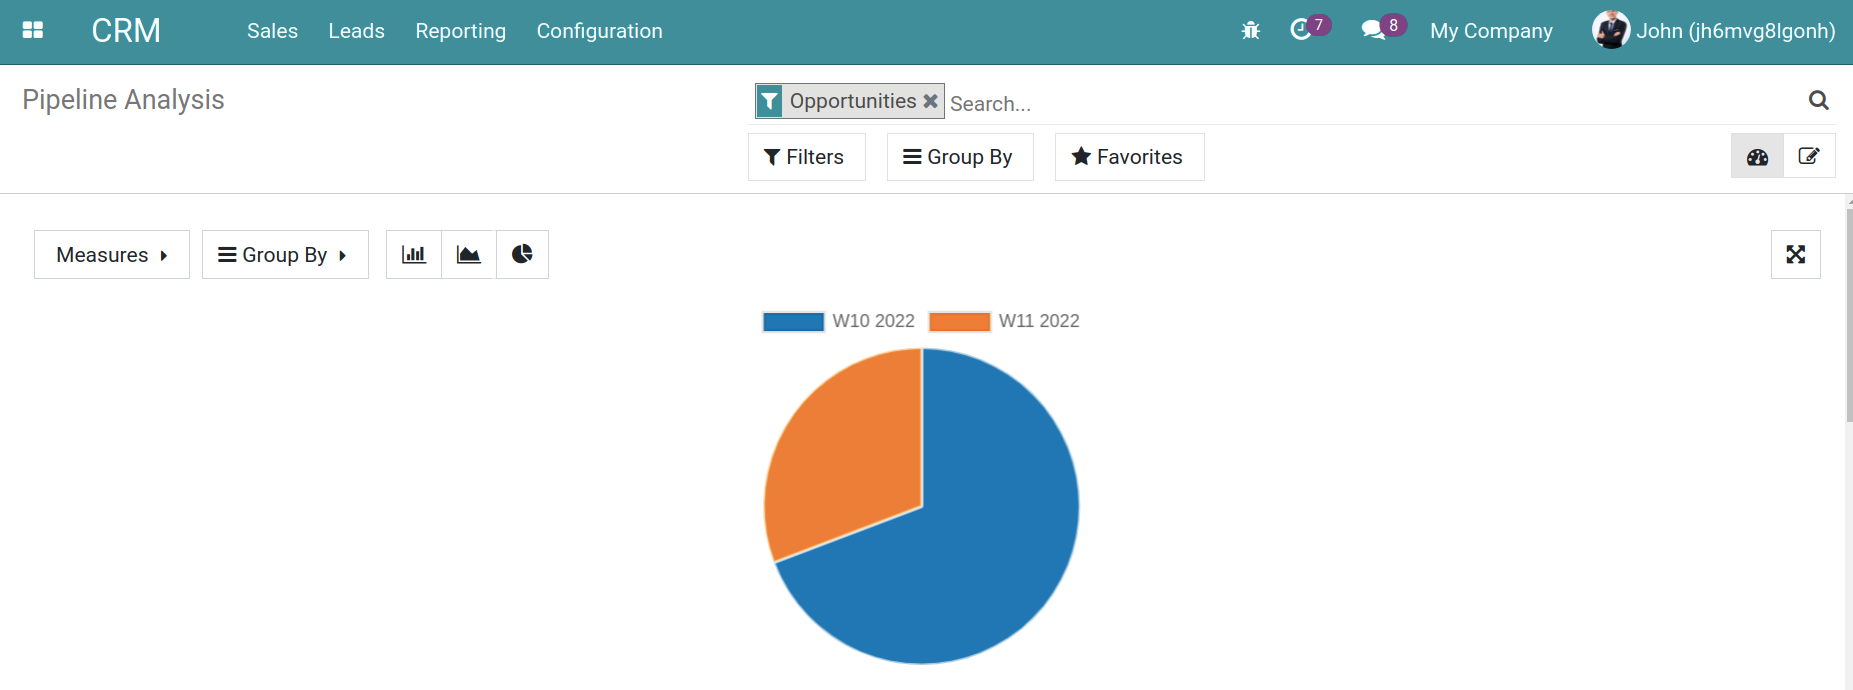
Pie chart
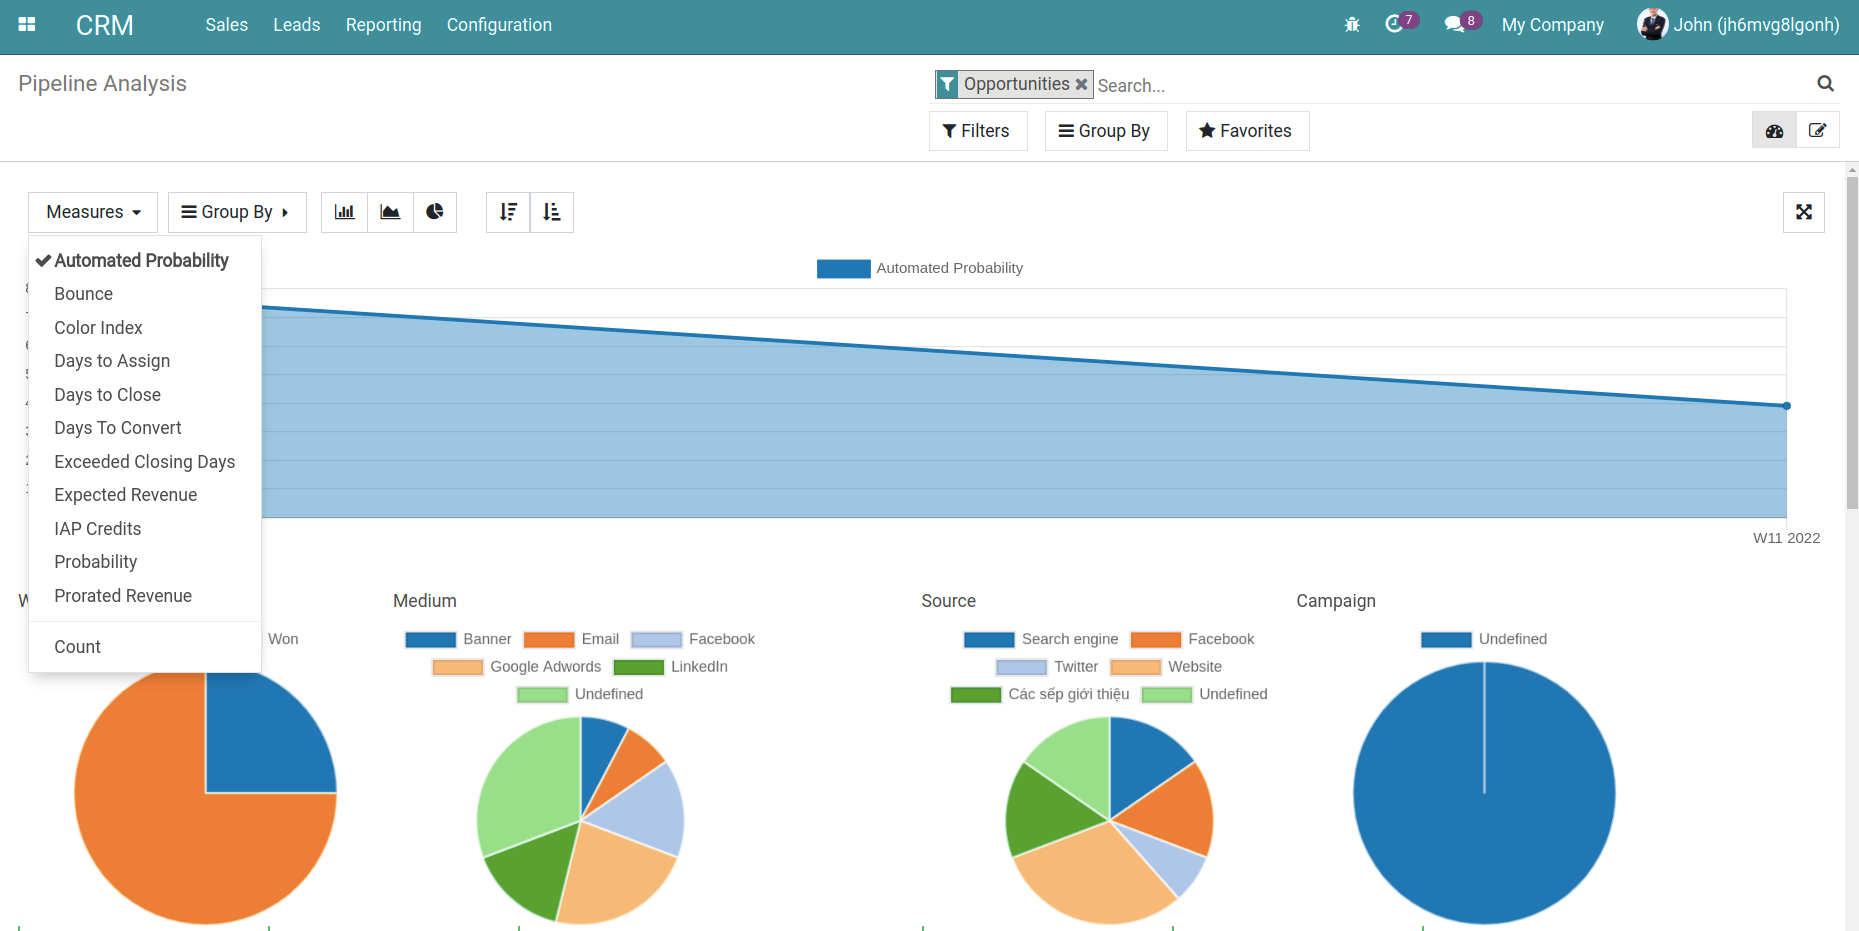
Hit Measures to select the measurements to be displayed on the chart. For instance, Automated Probability.
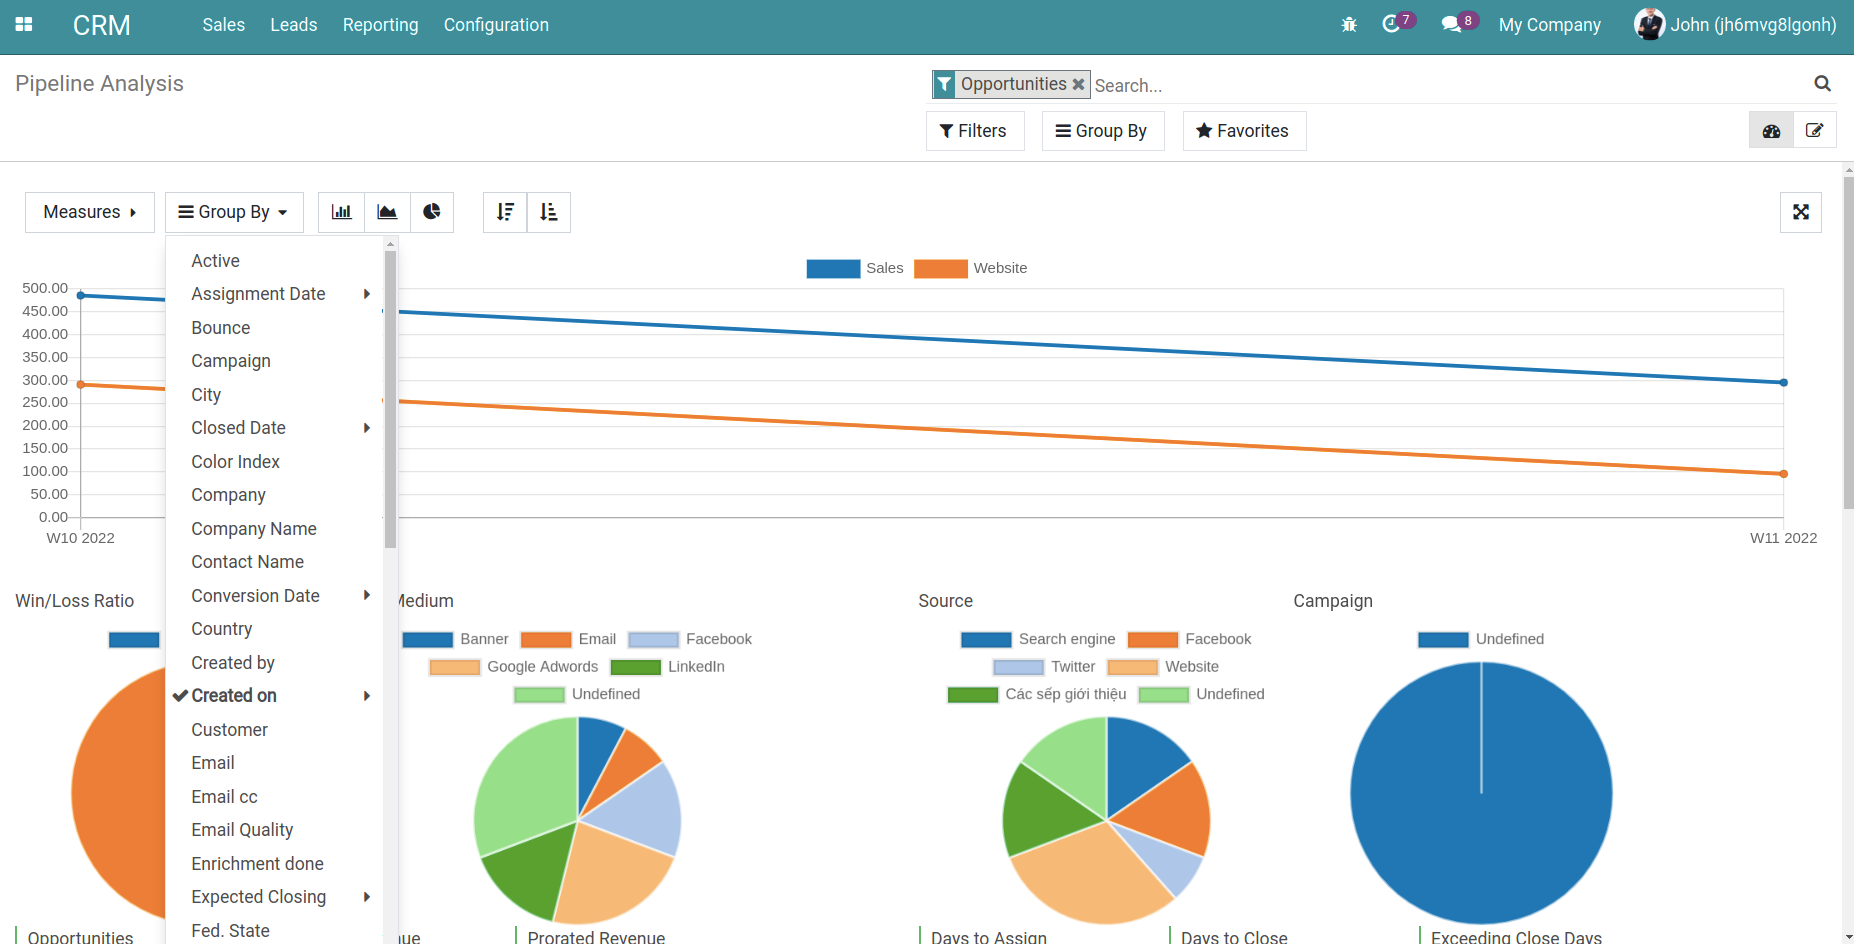
Hit Group By and select one or more criteria to group the leads/opportunities. For instance, select the Sales team criterion to group by the sales team.
Select the chart to view the report right on the view. You can also choose different charts using the same measure.
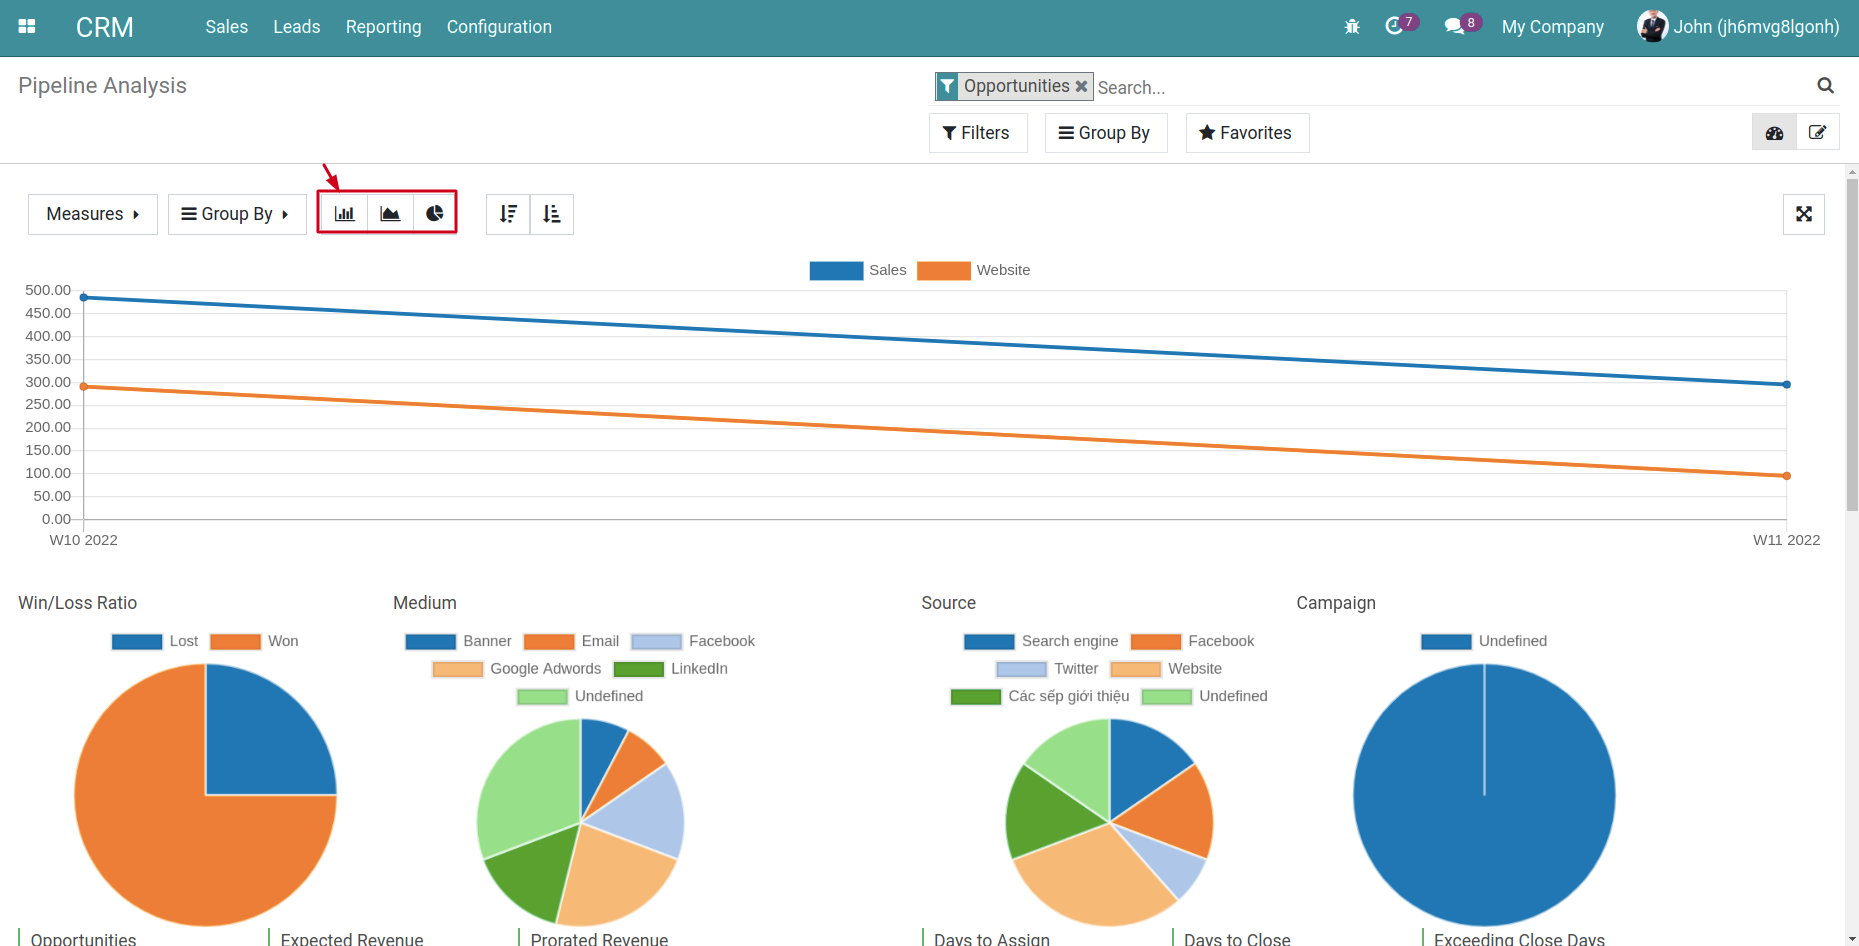
Use these icons to display the data in ascending or descending order:
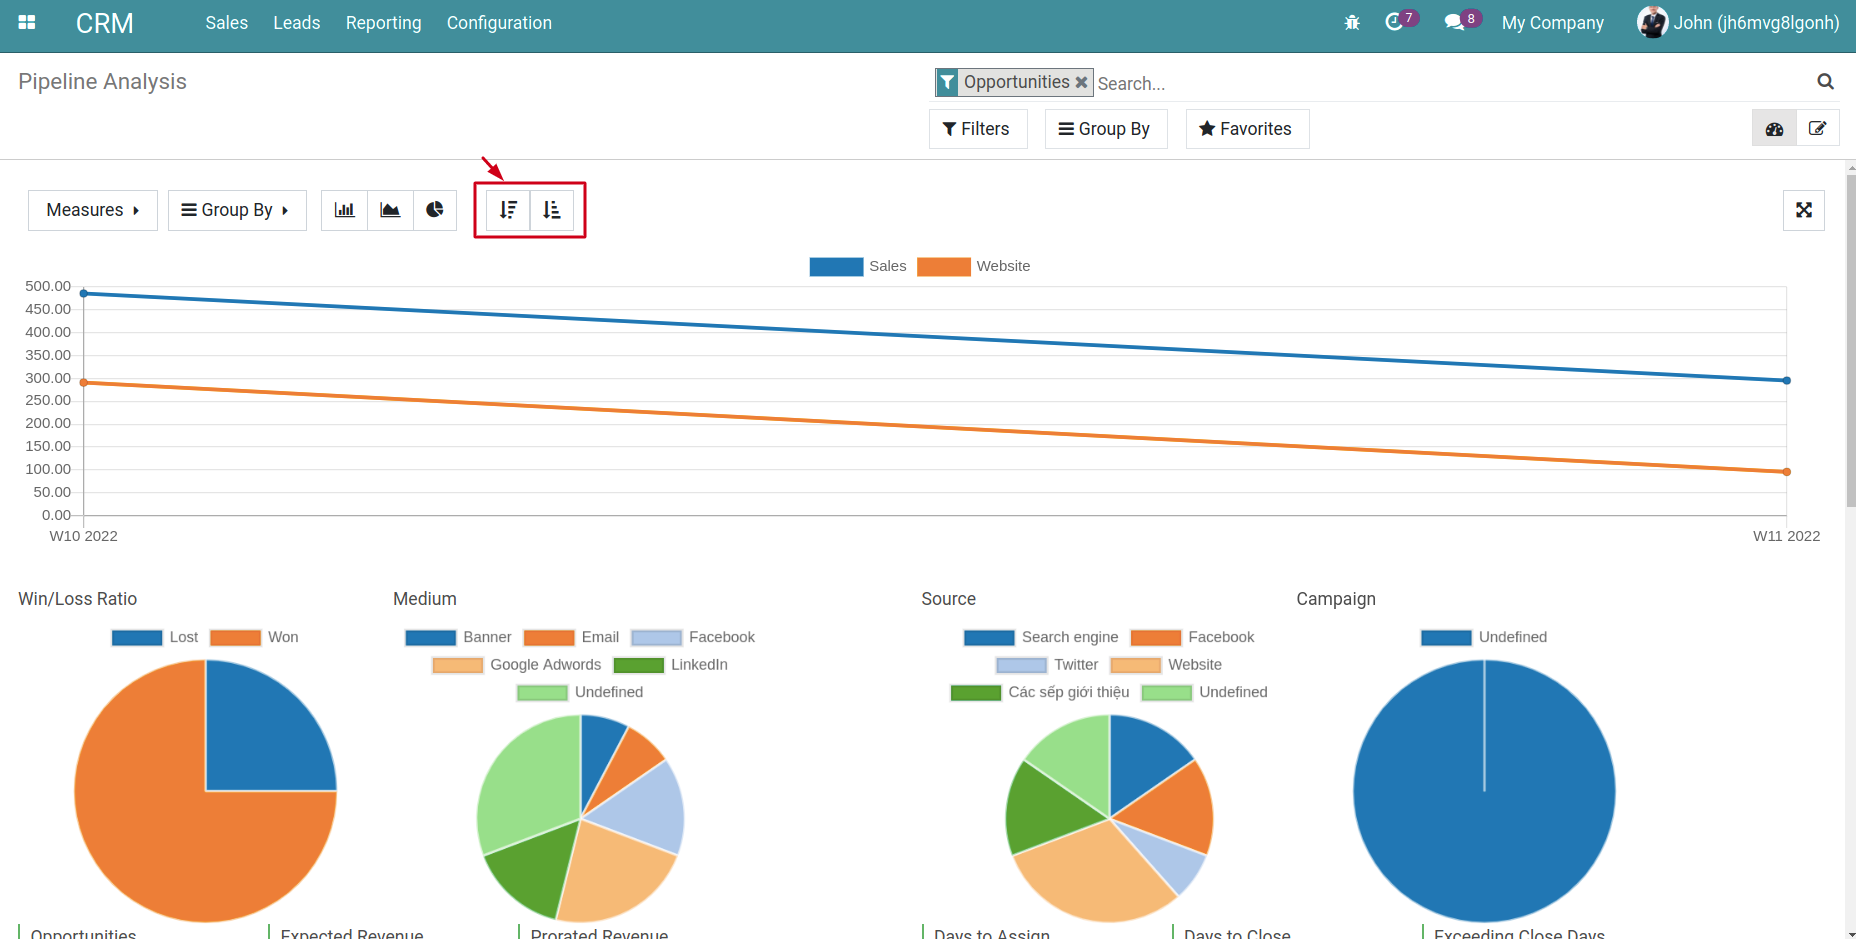
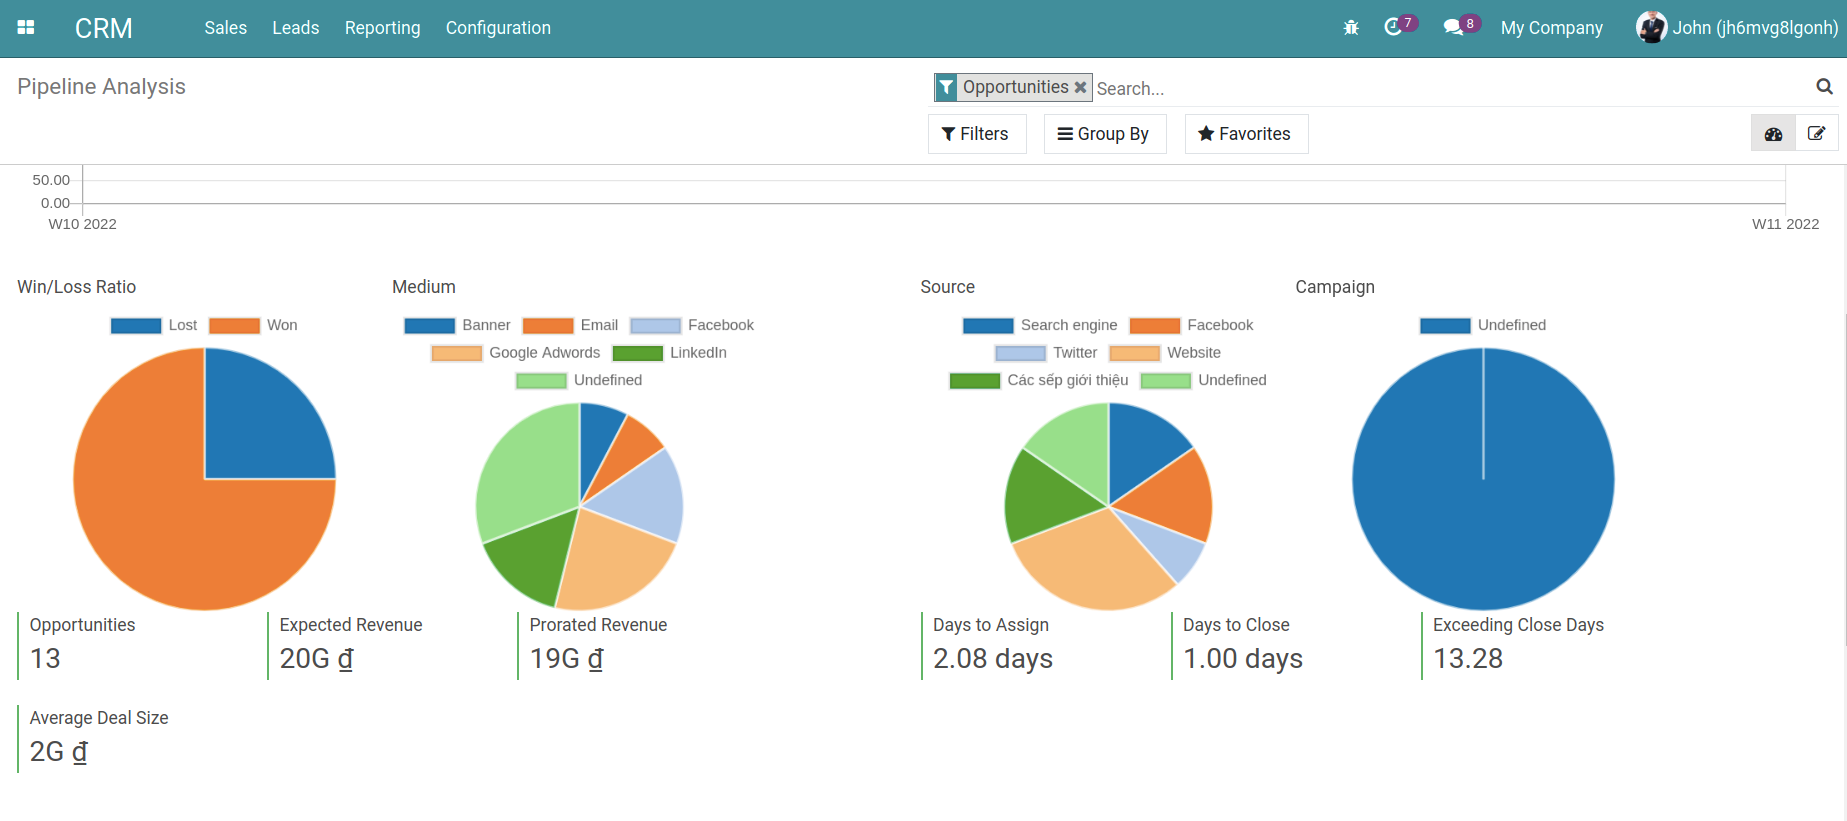
In the Pipeline Analysis report, various criteria are provided with collected data such as Win/Loss Ratio, Medium, Source, Campaign, Expected Revenue, Exceeding Close Days, etc.
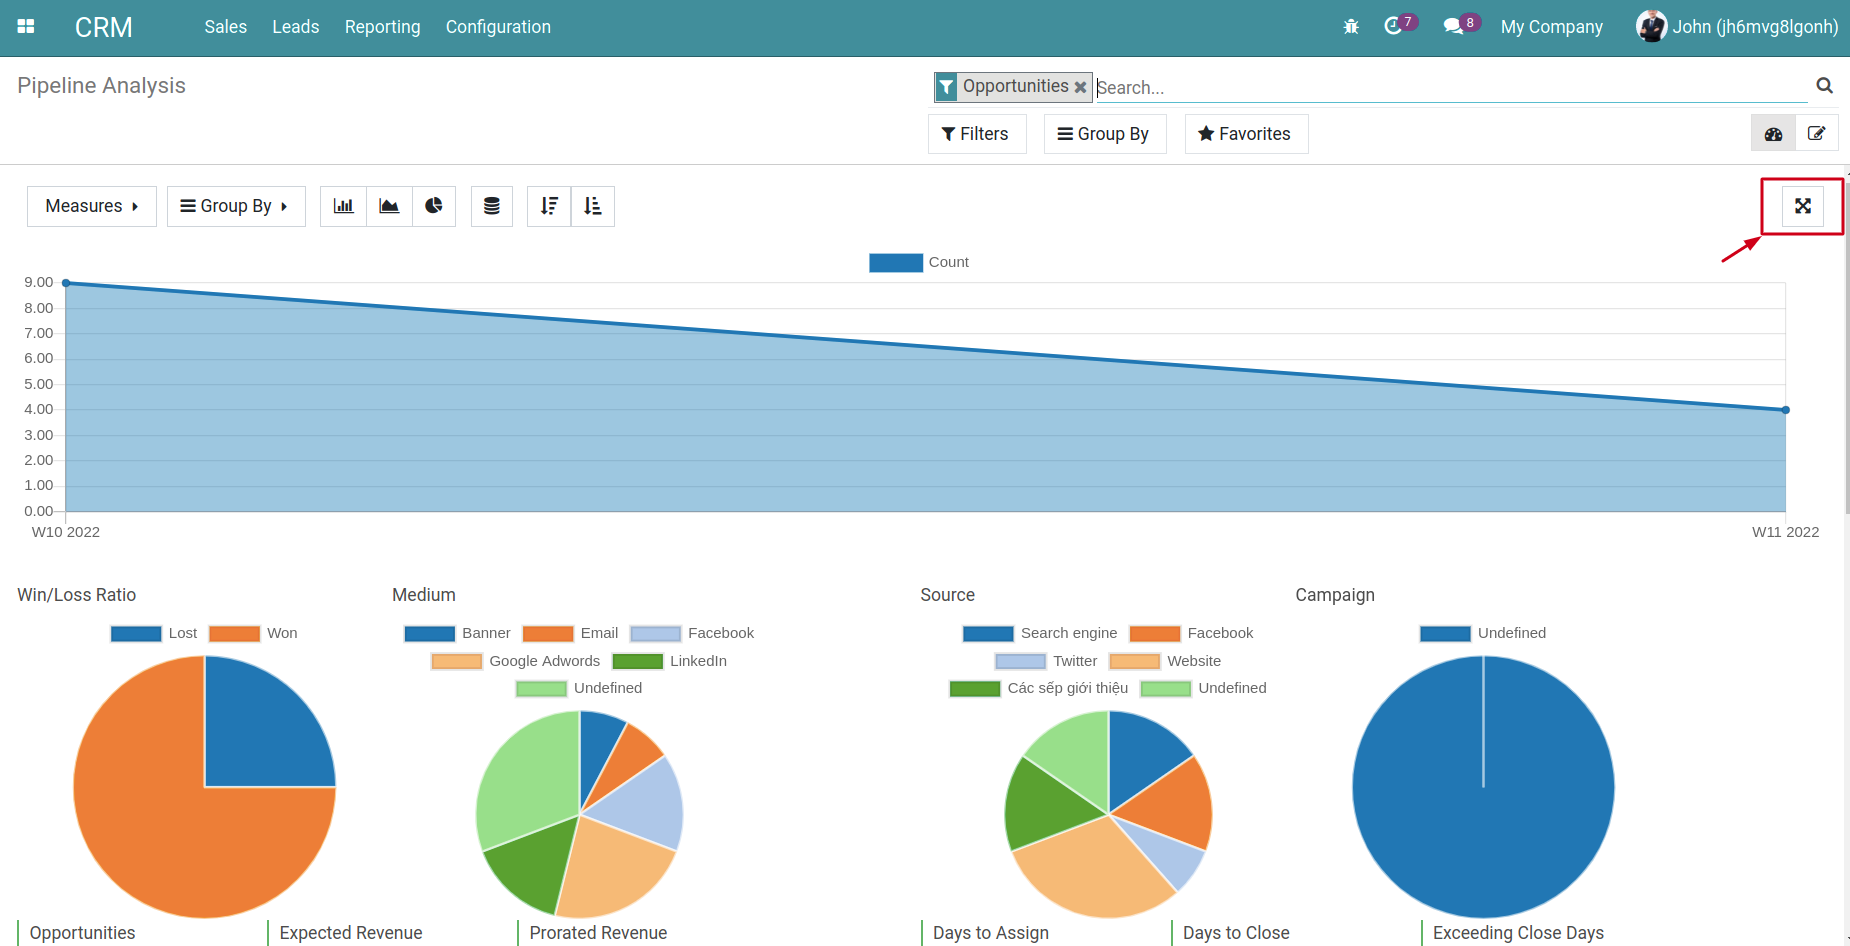
To view the report in the fullscreen view mode, hit this icon located in the upper-right corner of the opening report.
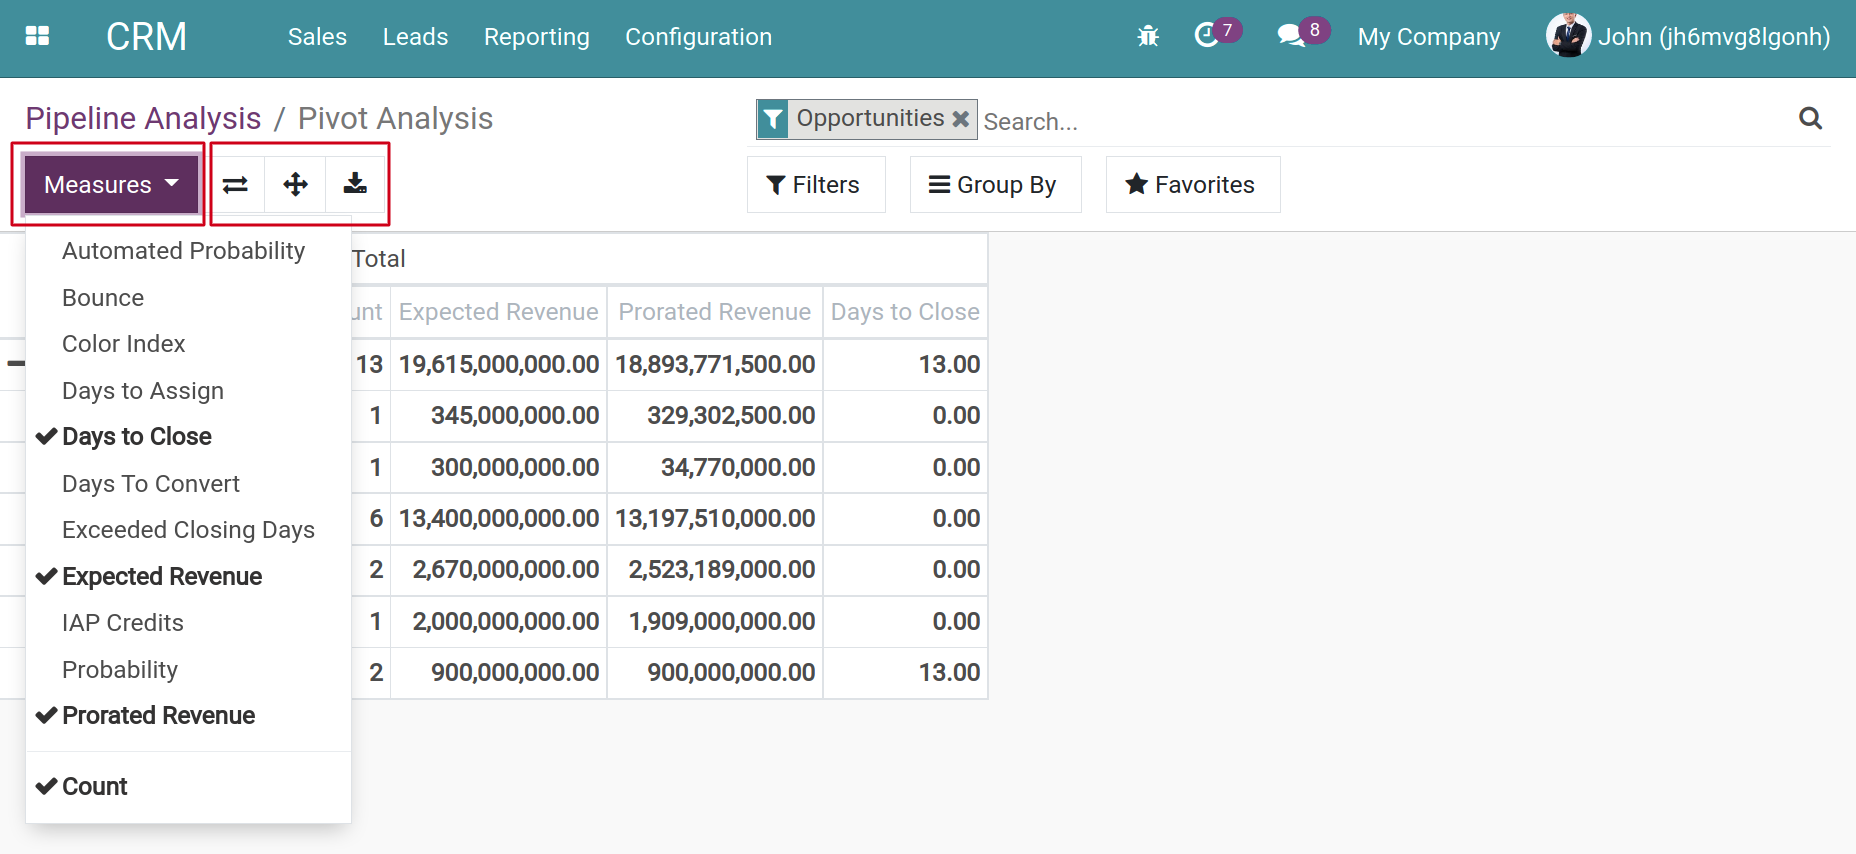
Pivot Analysis
To go to Pivot analysis, you scroll your mouse below. This is one of the most flexible charts.
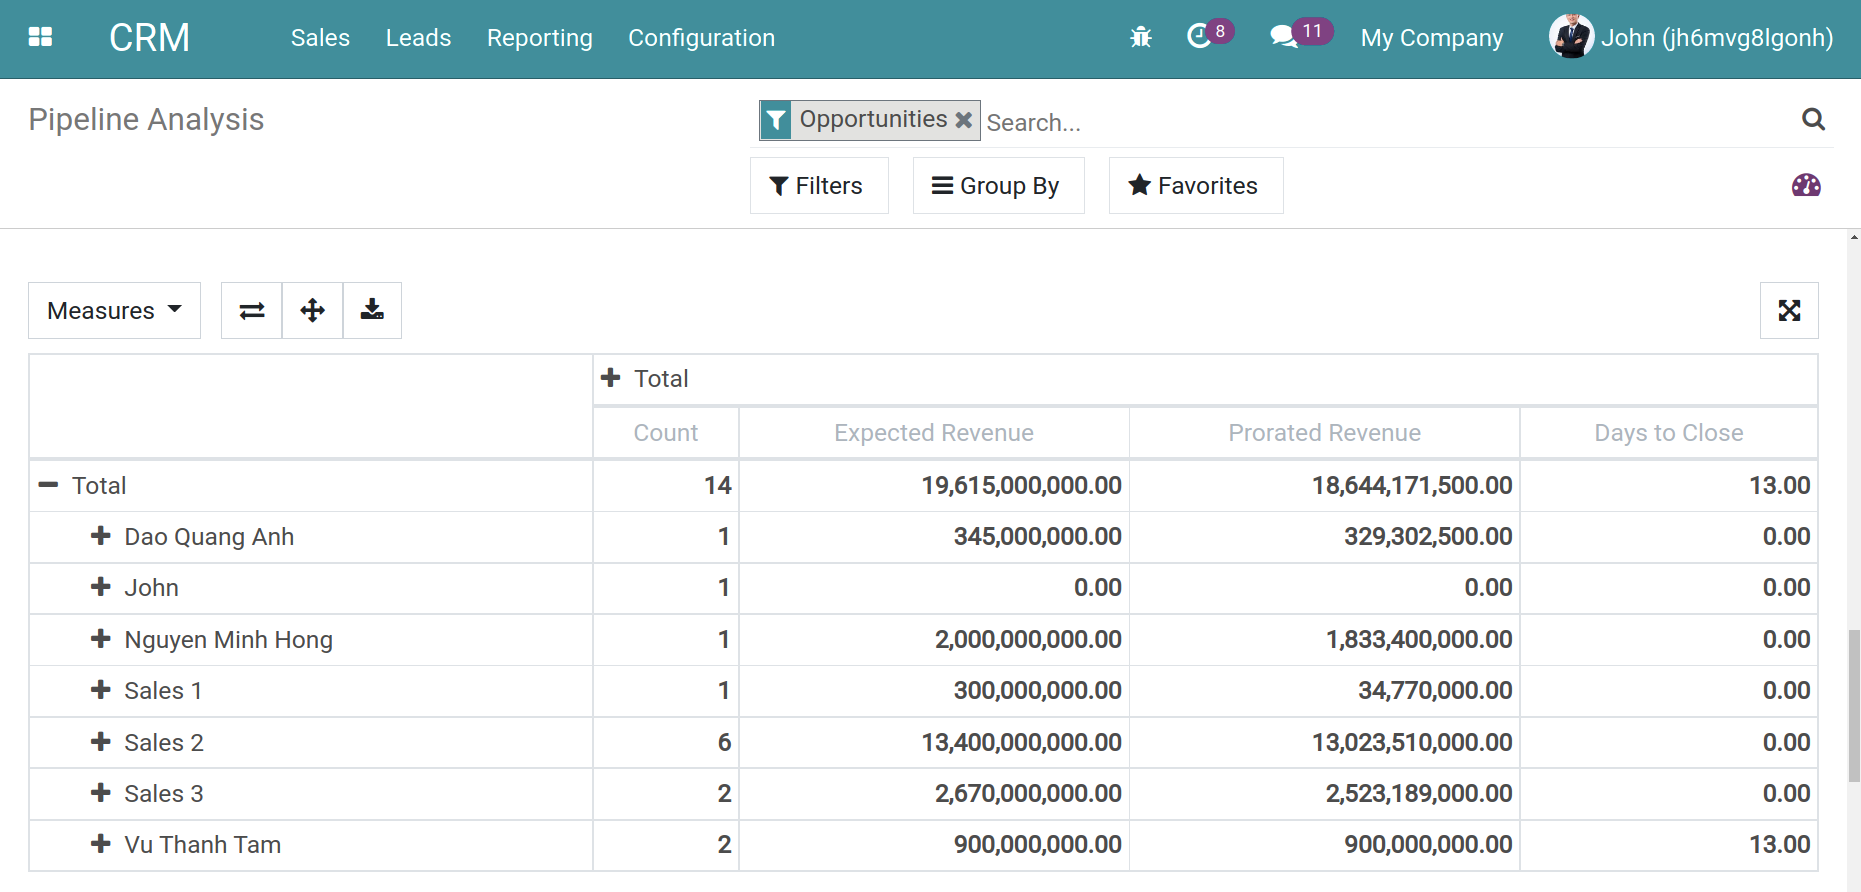
The Pivot analysis provides the following features:
Select different measures to view the report.
Export the report to an Excel file.
Add/Remove parameters to the column by hitting the plus sign (+) or the minus sign (-) when you want to show/hide the values of those parameters, respectively.
Flip the axis of the report or expand all the selected parameters.
Cohort Analysis
To go to Cohort analysis, you scroll your mouse to bottom. In the CRM app, the Cohort analysis helps to measure the closing progress on opportunities that have been in care for a certain period of time. Each measure has a specific meaning and serves a specific purpose. Select Day, Week, Month, Year to choose the period for the leads/opportunities. For example, the chart below tracks a 15-days process of taking care of leads and opportunities:
In the Day period, there are 09 opportunities in total on 03/03/2022.
From the first day to the 12th day of the period, there is only 01 won opportunity, so the percentage is 11.1%.
From the 13th day to the 15th day of the period, there is 1 more won opportunity, so the percentage is 22.2%.
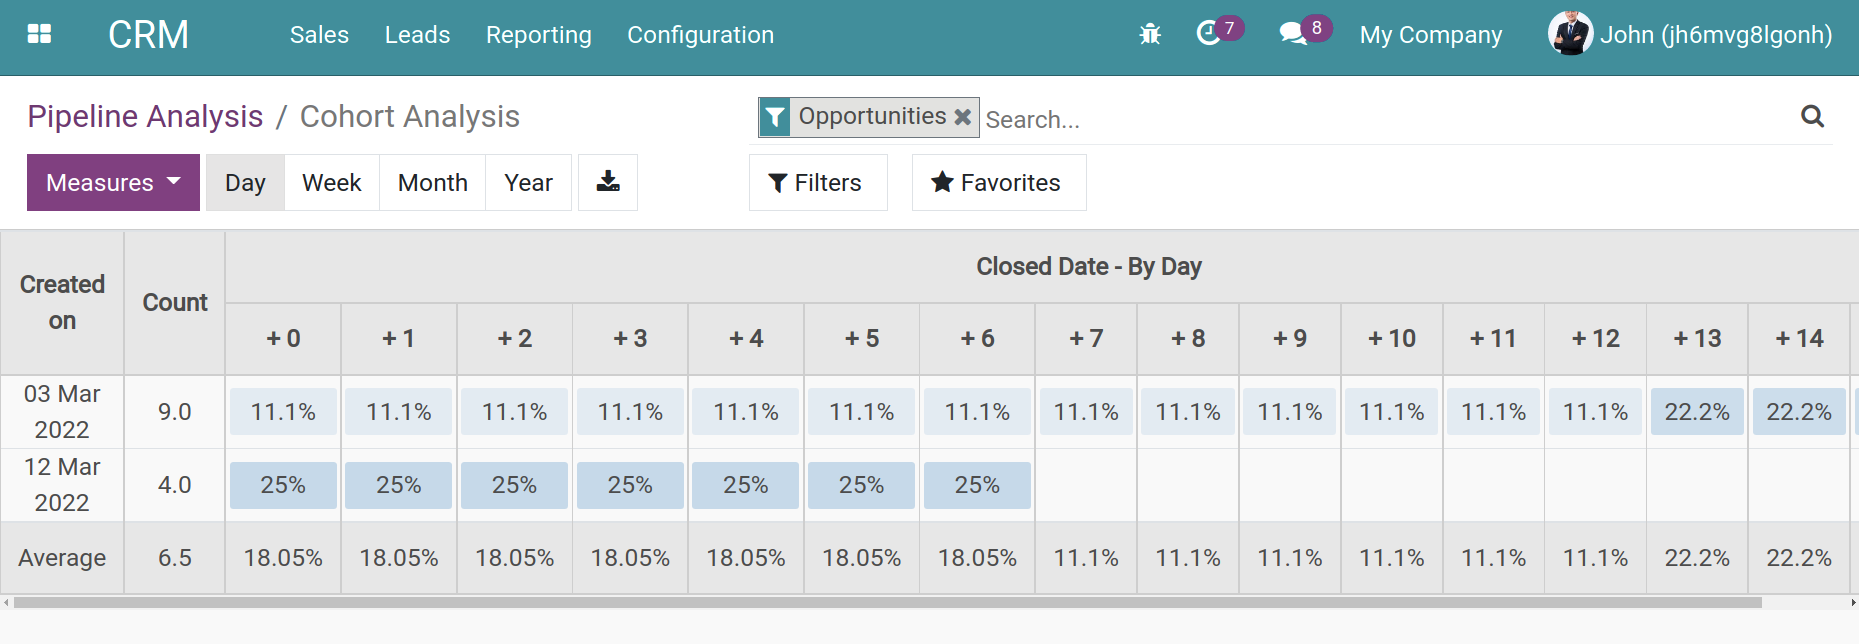
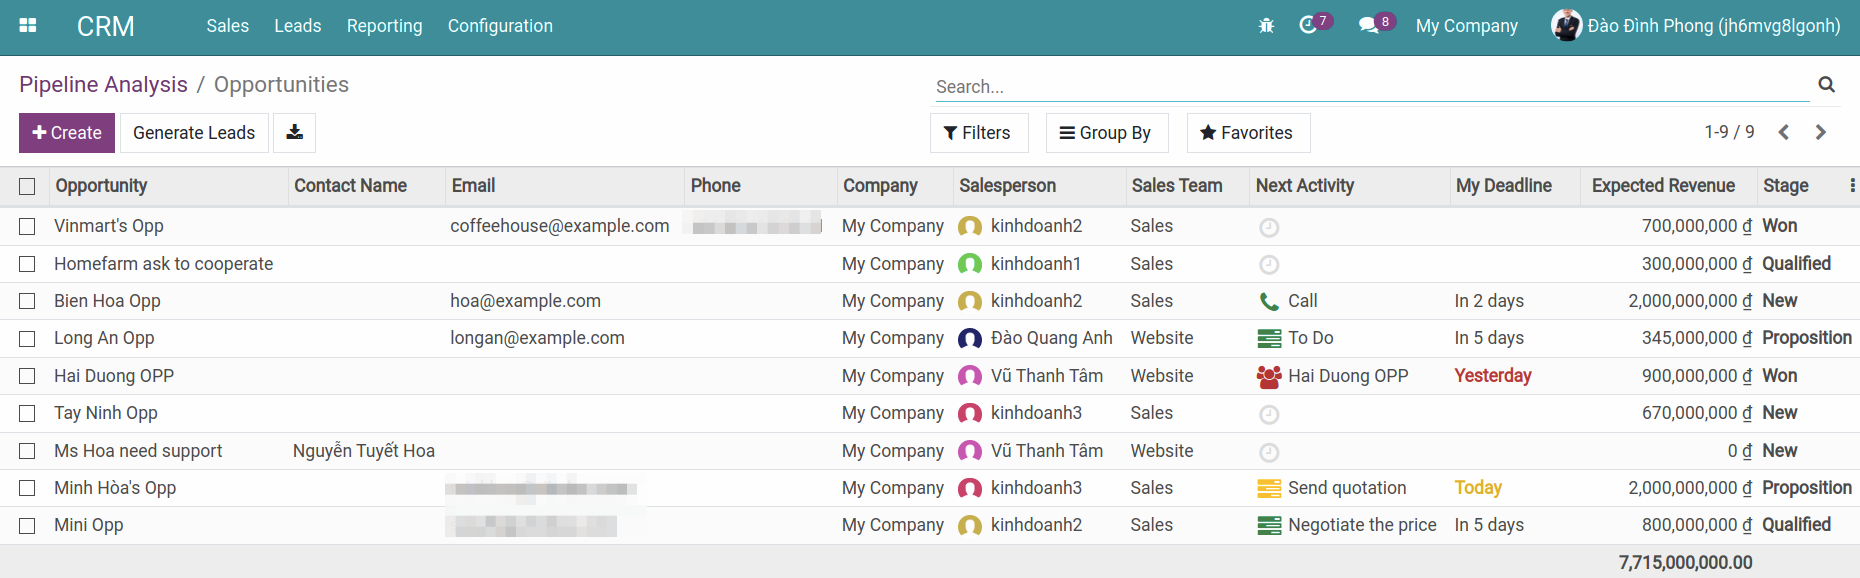
To see the opportunities, you can directly hit the numbers on the table. The system will redirect you to another view. On this view, there is a list of opportunities for you to compare.
Filter, Group By data
You can use the filters to filter the data according to your needs: for example by time period, different measures, grouping by one or more Leads/Opportunities with the same criteria, etc.
To filter or group data, hit Filters or Group by and select the criteria. Here you can compare the statistical data with the data of the previous period or of the previous year. Save the filter to Favorites if you want to review it at another time.
See also
Related article
Optional module