Sales Analysis with Sankey Chart
A Sankey chart is a type of statistical chart, used to represent and analyze the flows or processes of exchange between different elements in a system. This diagram is named after the Irish physicist, Matthew Henry Phineas Riall Sankey, who used it to illustrate the flow of energy in a report he wrote in the late 19th century.
In a Sankey chart, blocks or columns are arranged vertically, and the lines between them represent traffic or conversion between them. These widths correspond to the amount of flow or conversion corresponding from one element to another. Sankey charts are often used to represent processes in energy, environment, economics, or other fields to help better understand processes and solutions to related problems.
Using the Sankey chart in Viindoo’s Sales module, helps businesses analyze the conversion ratio from quotation through other stages in the sales process, thereby evaluating the business situation of the business.
Requirements
This tutorial requires the installation of the following applications/modules:
Install the required module
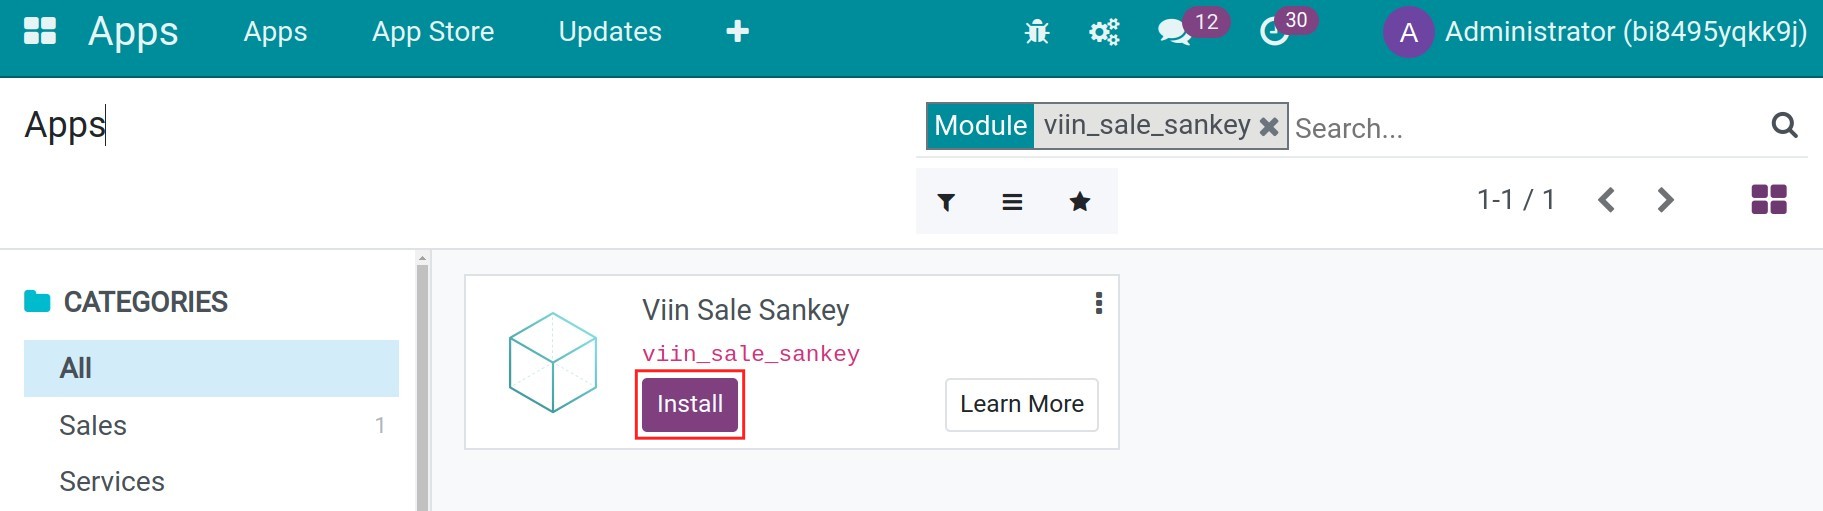
First of all, you need to navigate to Apps, cancel the default filter and search the module viin_sale_sankey:
Using Sankey chart in Quotations’ conversion rate analysis
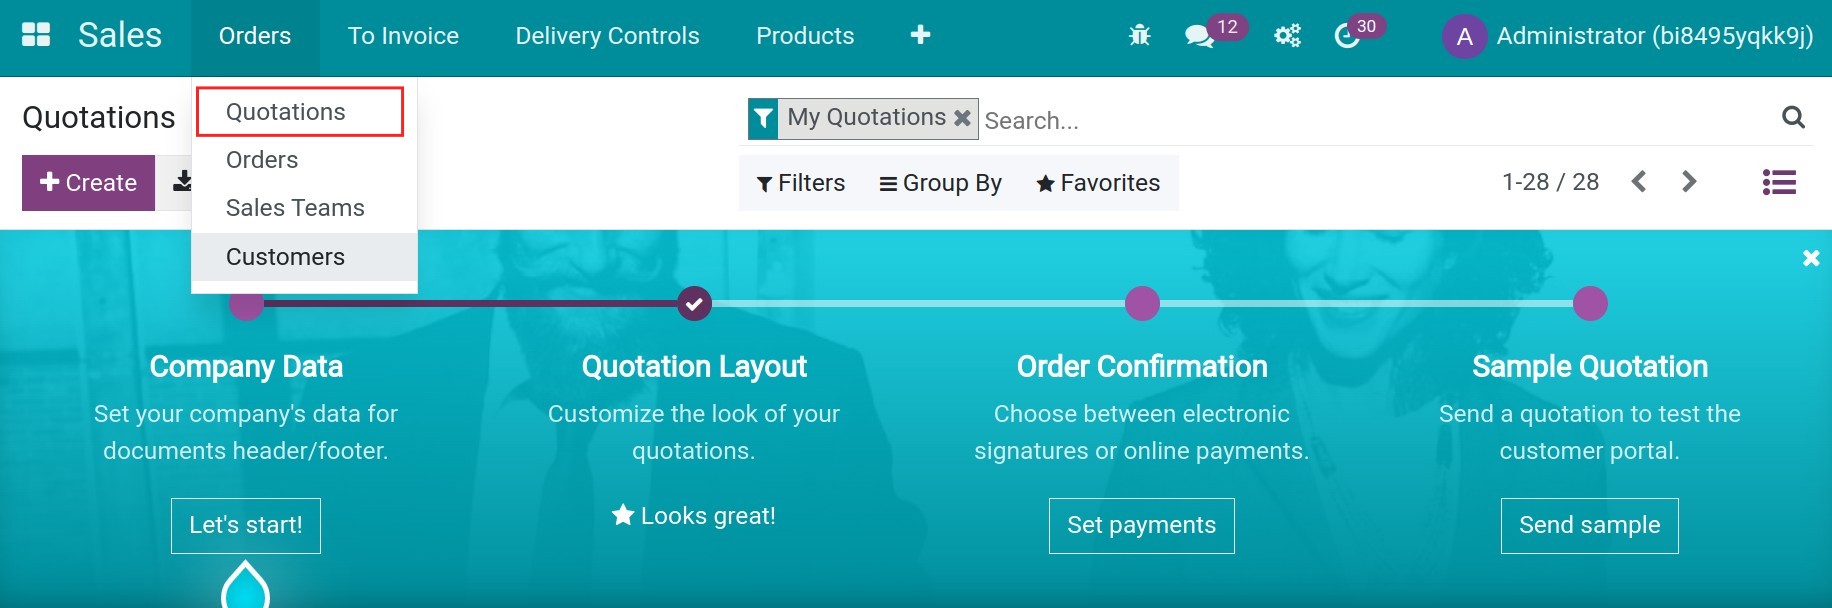
After that, you can navigate to Sales ‣ Orders ‣ Quotations:
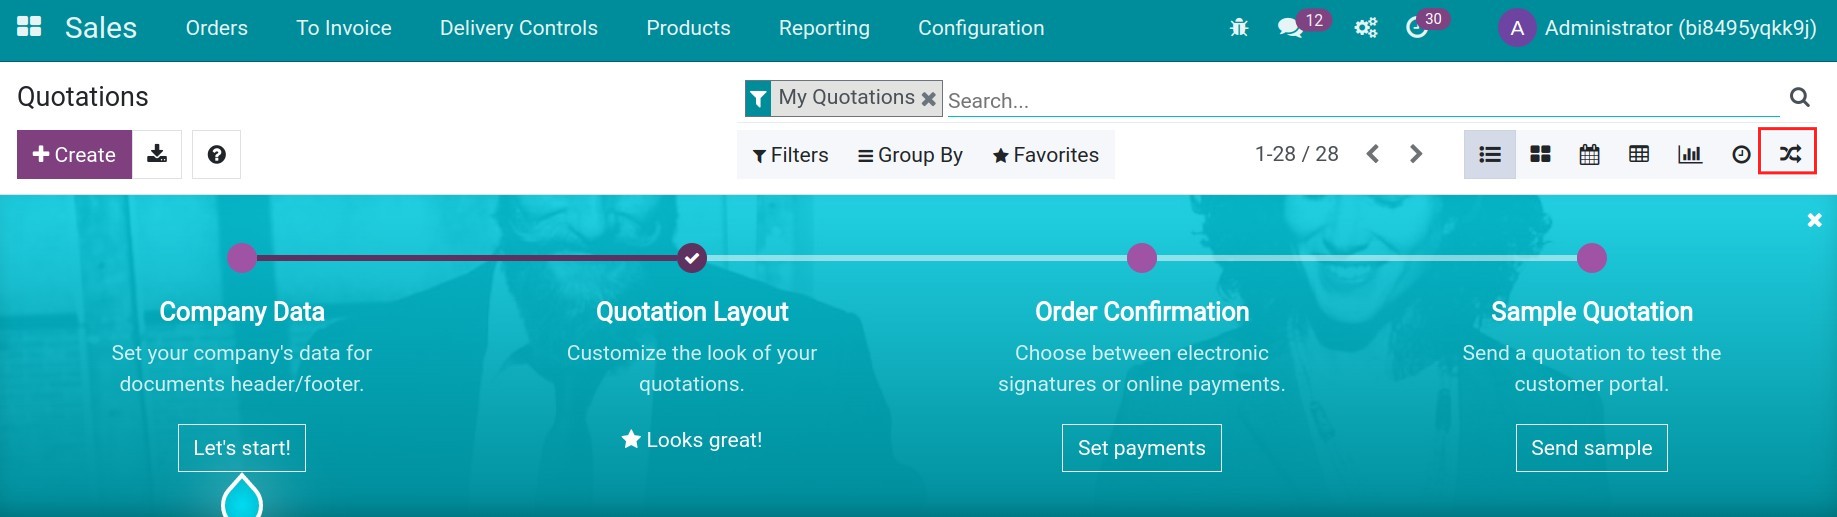
Select to the Sankey icon to see the Sankey chart:
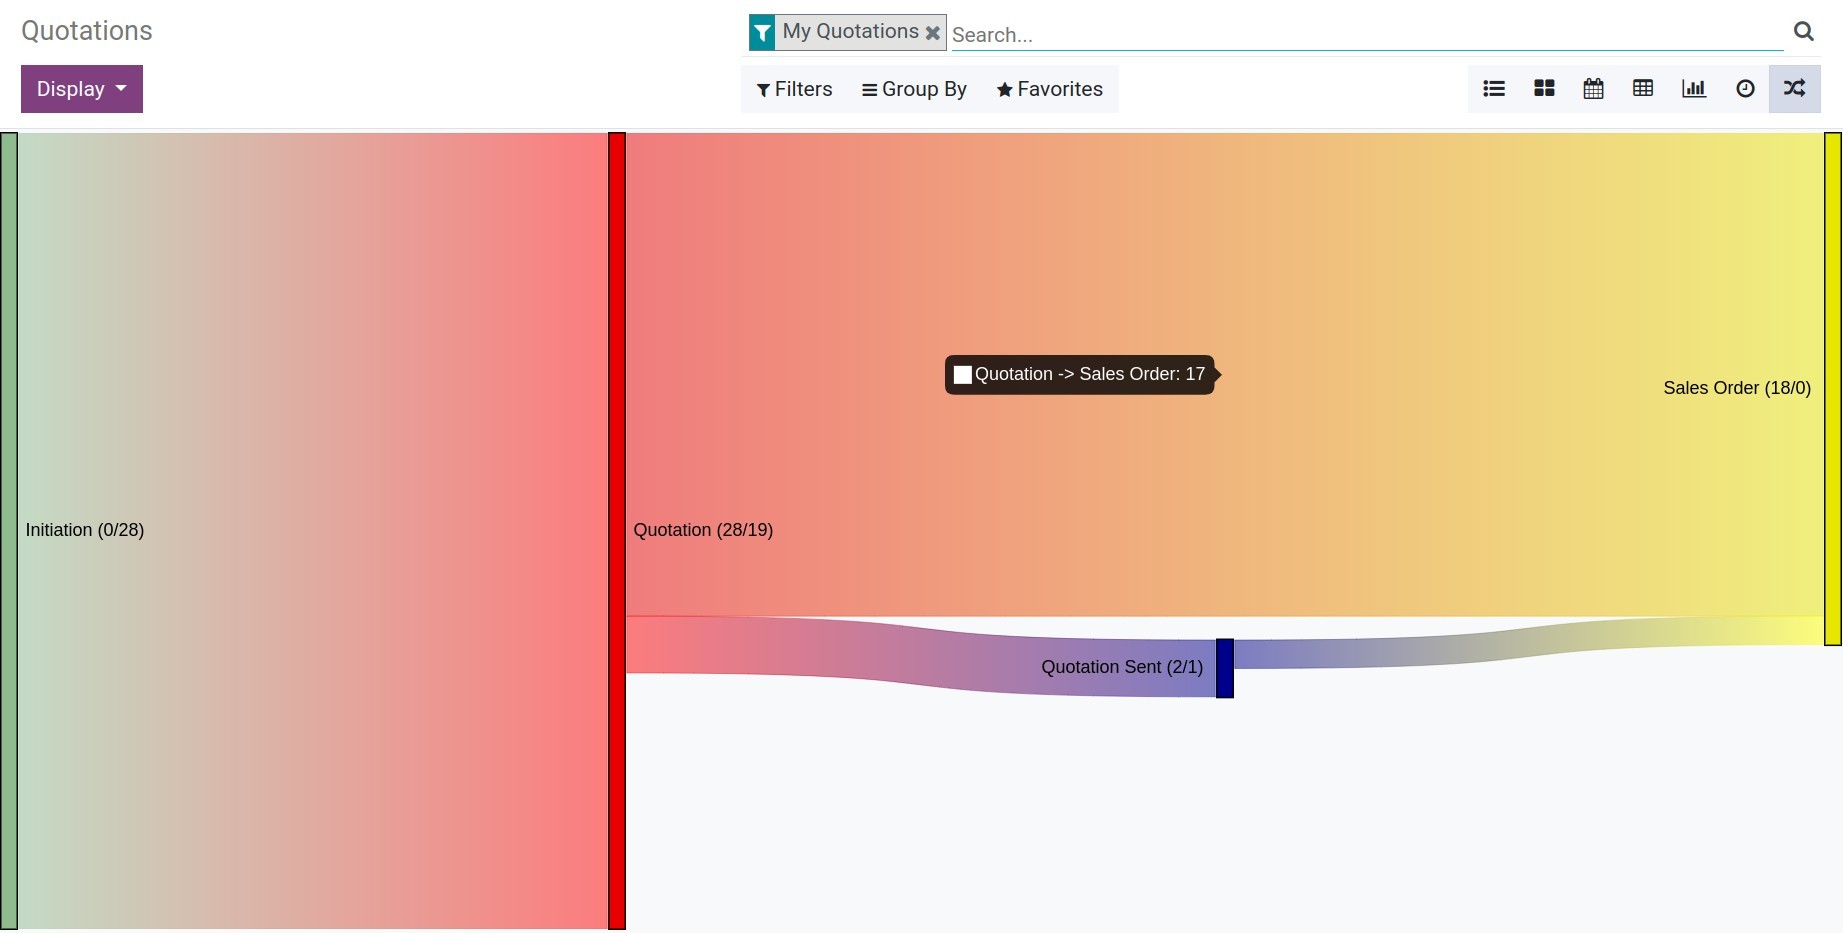
Some points that you need to know to understand the Sankey chart in Viindoo:
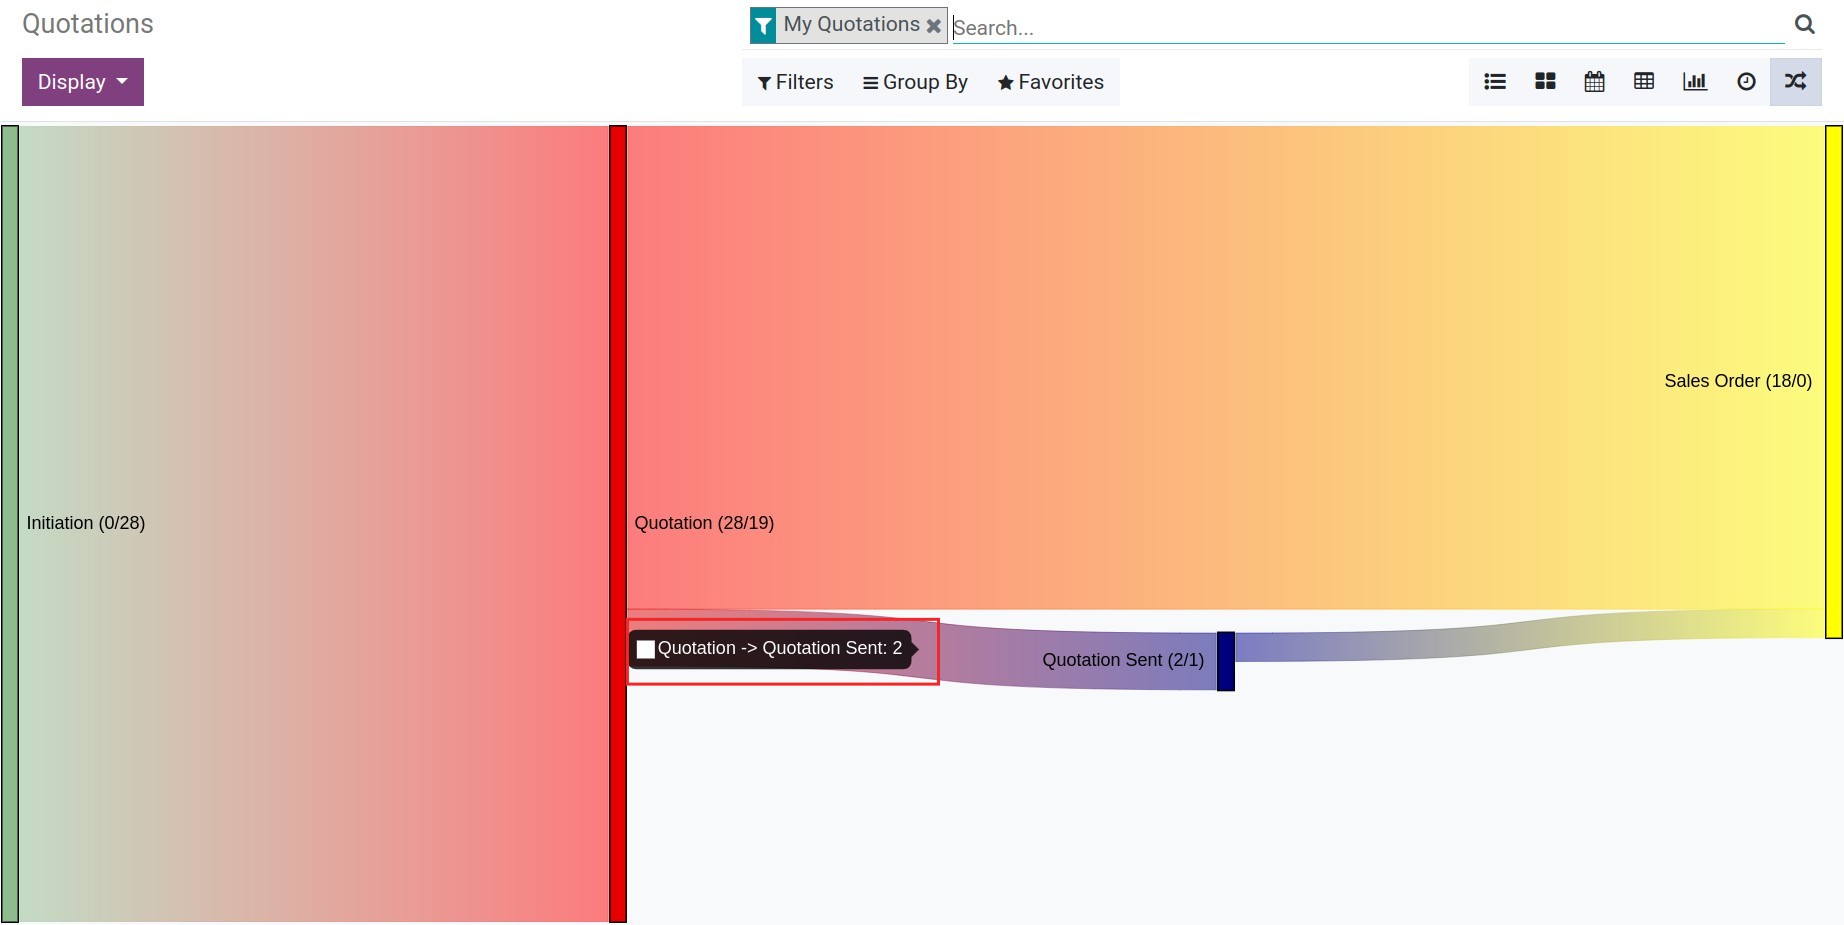
The block you see in the Sankey chart, by default is represented for the stage of sales orders:
Initiations (when the quotation record is just created),
Quotation (when the quotation record is saved),
Quotation Sent (when you sent a quotation for the customer),
Sales Order (when confirmed the quotation).
You can add some more blocks for the connections you need by using Filter and Group by feature.As you can see, in each block, there is a number showing the flow in and flow out of that block. Such as:
The block Quotation (28/19) means that you already created 28 quotations and only converted 19 quotations to the Quotation Sent and Sales Order.
The block Quotation Sent (2/1) means that you already have 2 quotation sent and only converted one to Sales Order.
The block Sales Order(18/0) means that you have 18 sales orders and have nothing out after.
Following that, you also can calculate the conversion ratio from quotation to sales order is 18/28.
To know more about the number, you can hover the cursor on to the flow that you want:
Alternatively, depending on your needs, you can use Filters and Group by to show more flow. For example, Group by criteria Customer, the reported data will show the process of selling to each customer.
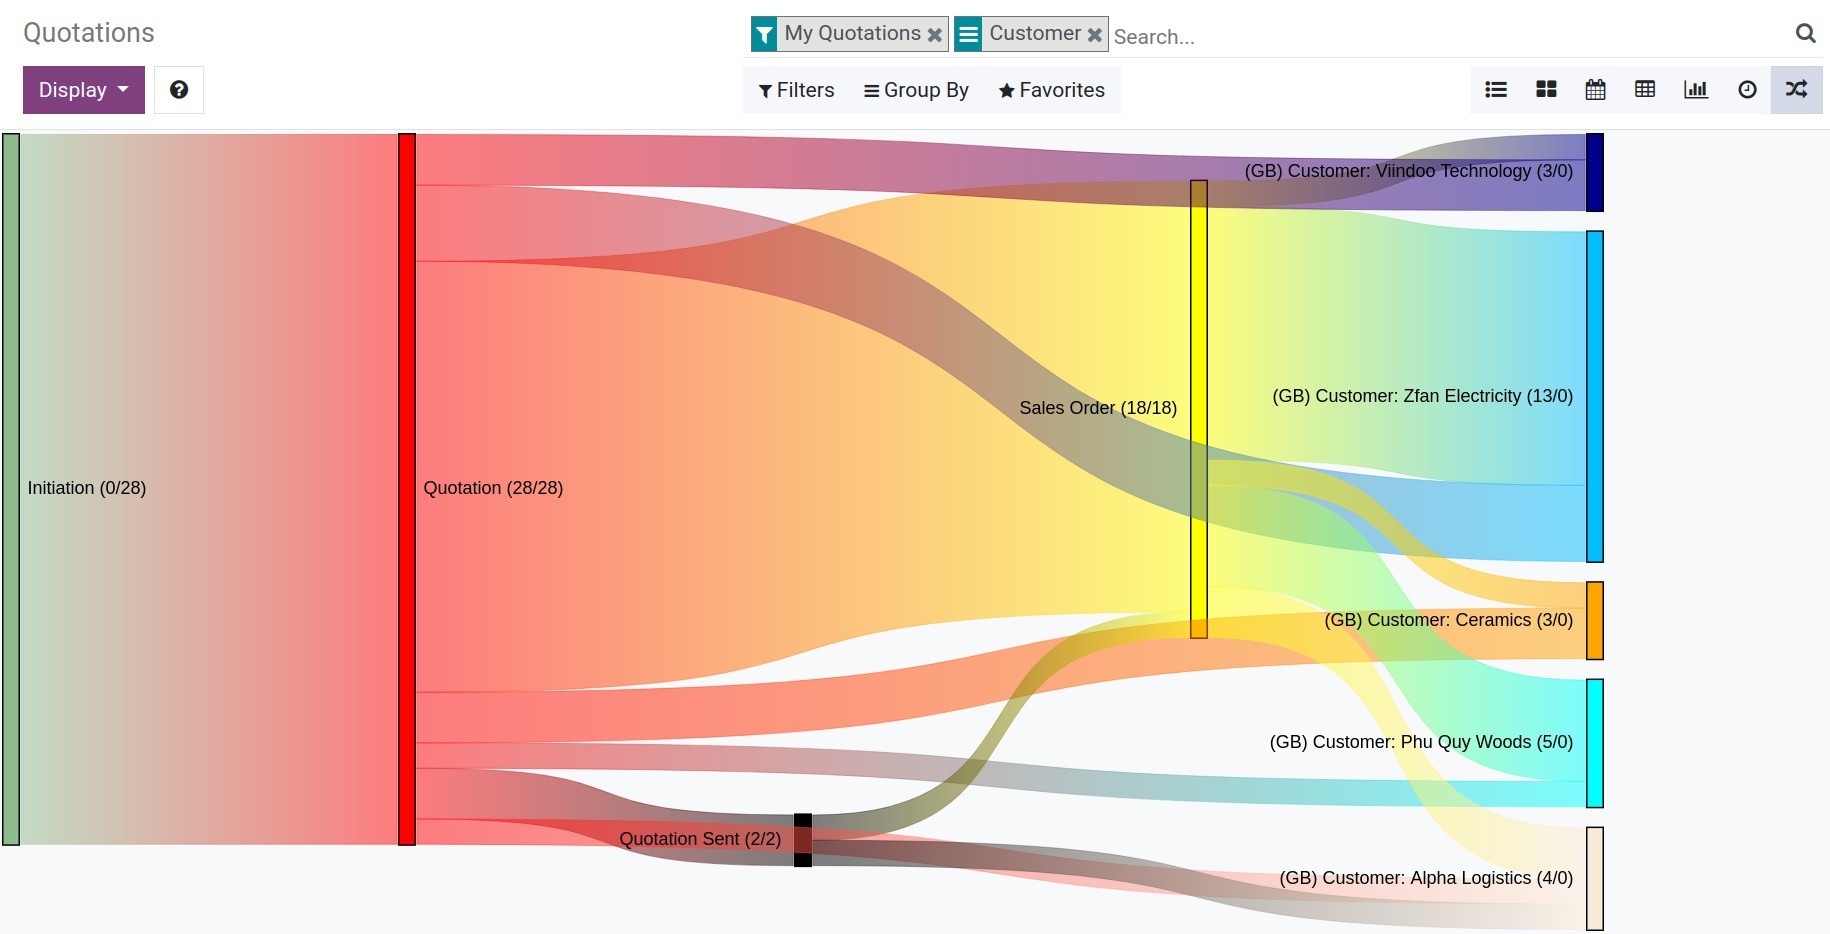
In this case, you can see:
We have total of 28 quotations and that’s included 3 quotations for Viindoo, 13 quotations for Zfan, 3 quotations for Ceramics, 5 quotations for Phu Quy Woods, and 4 quotations for Alpha Logistics.
2 quotations in Quotation Sent stage are converted, 1 for Phu Quy Woods and 1 for Alpha Logistics.
We also see, those 18 quotations are converted to sales orders. And there are included 1 for Viindoo, 10 for Zfan, 1 for Ceramics, 4 for Phu Quy Woods, and 2 for Alpha Logistics. To see the details, please move the cursor to the respective flow.
See also
Related article
Optional module