Payroll Contribution History
Viindoo Payroll management app supports view report on the contribution history of each employee’s salary, from the time they started working at your company to the present.
To view the report, navigate to Payroll ‣ Reports ‣ Payroll Contribution History.
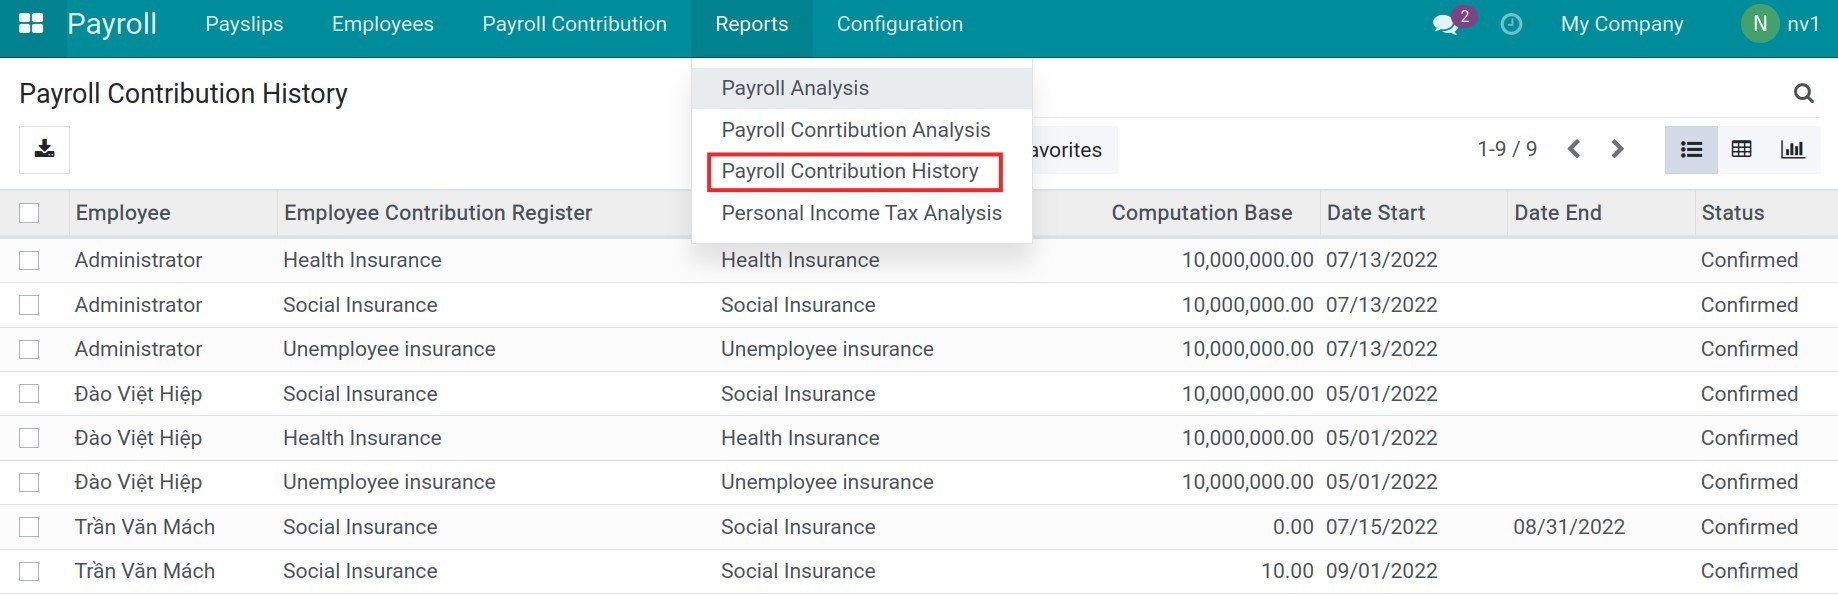
You can view this report in a variety of formats such as list view, pivot analysis view, and graph view.
Payroll Contribution History List View Report
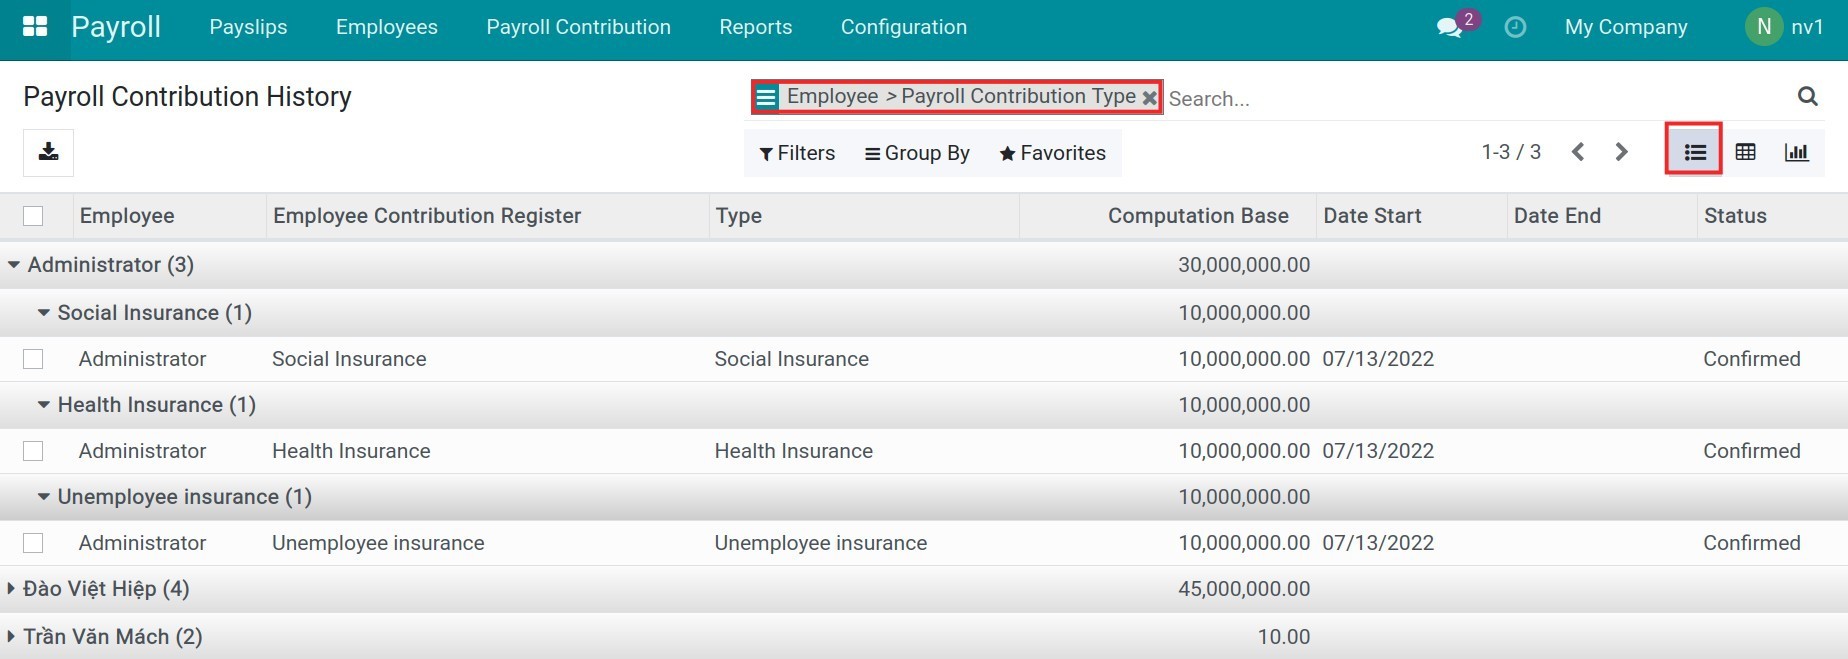
With reports in list view, you can view detailed information of the contribution history from the salary of each employee: computation base, start/end date, status, etc.
Use the filters and groups feature to see the report with your desired information:
You can save your current search in the Favorites filter to use as default or share it with your colleagues:
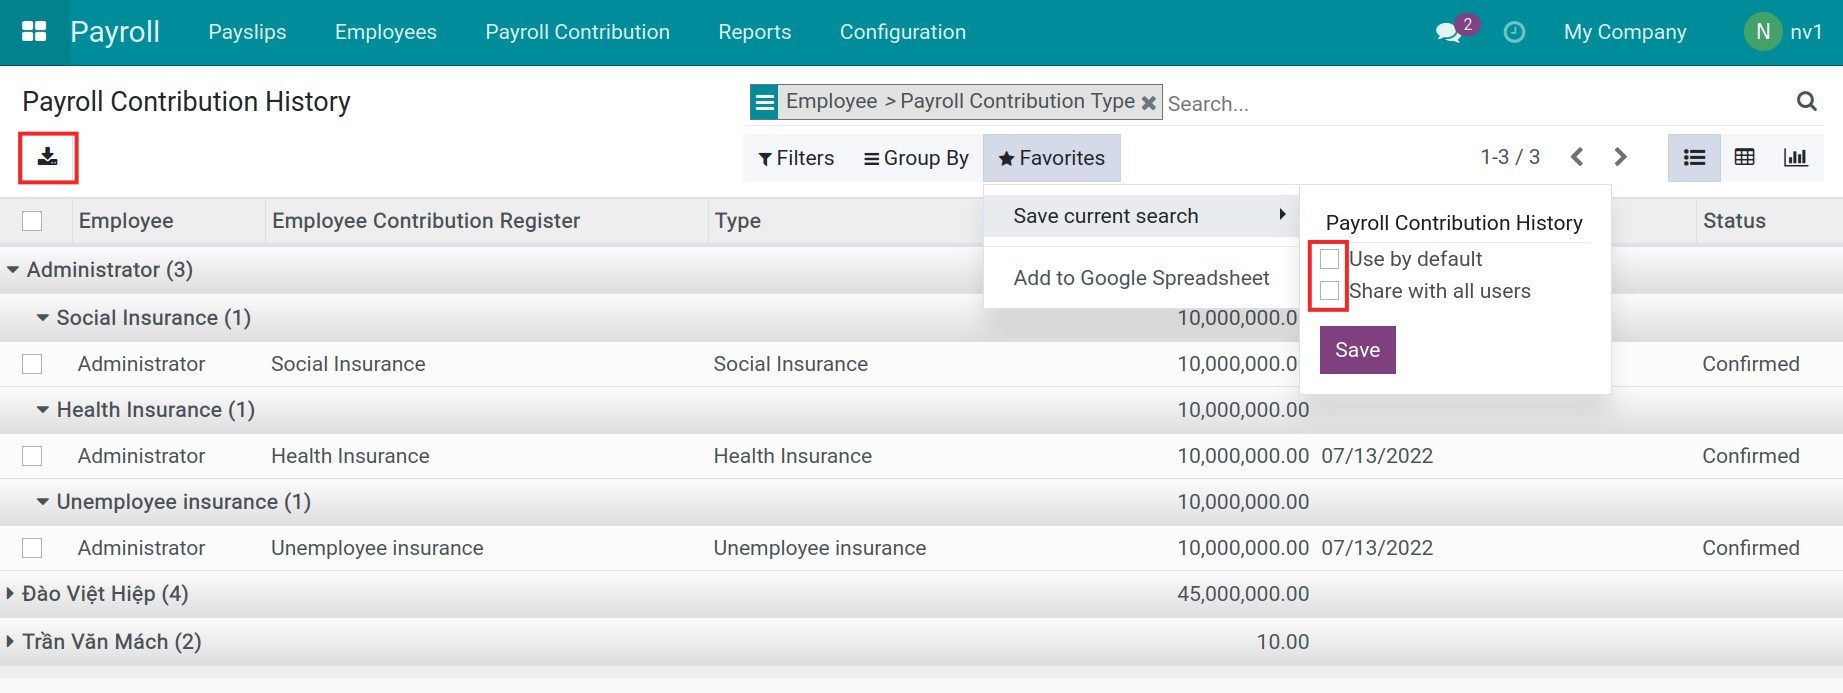
You can also export the report to an excel file for later use.
Payroll Contribution History Pivot Report

This report format provides the following measures for your analysis:
Company Contribution Rate (%) (see details at Configure the payroll contribution type article;
Employee Contribution Rate (%) (see details at Configure the payroll insurance contribution type article;
Monthly Maximum Contribution by Company;
Monthly Maximum Contribution by Employee;
Count.
In addition, it supports some functions as follow:
Use the filters and groups to filter and group as your desired information.
Click “+”, “-” button to view more information in pivot table.
Besides, you can export this pivot report to an excel file for later use.
Payroll Contribution History Graph View Report
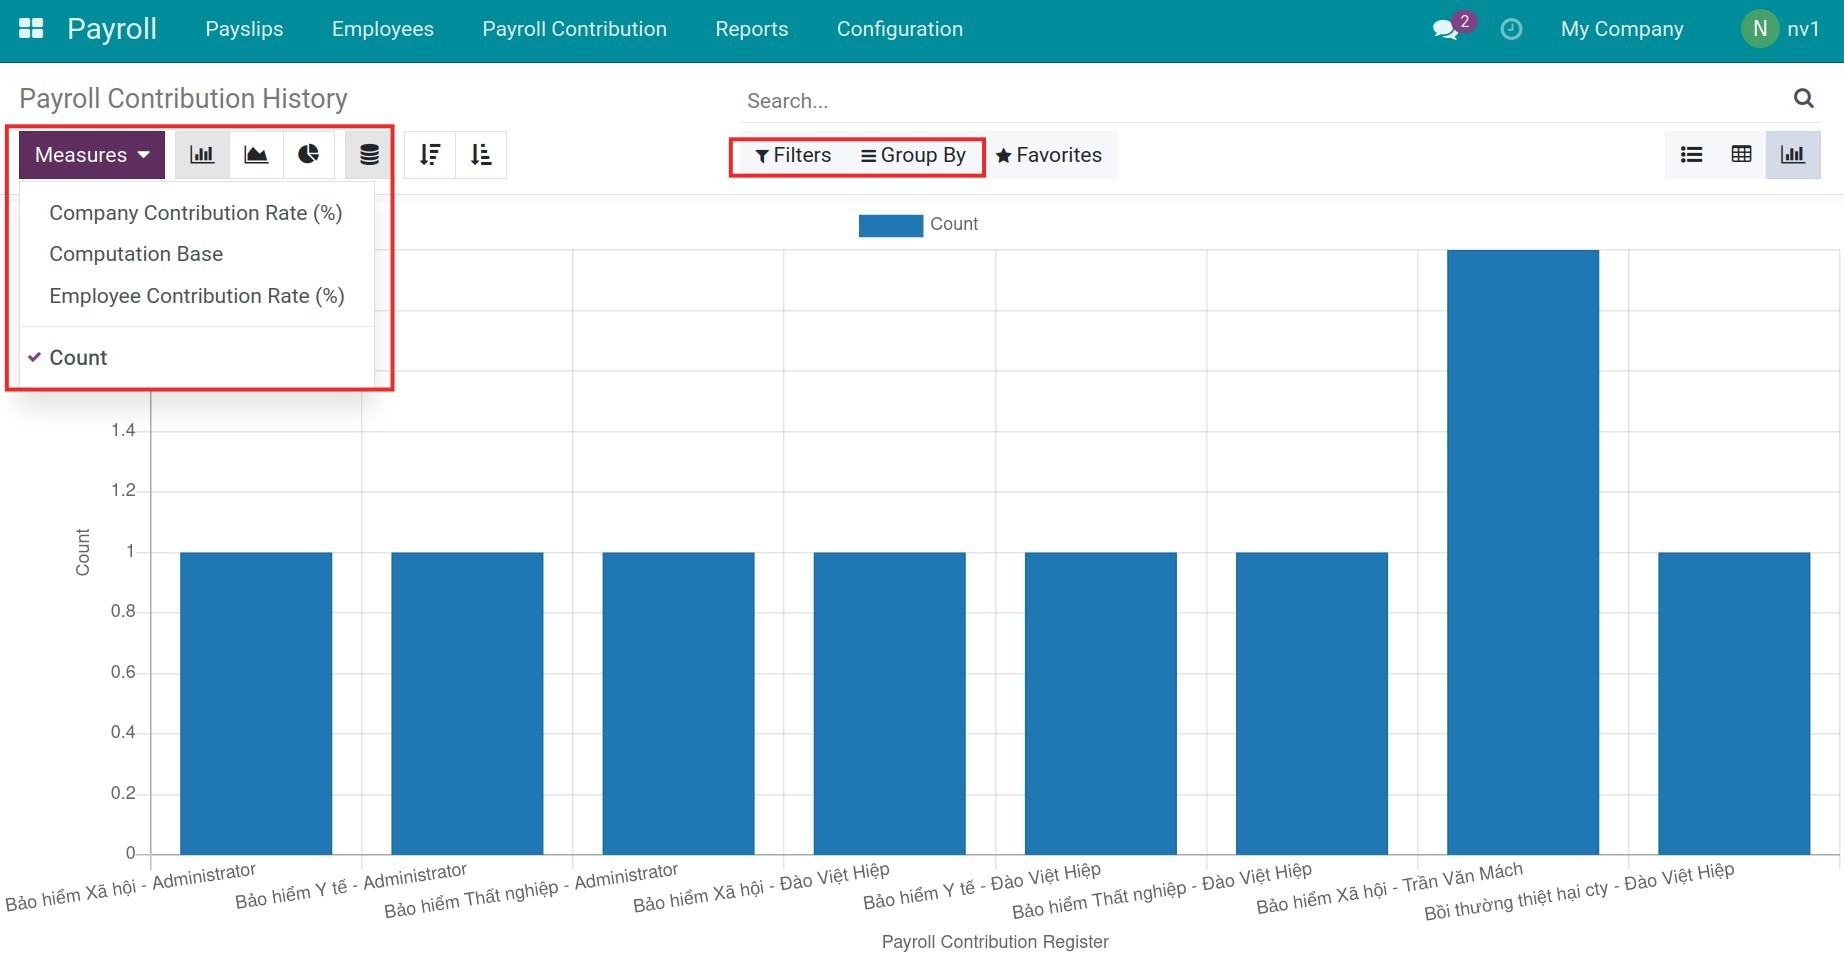
With reports in graph view, you can:
View reports with the measures as the pivot analysis report.
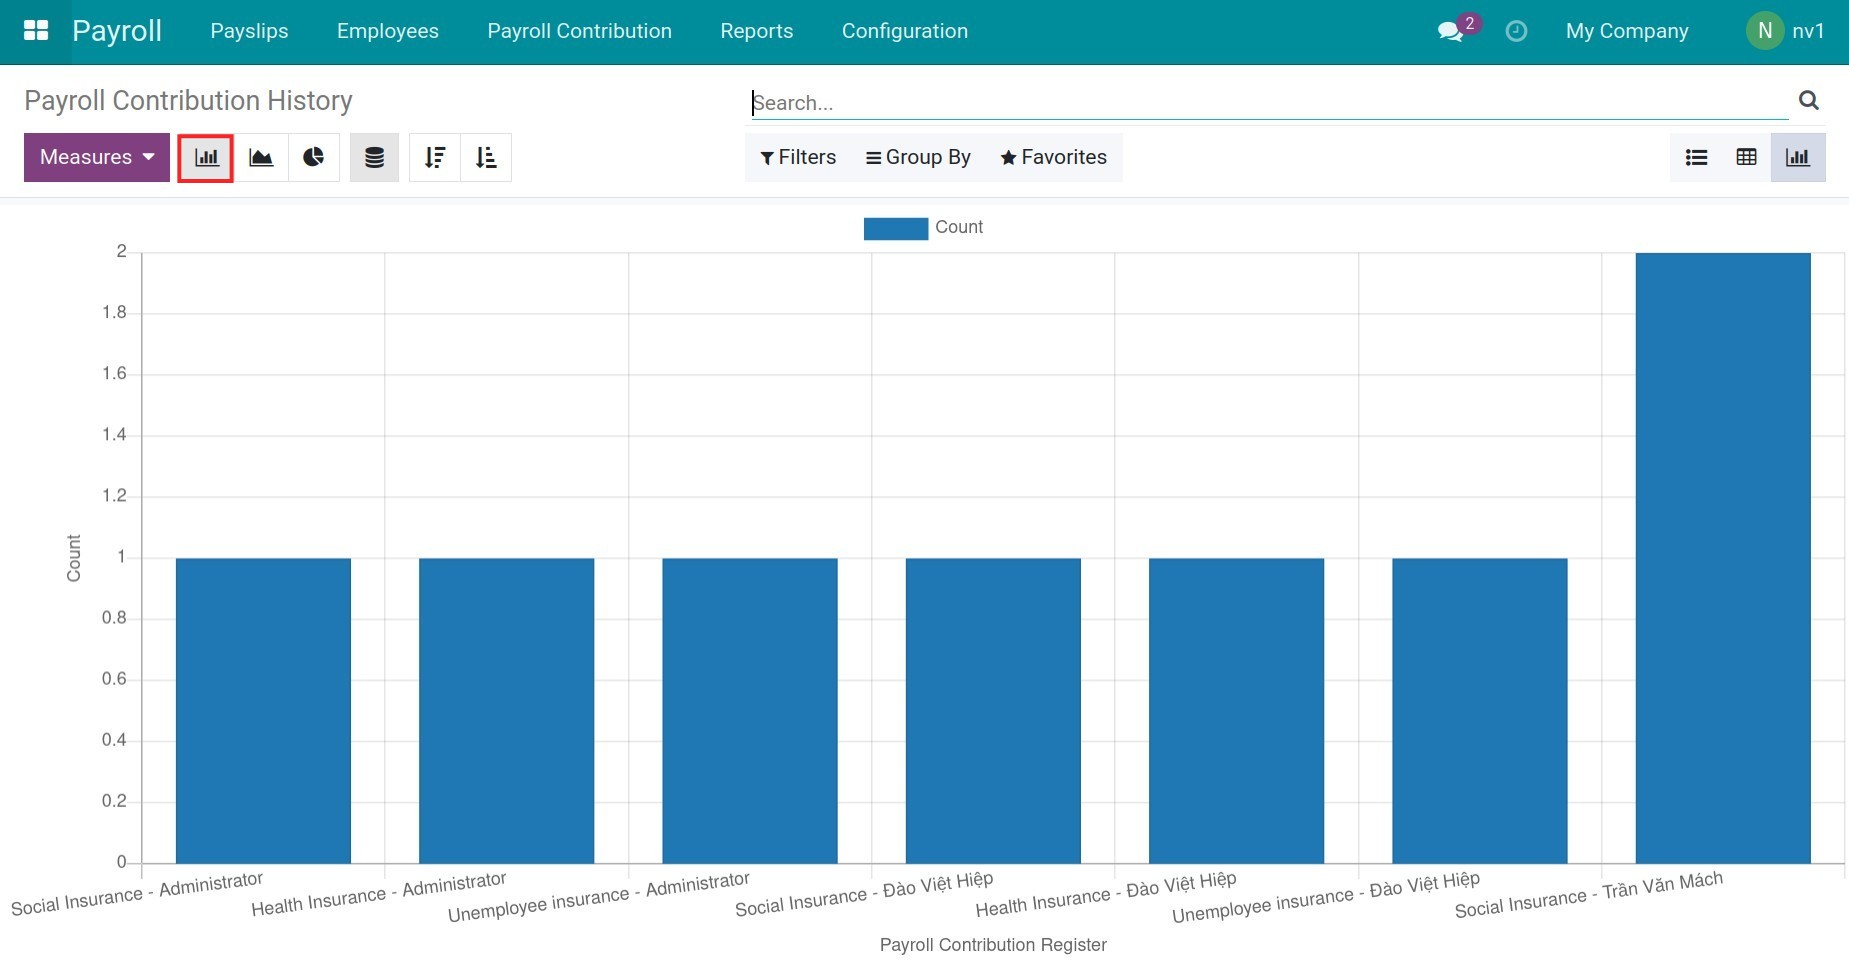
View reports in other graph formats such as bar, line, and pie chart.
Vertical axis value is based on Measures, horizontal axis value is based on Group by.
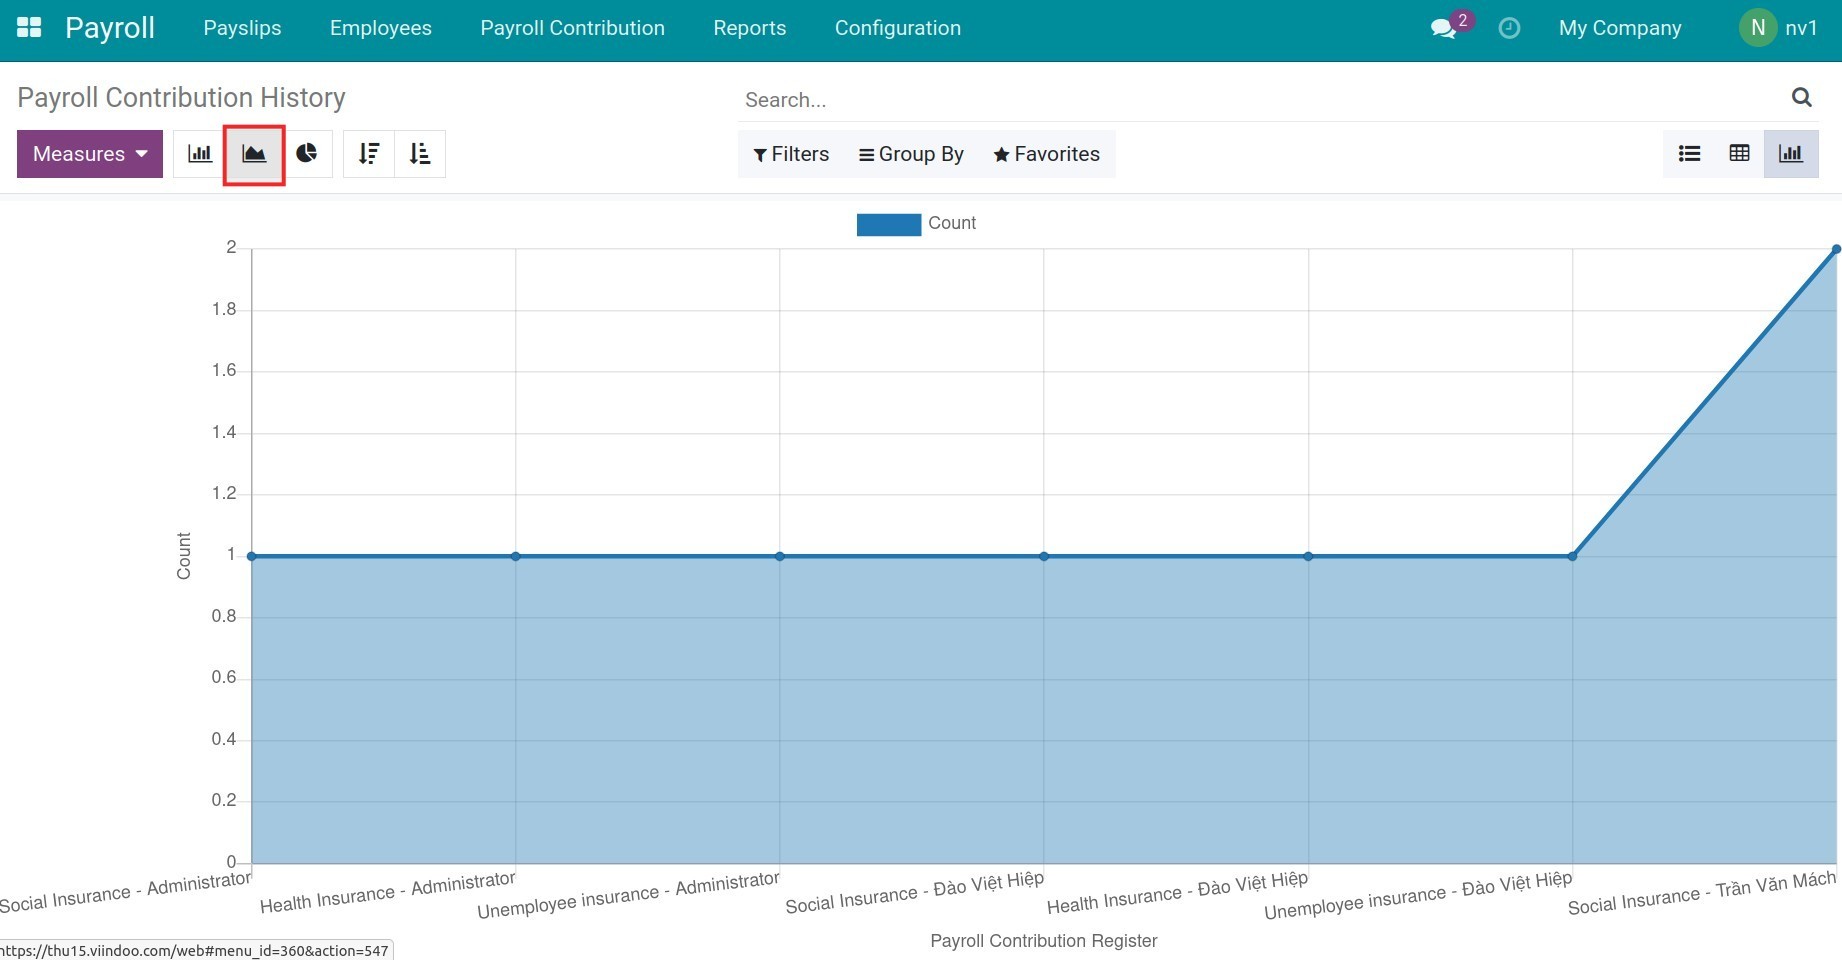
Bar chart![Payroll contribution history bar chart - Viindoo]() Line chart
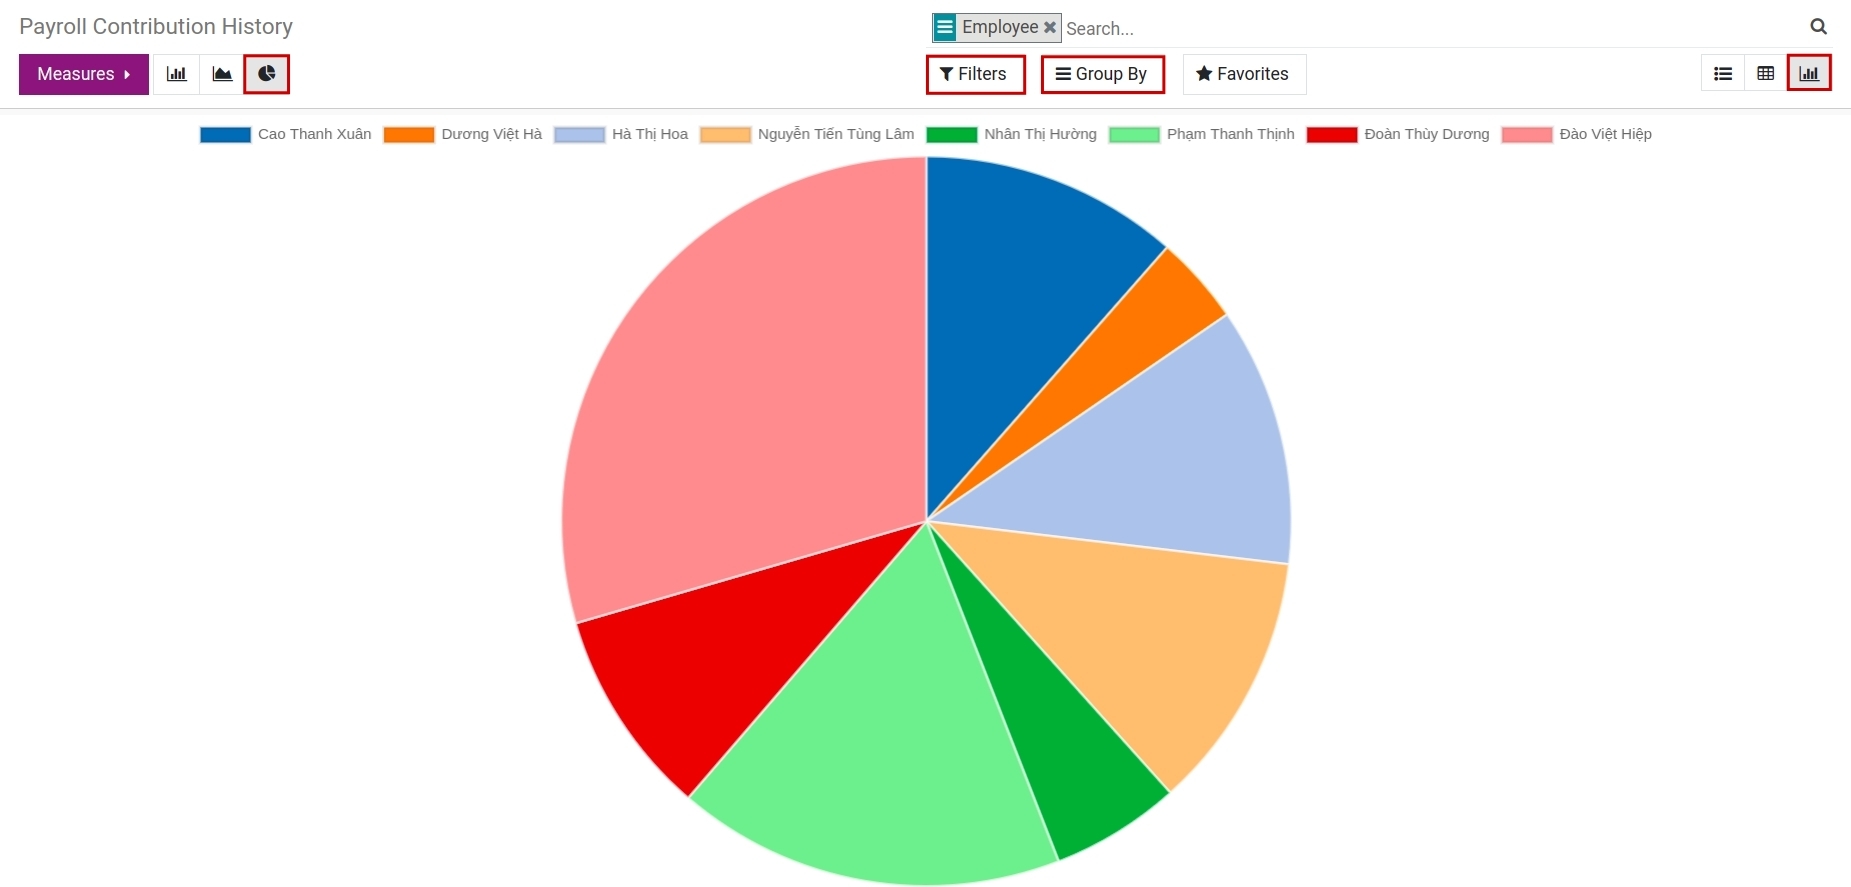
Line chart![Payroll contribution history line chart - Viindoo]() Pie chart
Pie chart![Payroll contribution history pie chart - Viindoo]()
See also
Related article
Optional module