Reporting
Viindoo Repairs app allows tracking repair orders based on products/part products or customers.
Currently, the system provide 2 main reports:
Repair Analysis;
Orders.
Repair Analysis report
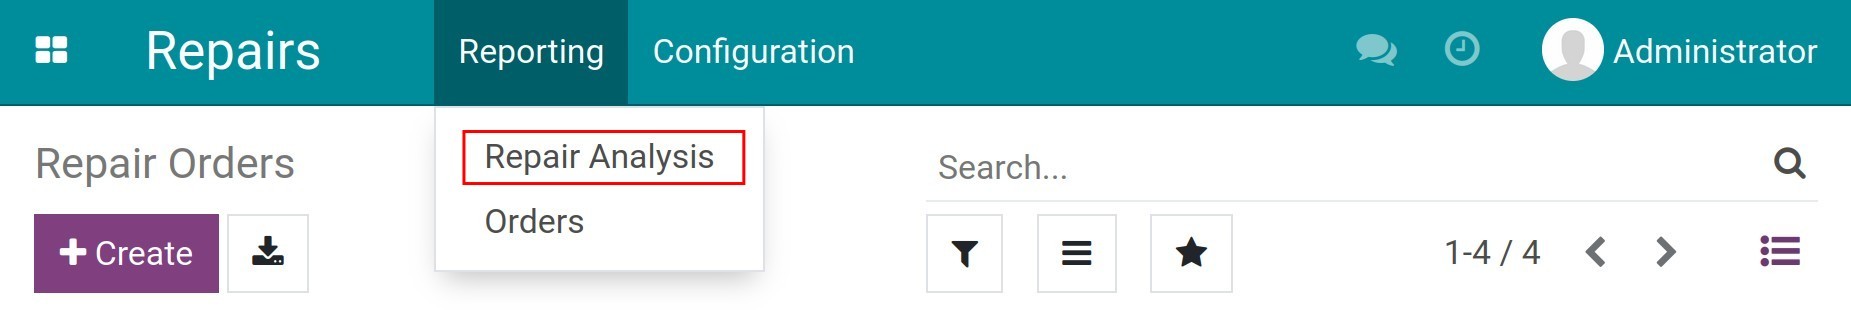
Repair analysis helps you keep track of the consumed product in a period of time or in each repair order. To view the report, navigate to .
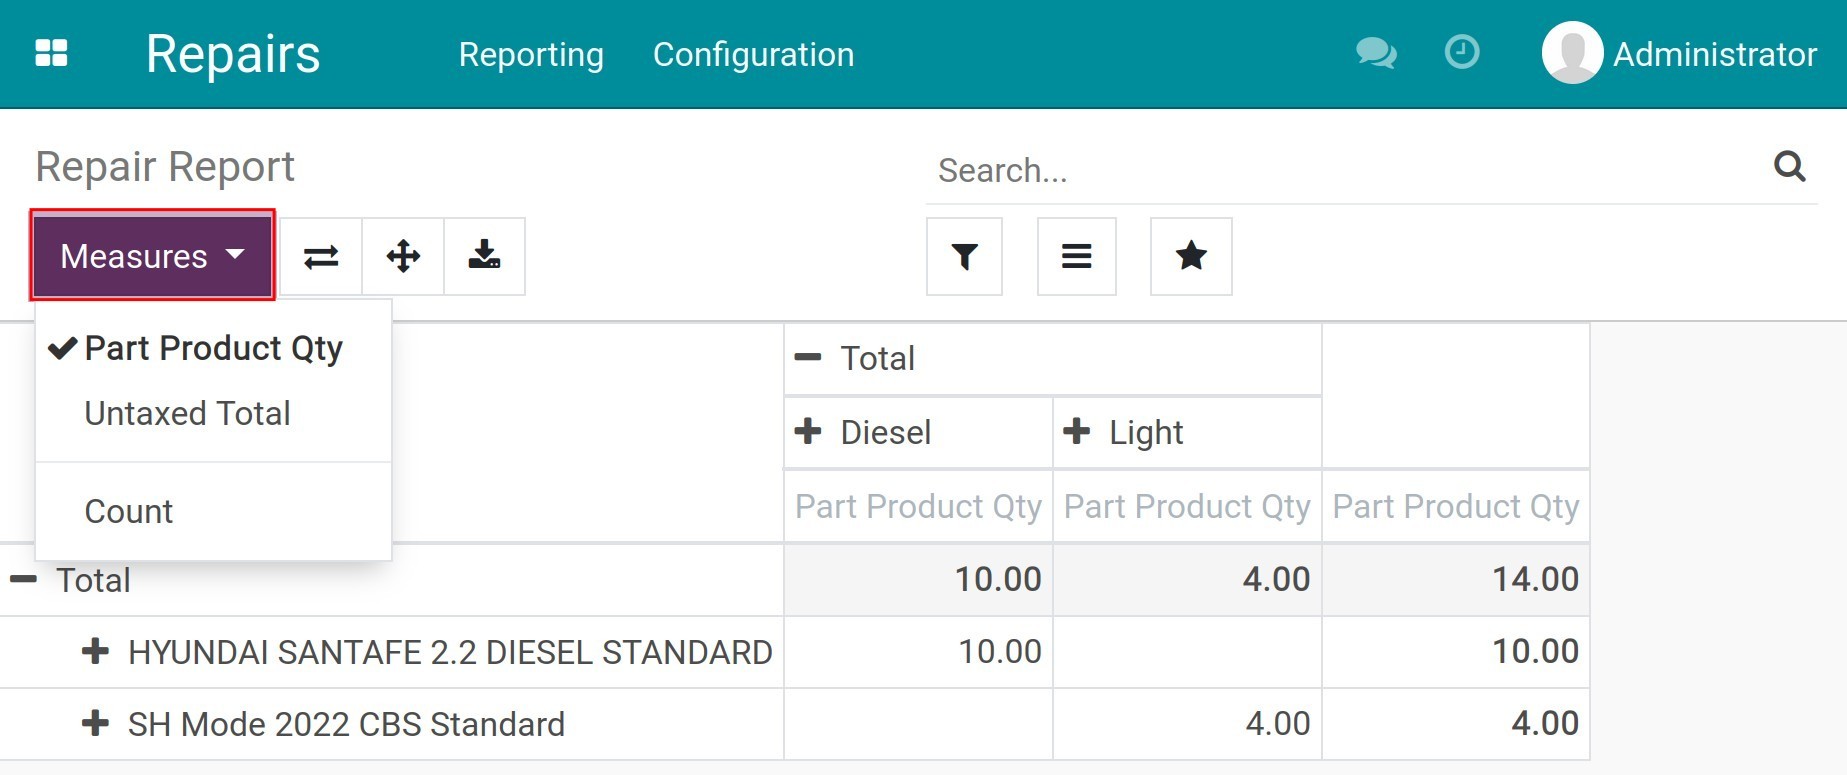
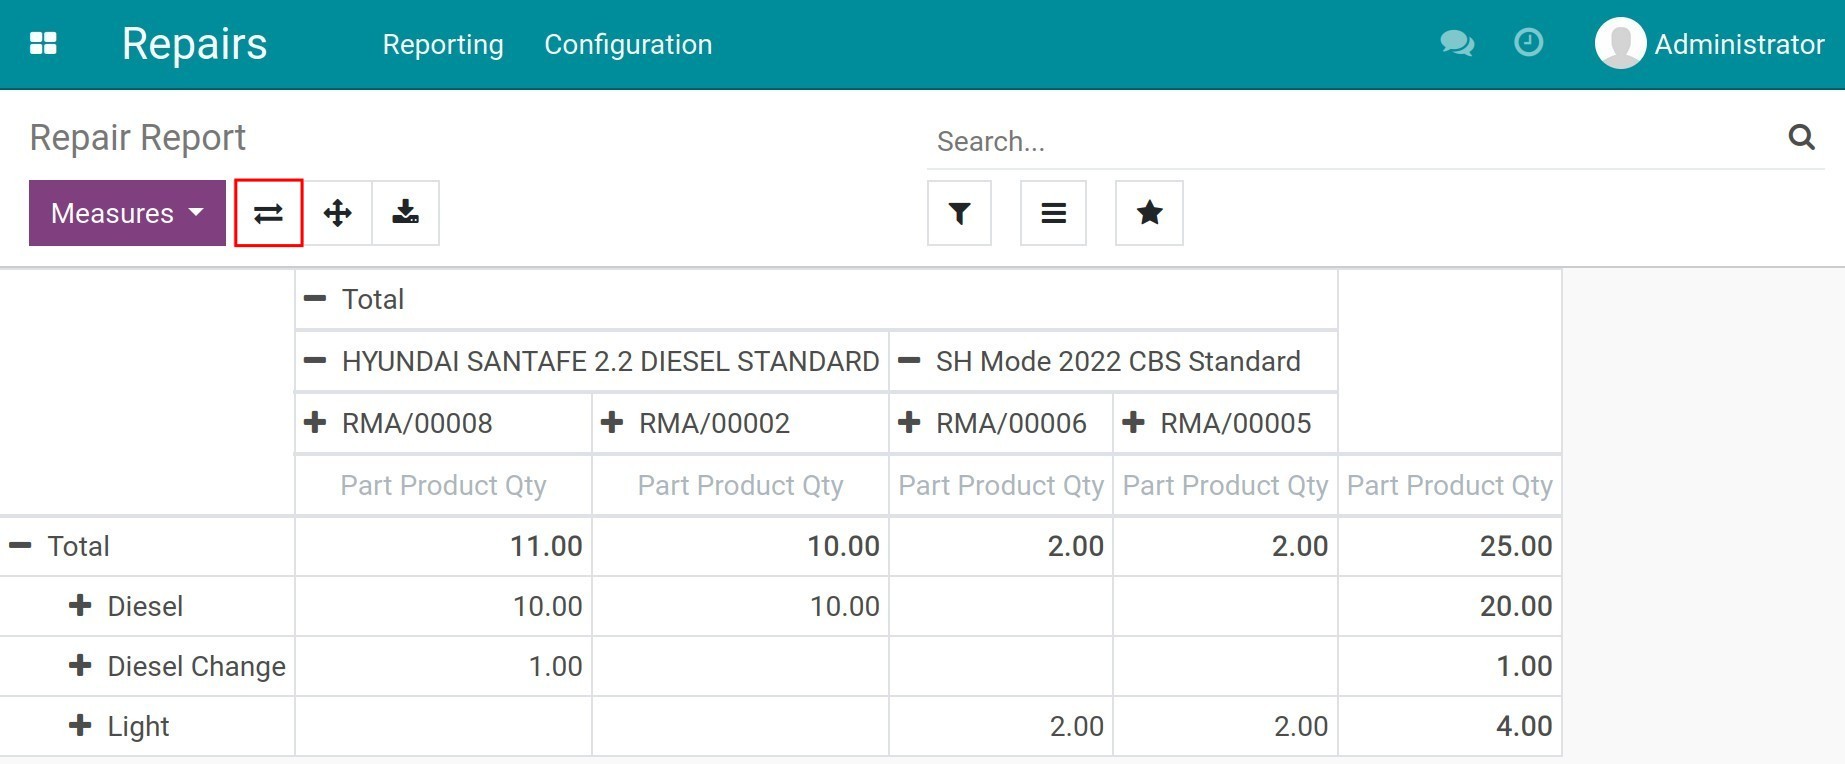
By default, the system will view the report with Repair Product and Part Product Quantity on the columns and the rows. To select other criteria for the rows, press Measures. The system allows showing multiple criteria at once.
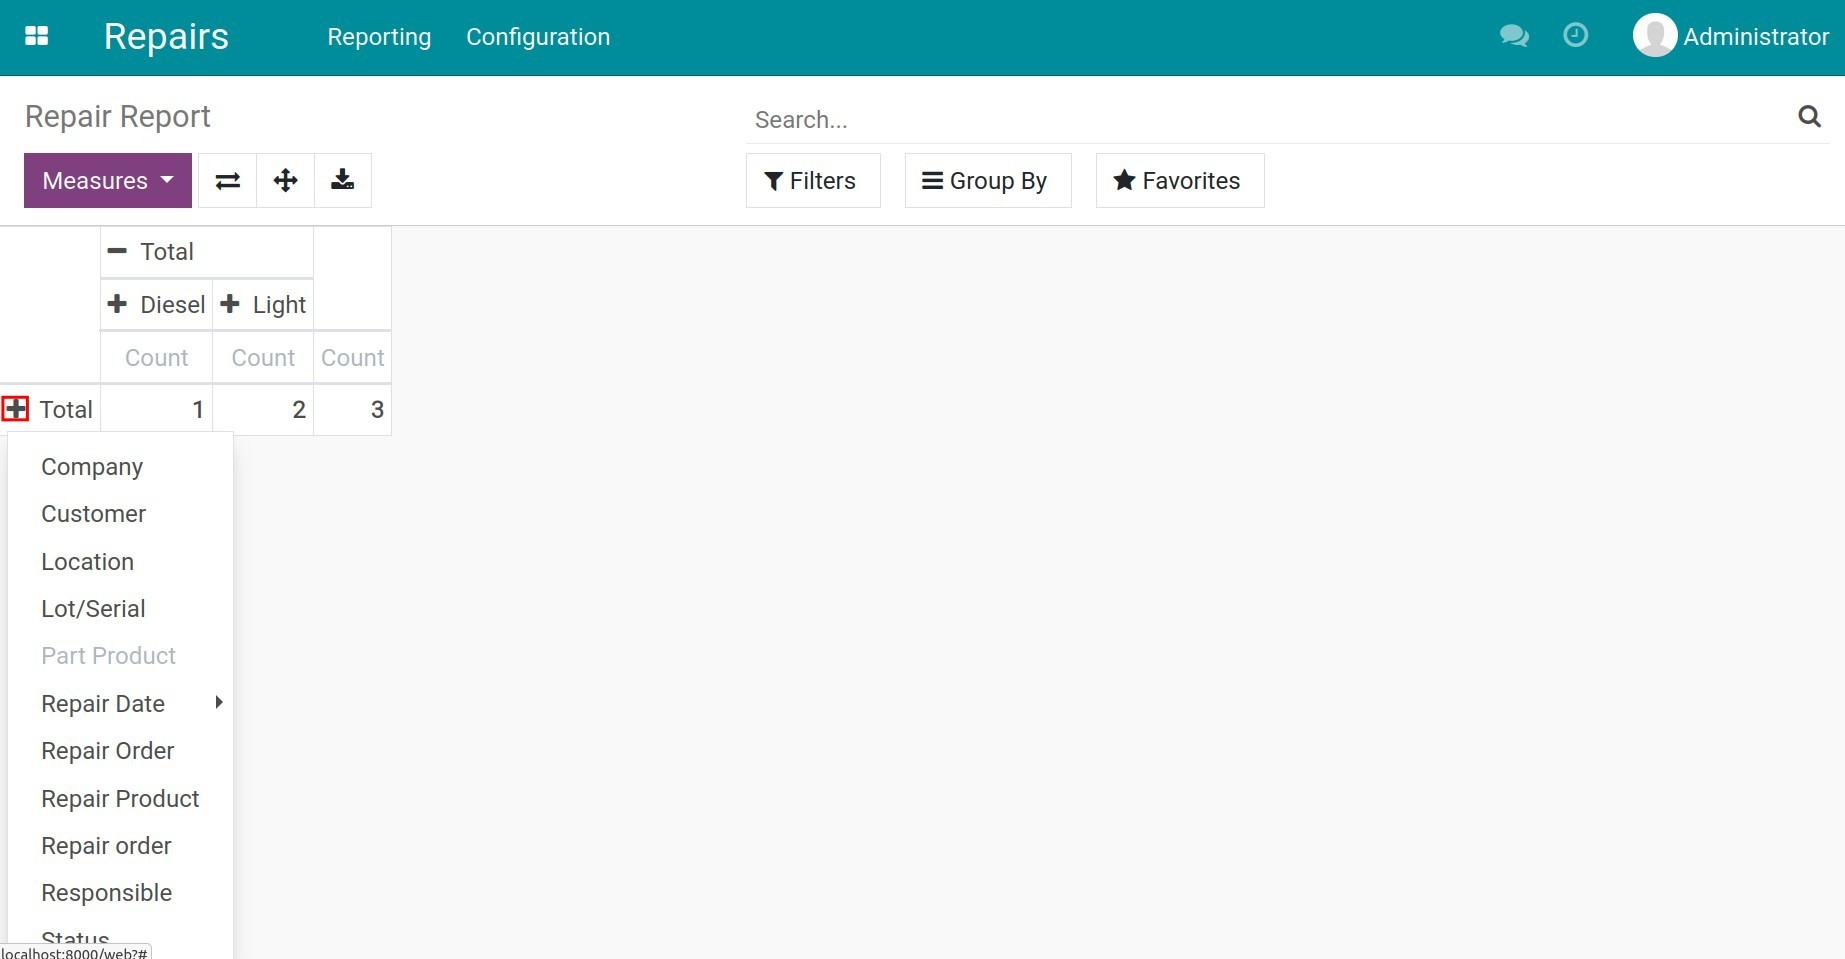
Press + to select the row’s criteria, eg. Repair order, repair date, etc.
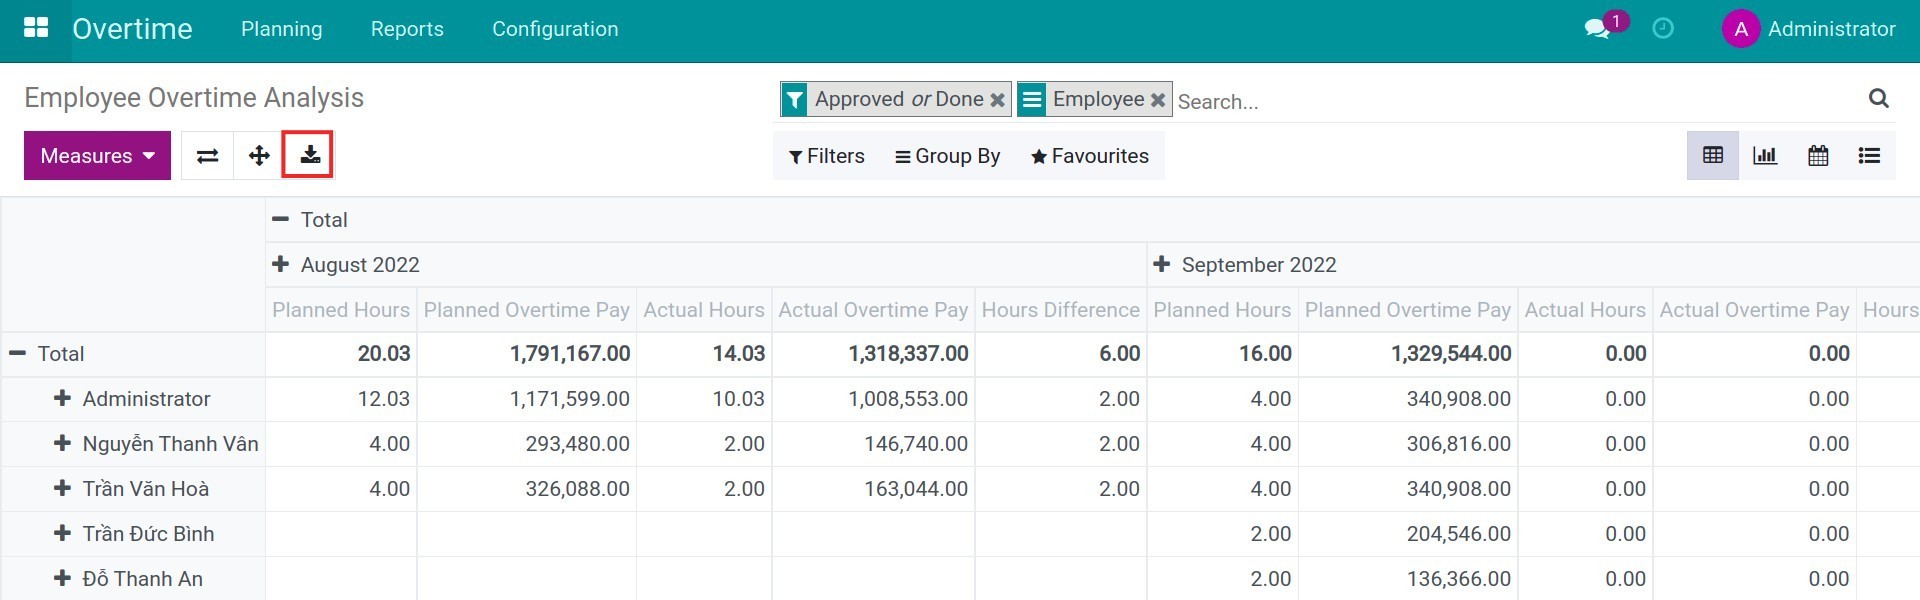
Not only can you view the report directly in the system, but you can also download the report with the chosen criteria to an excel file by pressing the Download xlsx button.
You can also switch the criteria of the columns for the rows.
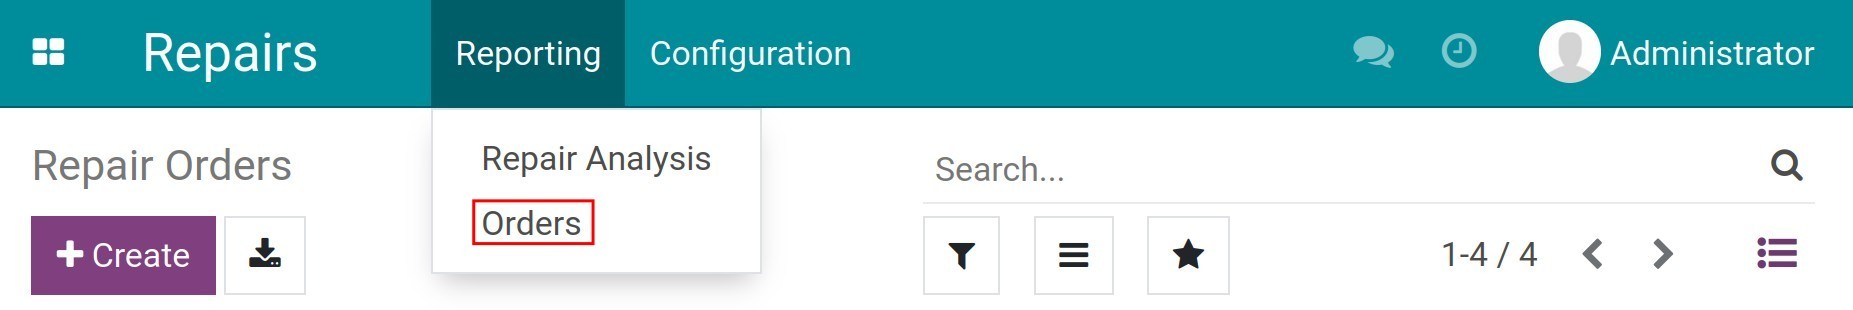
Orders report
With the order report, you can view the repair revenue based on repair product, repair order or period. To view the report, navigate to .
See also
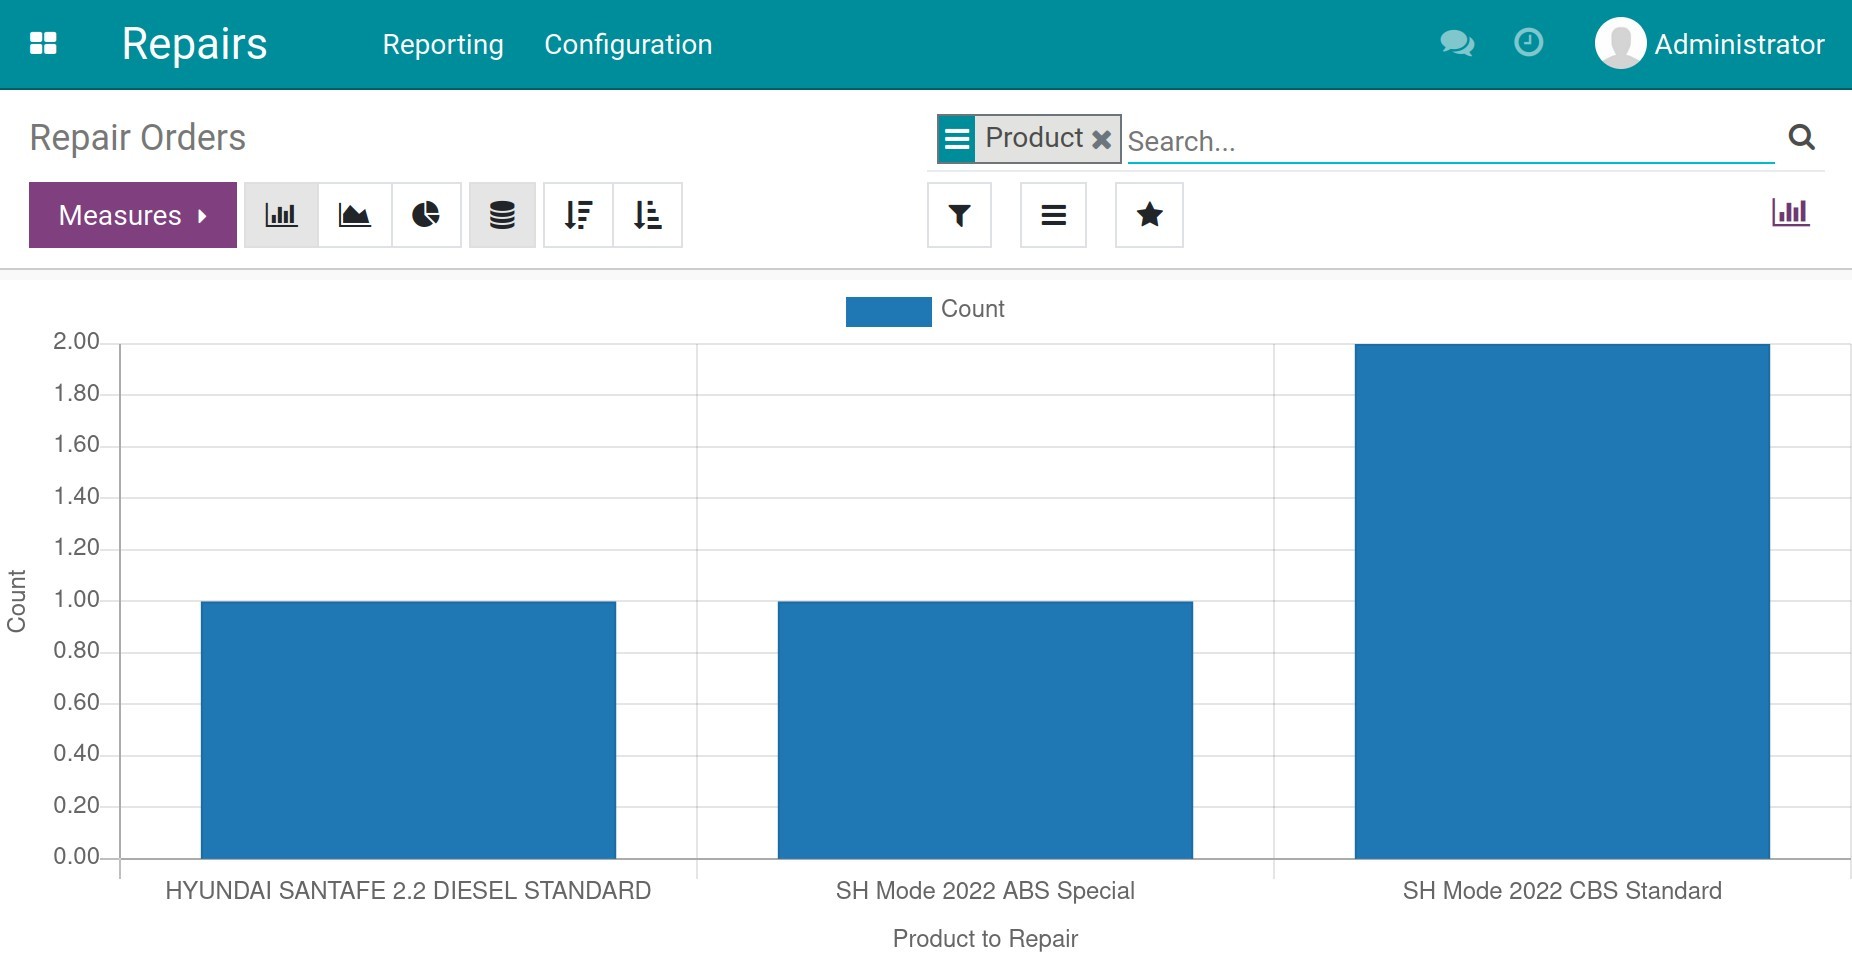
By default, the system will view the report with Count on the verticle axis and Product to Repair on the horizontal axis.
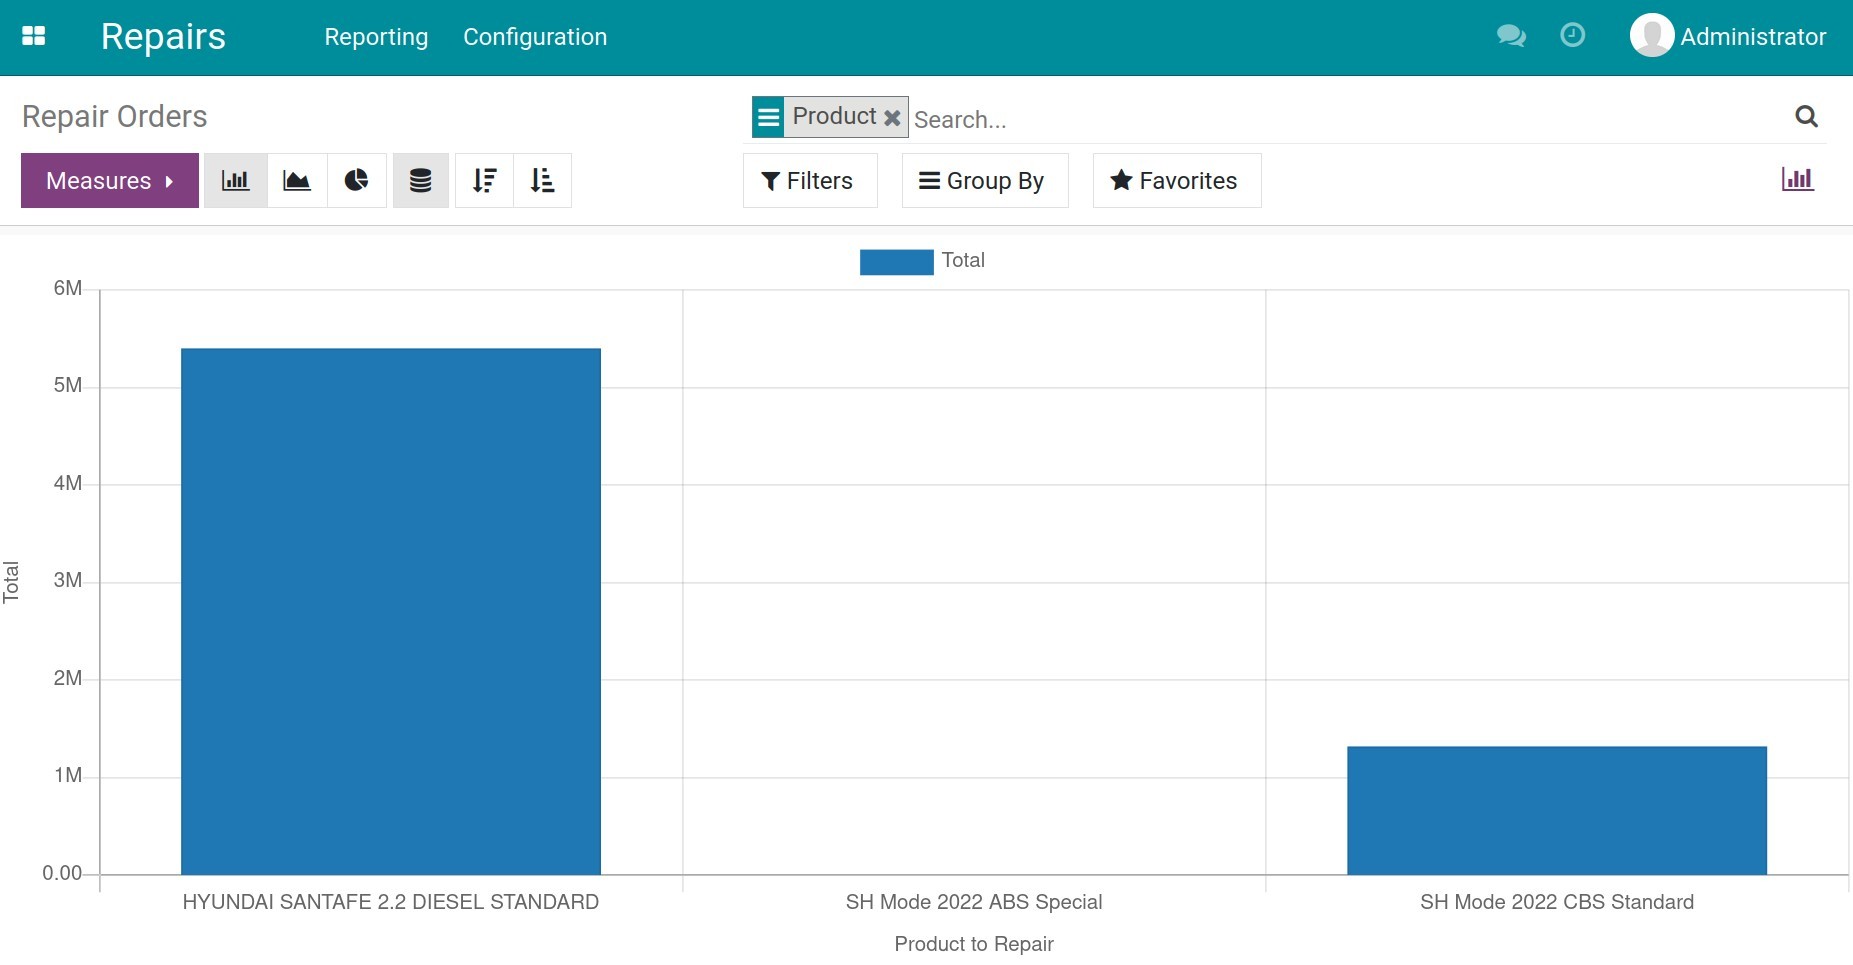
To view the total revenue of repairing activities based on repair products, select Total measure and group by Product.
Moreover, to analyze repair revenue based on time, you can move to the pivot report and use the Untaxed Amount, Taxes, Total and group by Product, Repair date: Day.
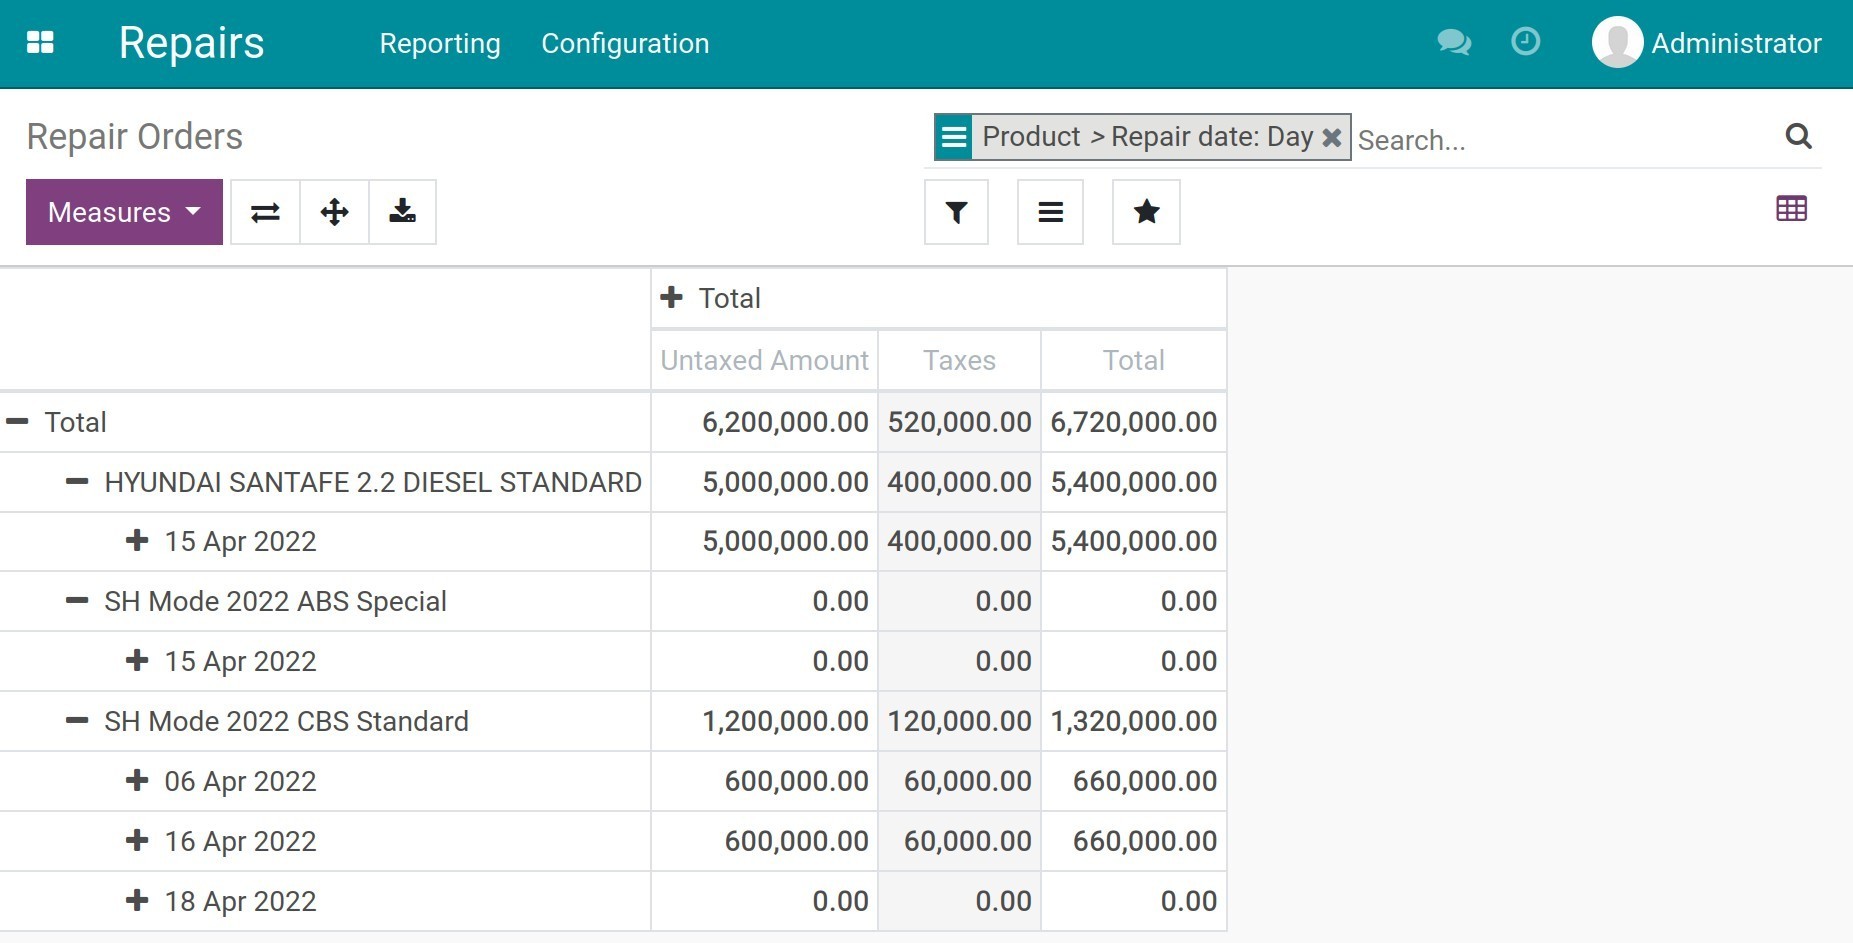
To learn more about other types of reports and other criteria, refer to Views and Reports.