Real-time stock reports
Viindoo Inventory Management App helps the warehouse manager can observe the detailed data of the inventory report, the movement, and the fluctuations of goods in the warehouse in real-time. The default reports in the Viindoo system include:
Requirements
This tutorial requires the installation of the following applications/modules:
To view these reports, you navigate to Inventory ‣ Reporting, then head to the report you want to see:

Warehouse Dashboard
According to the demand of each position as well as the purpose of users, you can choose the different views of reports: For instance, a chart to see an overview of the goods movement in the warehouse; an analysis form (pivot) for the detailed analyzing purposes such as the movement of each warehouse, the warehouse locations or even each product in the warehouse, etc. The system supports you in the following forms:
Graph analysis;
Co-hort analysis;
Pivot analysis.
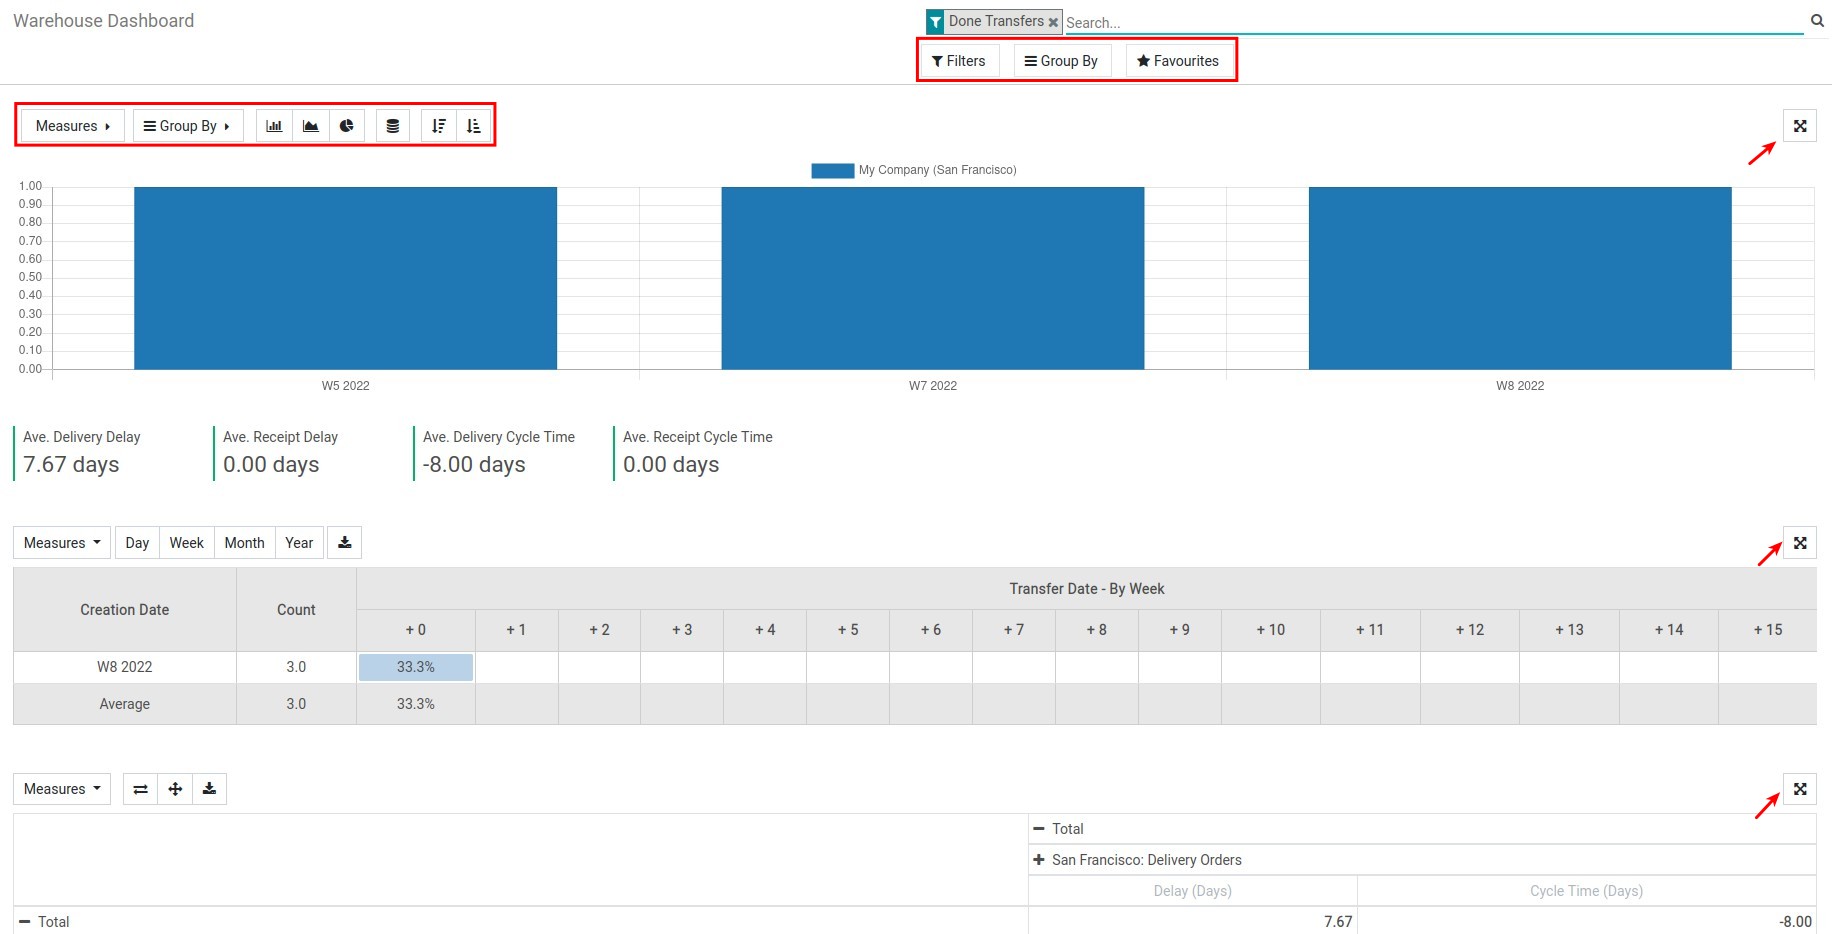
To view the expanded version of the report, you click on the fullscreen view on the right corner of it, you will be navigated to the detailed view of the analyzing report:
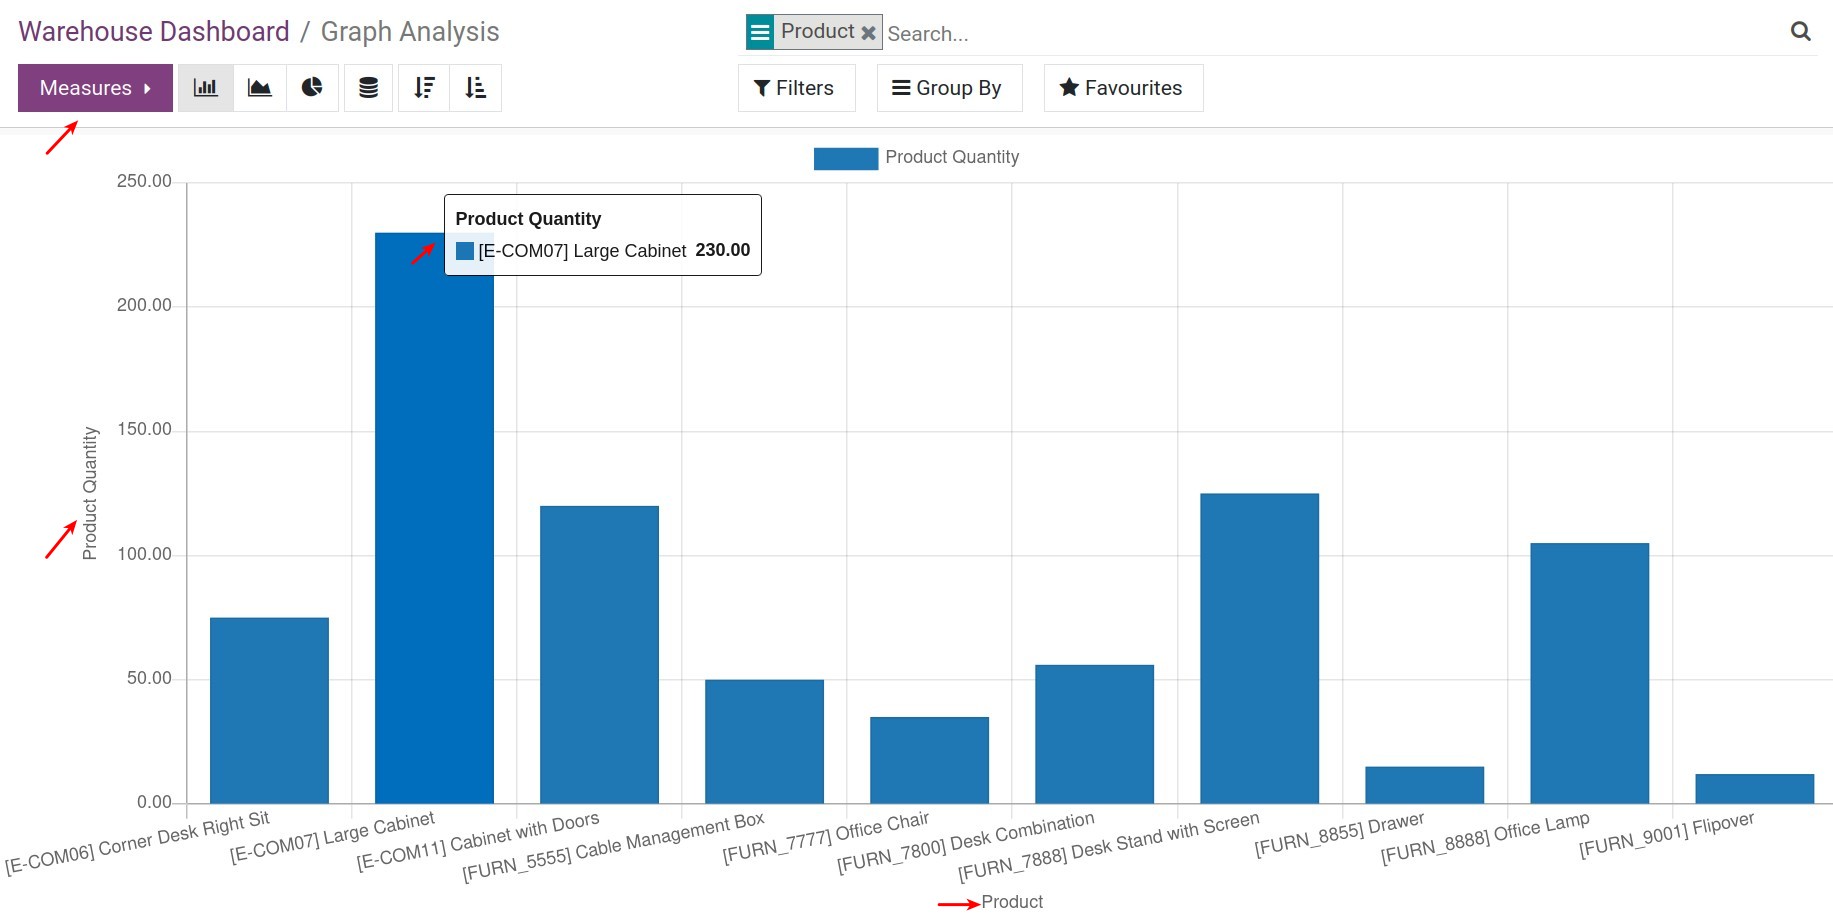
With this point of view, you can use filter tool to filter the data according to your demand: For example, you can filter the data for a period of time, with the different measures, or group them by one or many products with the same criteria, etc.
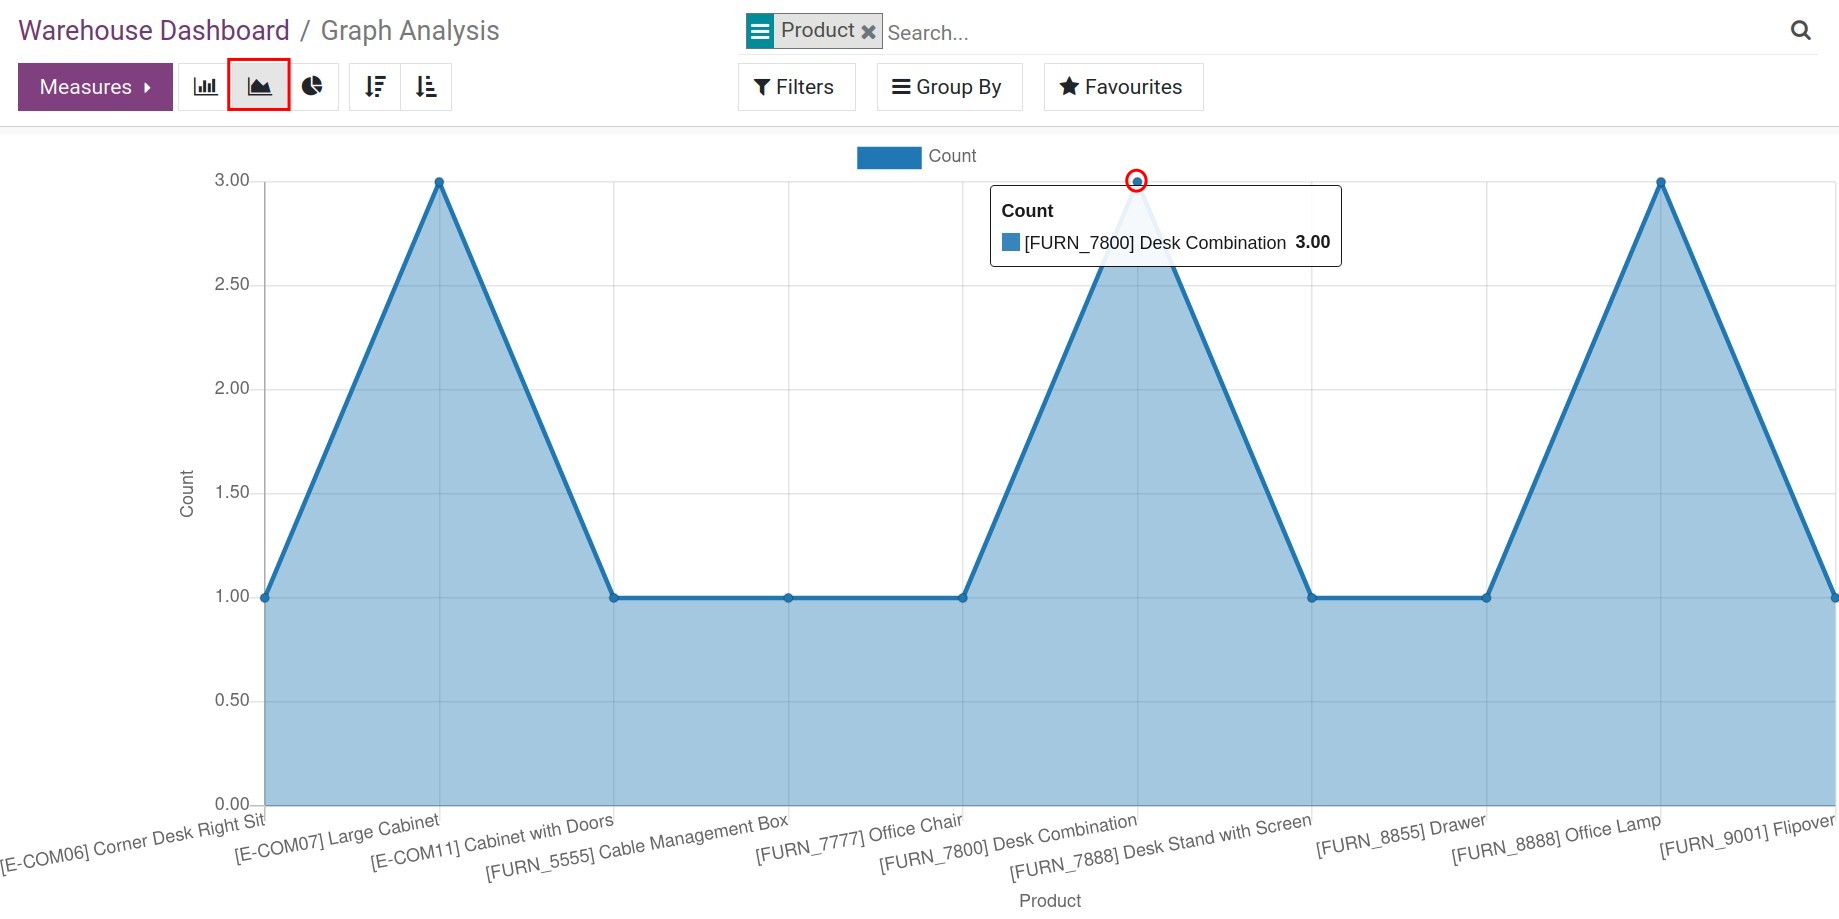
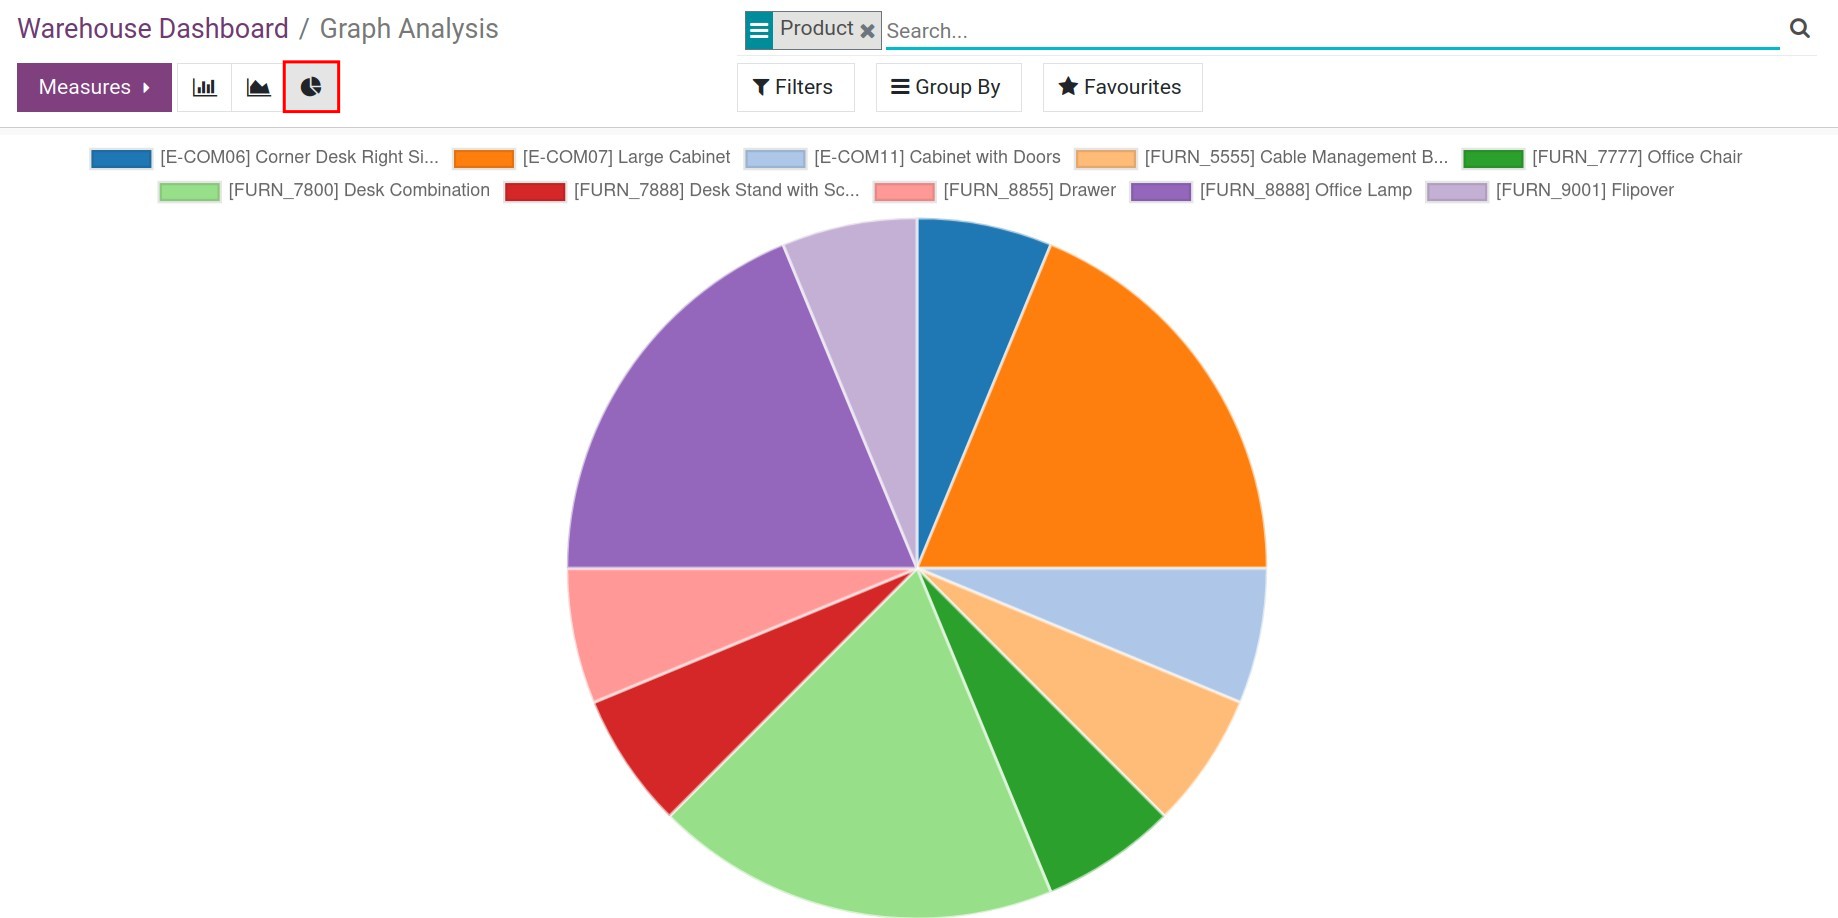
Besides, you also can view the different types of the inventory report such as the bar chart, the line chart, the pie chart, etc.
Line chart![Viindoo line chart overview report]() Pie chart
Pie chart![Viindoo pie chart overview report]()
It allows you to view the report of the stock receipts/deliveries completion rates by the multi-measures: Count, Product quantity, Cycle time (by days), or Delay (by days).

To view the details of the stock receipt/delivery, you can click on the data, the system will navigate you to the view that displays the list of stock receipts/deliveries for you to compare.
One of the most flexible and easy-to-use analytical reports:
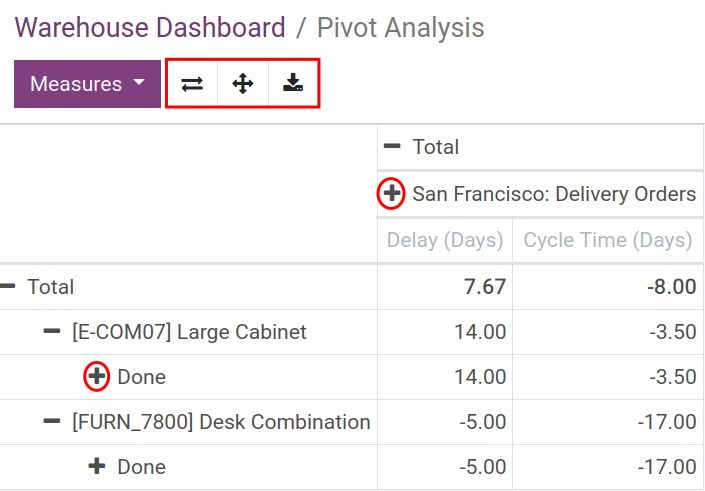
Pivot report supports you these features below:
Export the reports to excel file for the purpose of use.
Add parameters into columns by clicking on the plus sign (+) or clicking on the minus (-) sign when you want to hide the values of those parameters.
Change the axis of the report or expand all of the selected values.
Inventory Report
Inventory report provides you available quantity and on hand quantity, you navigate to Inventory ‣ Reporting ‣ Inventory Report. Depending on your purpose, you can use the filter tool to filter by the warehouse, the products, or group by the Product categories, etc.

In the report you will see the following fields:
Product: The list of all products and product variants with the type Storable which has the available quantity in the warehouse.
Location: The location where the product or product variant is stored. This location can be an internal or a virtual location.
Lot/Serial Number: Record the lot/serial numbers of products tracked by the lot or serial number.
Available Quantity: The available quantities of products in stock.
On Hand Quantity: Total of the on hand quantity = the available quantity + the reservation quantity.
Owner: The owner of the product.
You can see the Inventory report at a random date when clicking on the Inventory at Date button and selecting the needed date to view the report:

In addition, you can export this inventory report to excel when hitting on the Download xlsx button.

Forecasted Inventory
Forecasted inventory is calculated as the available quantities of products in stock (+) the number of products in the confirmed purchase orders (-) the number of products in the confirmed sale orders. Therefore, the forecasted inventory report allows you to see the trend in the forecast demand of products at any given time.
You navigate to Inventory ‣ Reporting ‣ Forcasted Inventory. Use the group by tool to group by Product and after that group by Date (choose Month option):
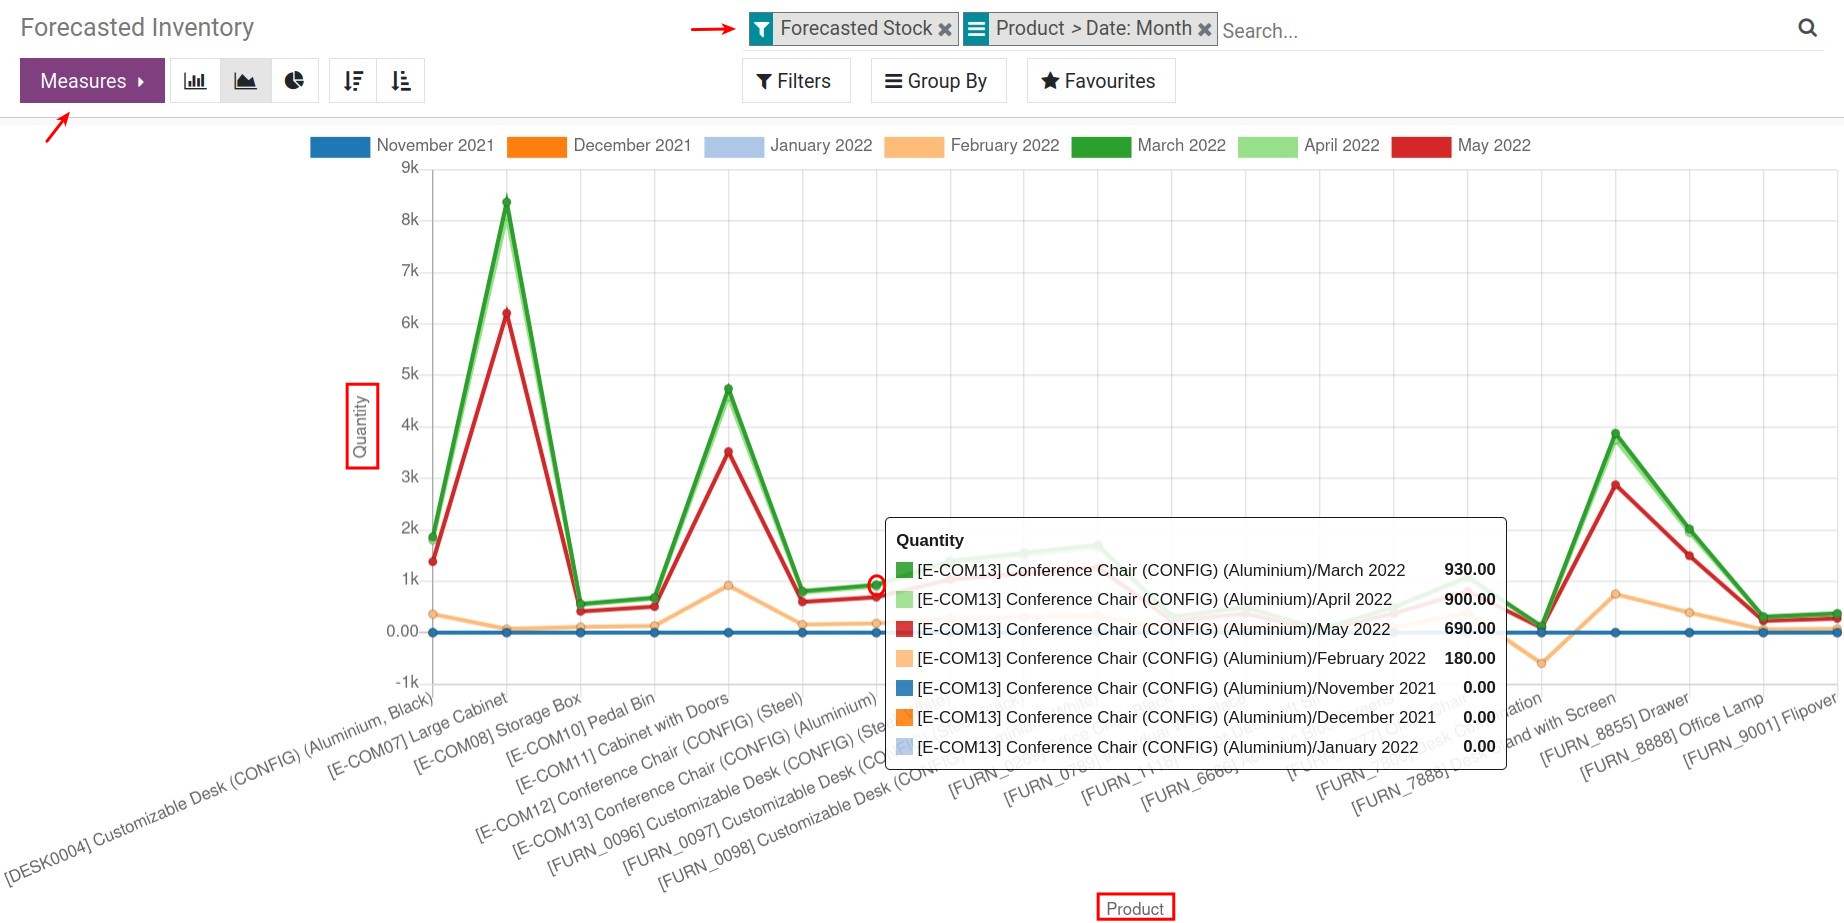
On the report, you can also use the filter tool to view it according to different criteria or move the pointer over the report to see the accurate forecasted inventory of the product.
Product Moves
To see this reports, you navigate to Inventory ‣ Reporting ‣ Product Moves. From this type of report, you can see the status of the stock receipt/delivery in the system:
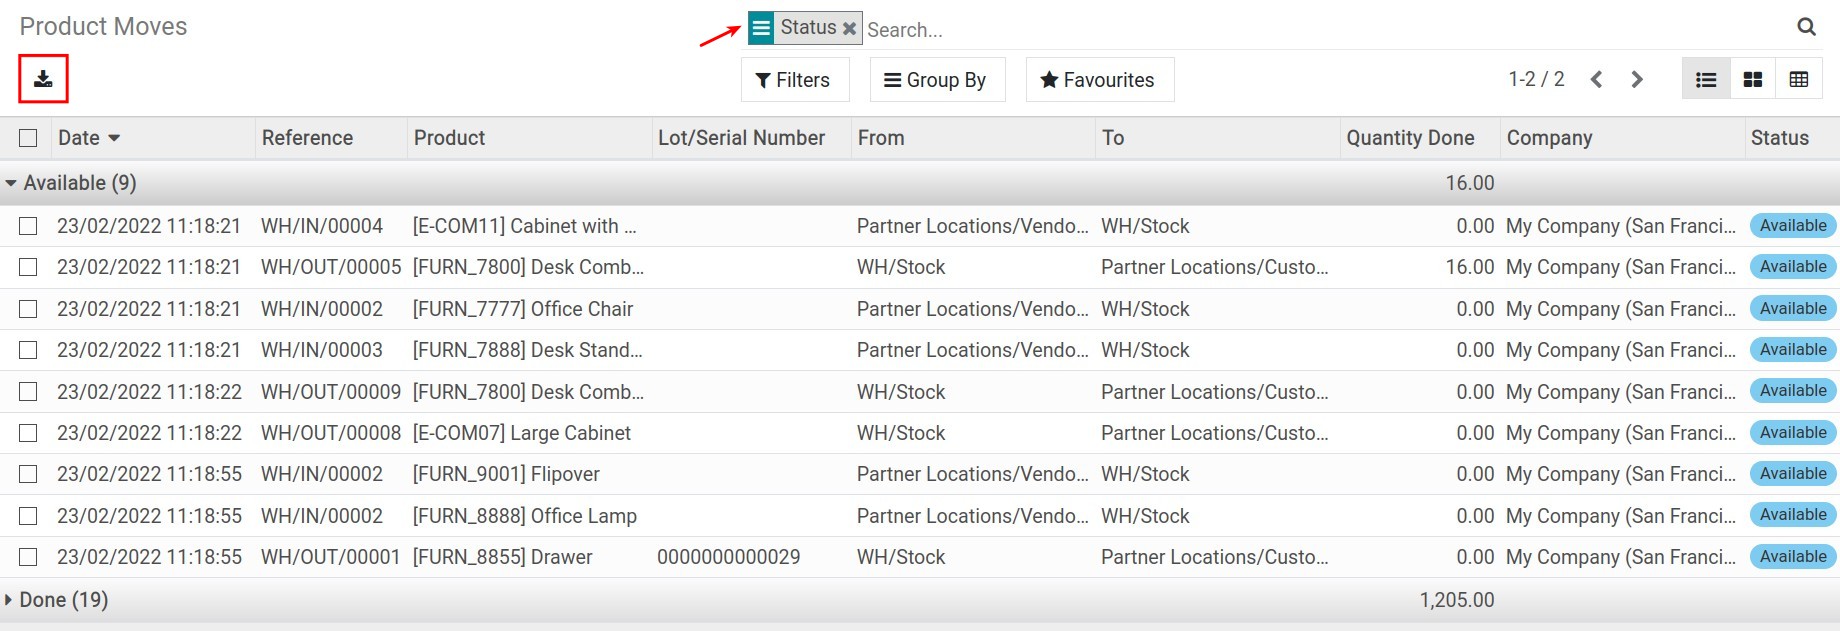
You also can export the report to excel by clicking on the Download xlsx button at the top of it.
Inventory Valuation
This report is only available if you also install the Accounting module. To view the report, go to Inventory ‣ Reports ‣ Inventory Valuation. This report gives you the information on the quantity and value of the corresponding inventory:
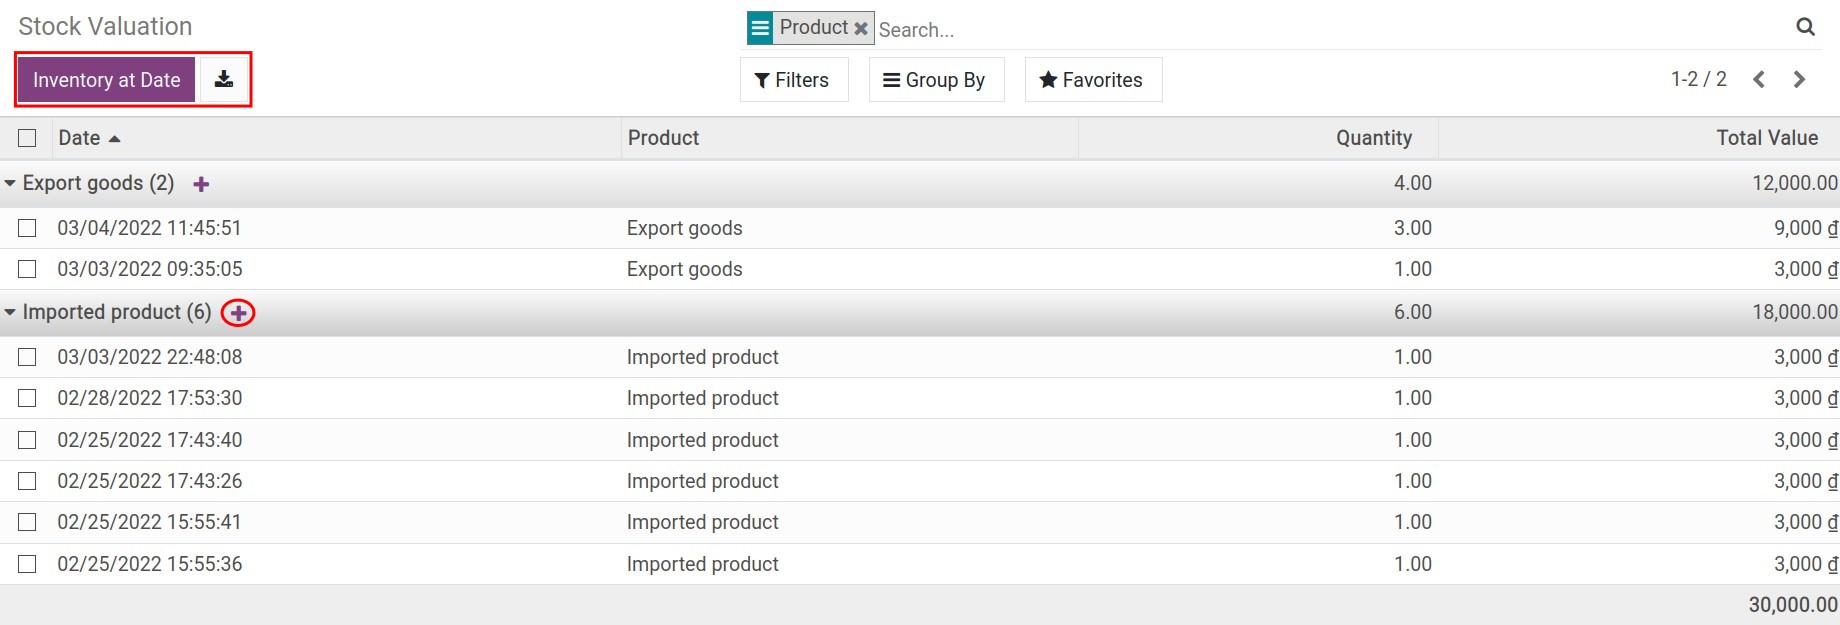
You can:
View the report at any date when clicking the Inventory at Date button and enter the date to view.
Export the report to excel file for the purpose of use.
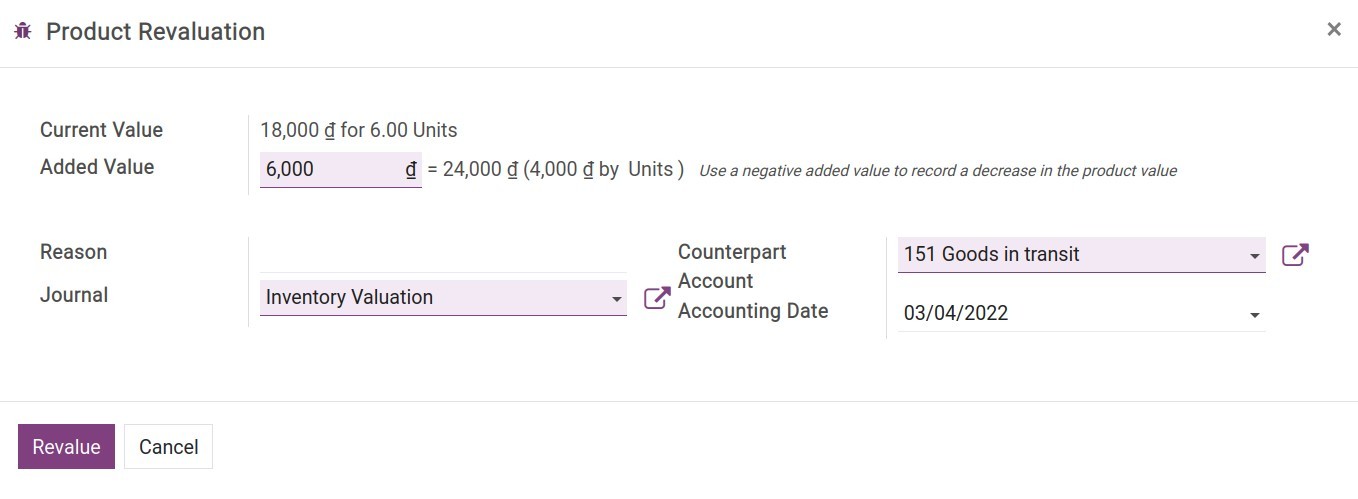
In addition, Viindoo also supports the product revaluation feature when you click on the plus sign (+) of each product that needs to be adjusted:
![Viindoo product revaluation]()
Current Value: The quantity and the corresponding value of the product.
Added Value: Enter the inventory value to be adjusted. A negative number for decreasing the value. At this time, the system will automatically recalculate the value of each corresponding product after adjustment.
Reason: Record the reason to adjust.
Journal: The suitable journal to record this business.
Counterpart Account: Select the counterpart account of the inventory valuation account.
Accounting Date: A date for adjustment.
Stock Moves report
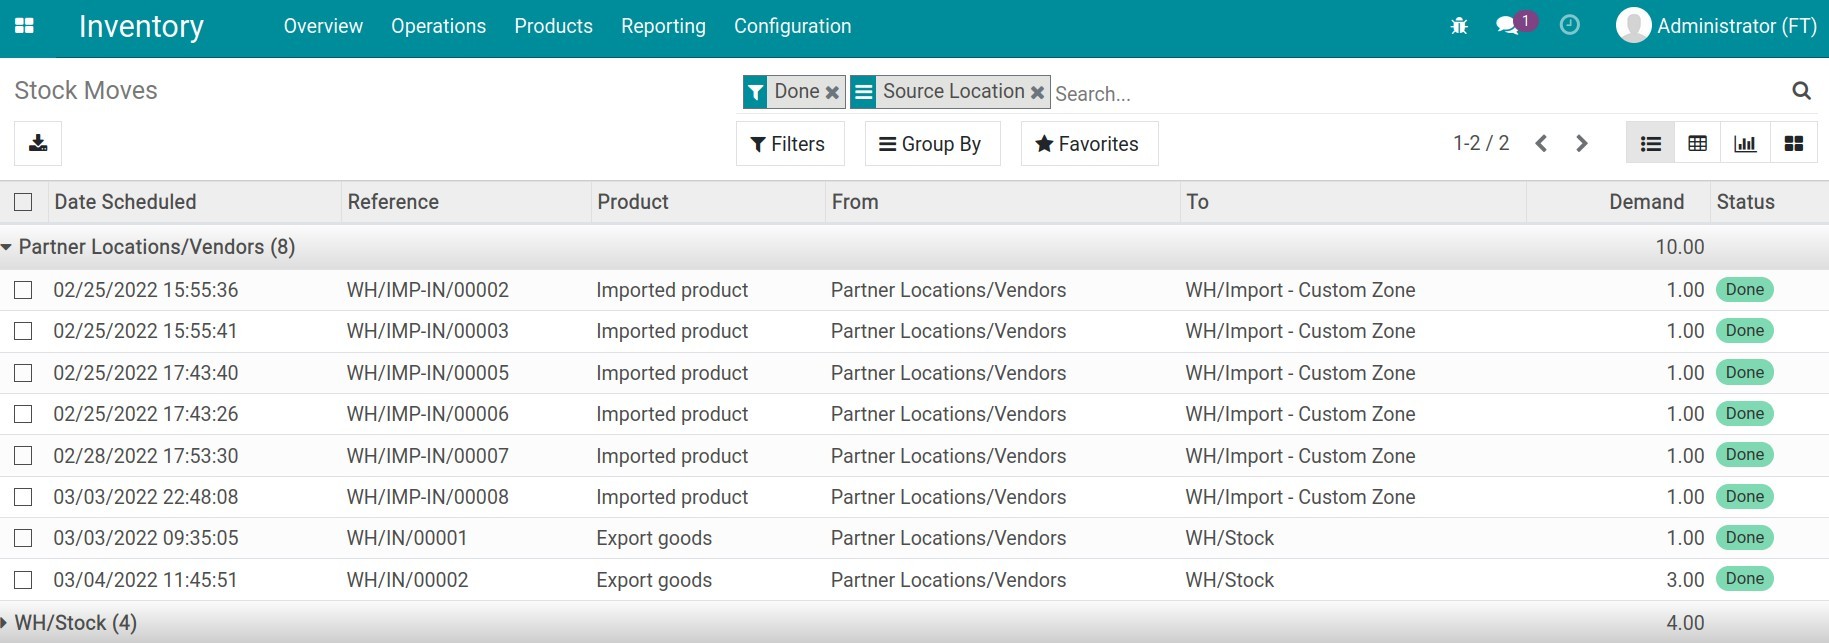
Another inventory stock report is Stock Moves. This report shows you all stock moves of all locations. You can see this report when activate the developer mode and navigate to Inventory ‣ Reporting ‣ Stock Moves:
See also
Related article
Optional module
