Reporting on Project efficiency
Project and sprint progress report
Burndown Chart is a graphical representation of the progress towards completing a goal in the project management under the Scrum framework. The Scrum Burndown Chart focuses on describing the remaining workload of individuals or teams in a sprint or a project, rather than the amount completed. From there, developers can estimate their remaining effort in the sprint or project to achieve the goal.
Usually, project managers view the Scrum Burndown Chart throughout a sprint or a project duration, then evaluate the project’s performance at the end of the project based on this chart.
Sprint Burndown
Scrum Team members (developers) create the Sprint Burndown after the sprint planning meeting and update it daily throughout the project duration to see their actual progress.
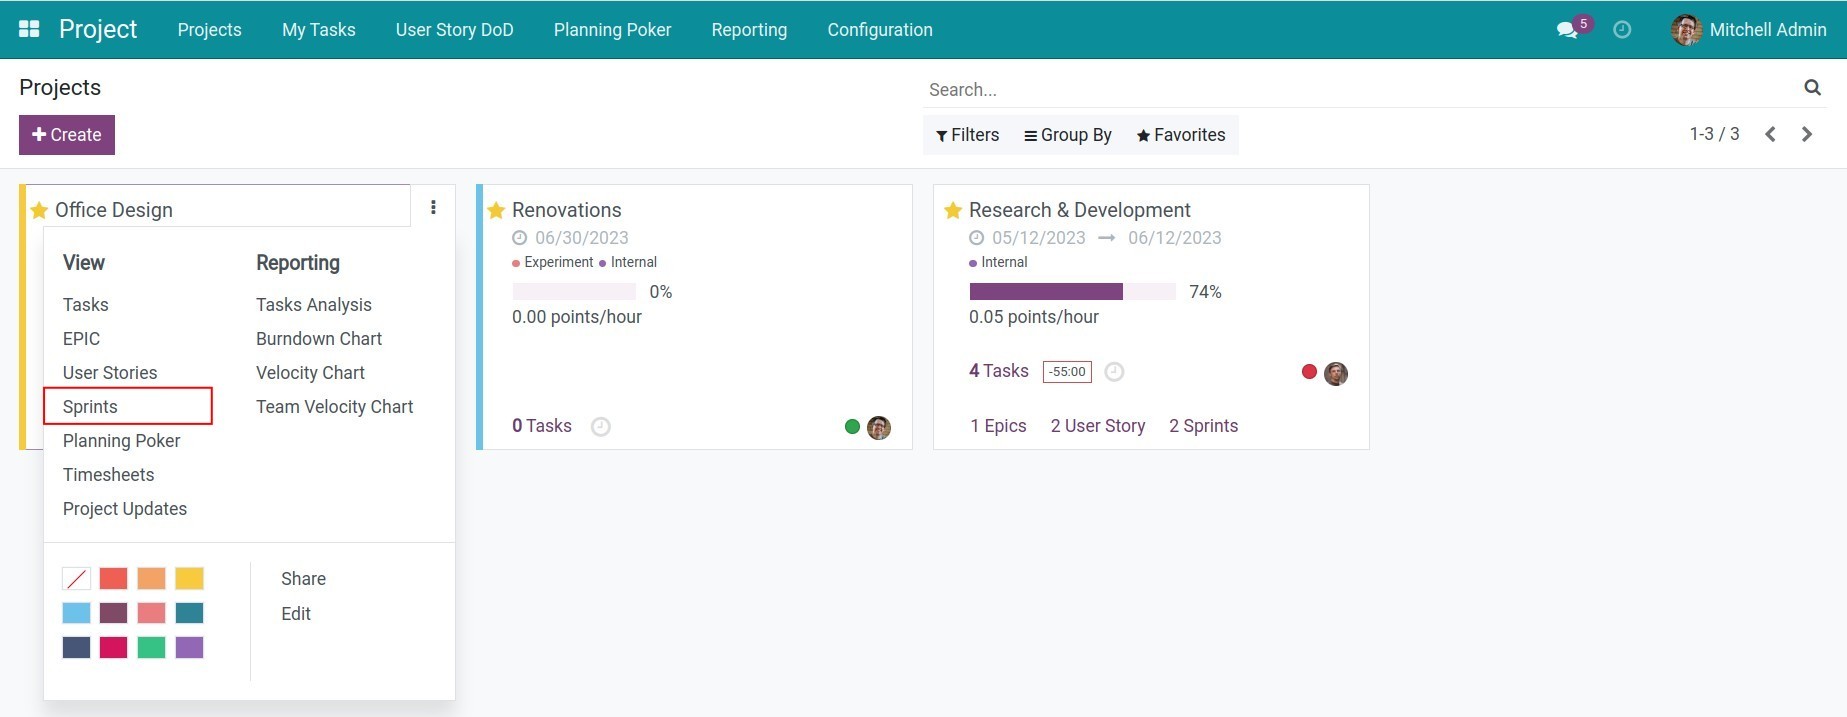
To view the Sprint Burndown, go to Project > Project, click the three-dot icon on the project and select Sprints.
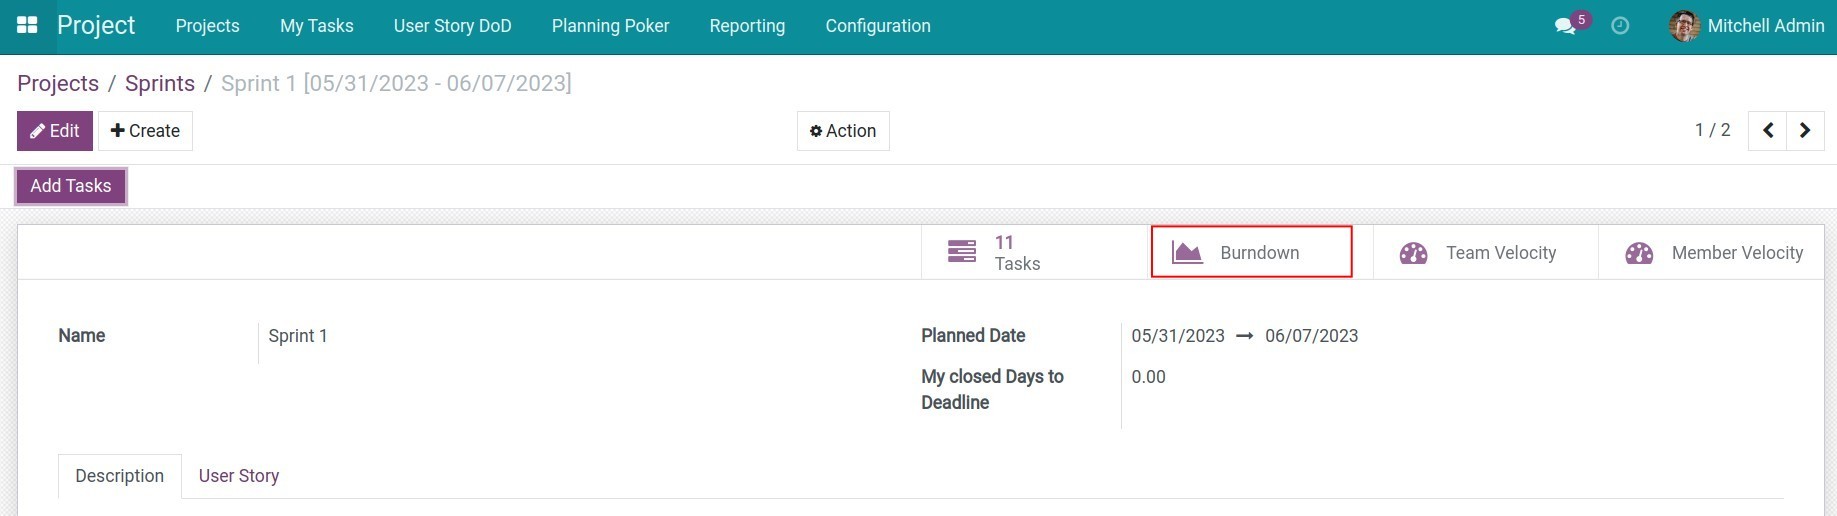
Select the sprint you want to view the progress of work and click the Burndown button, the Sprint Burndown chart will be displayed.
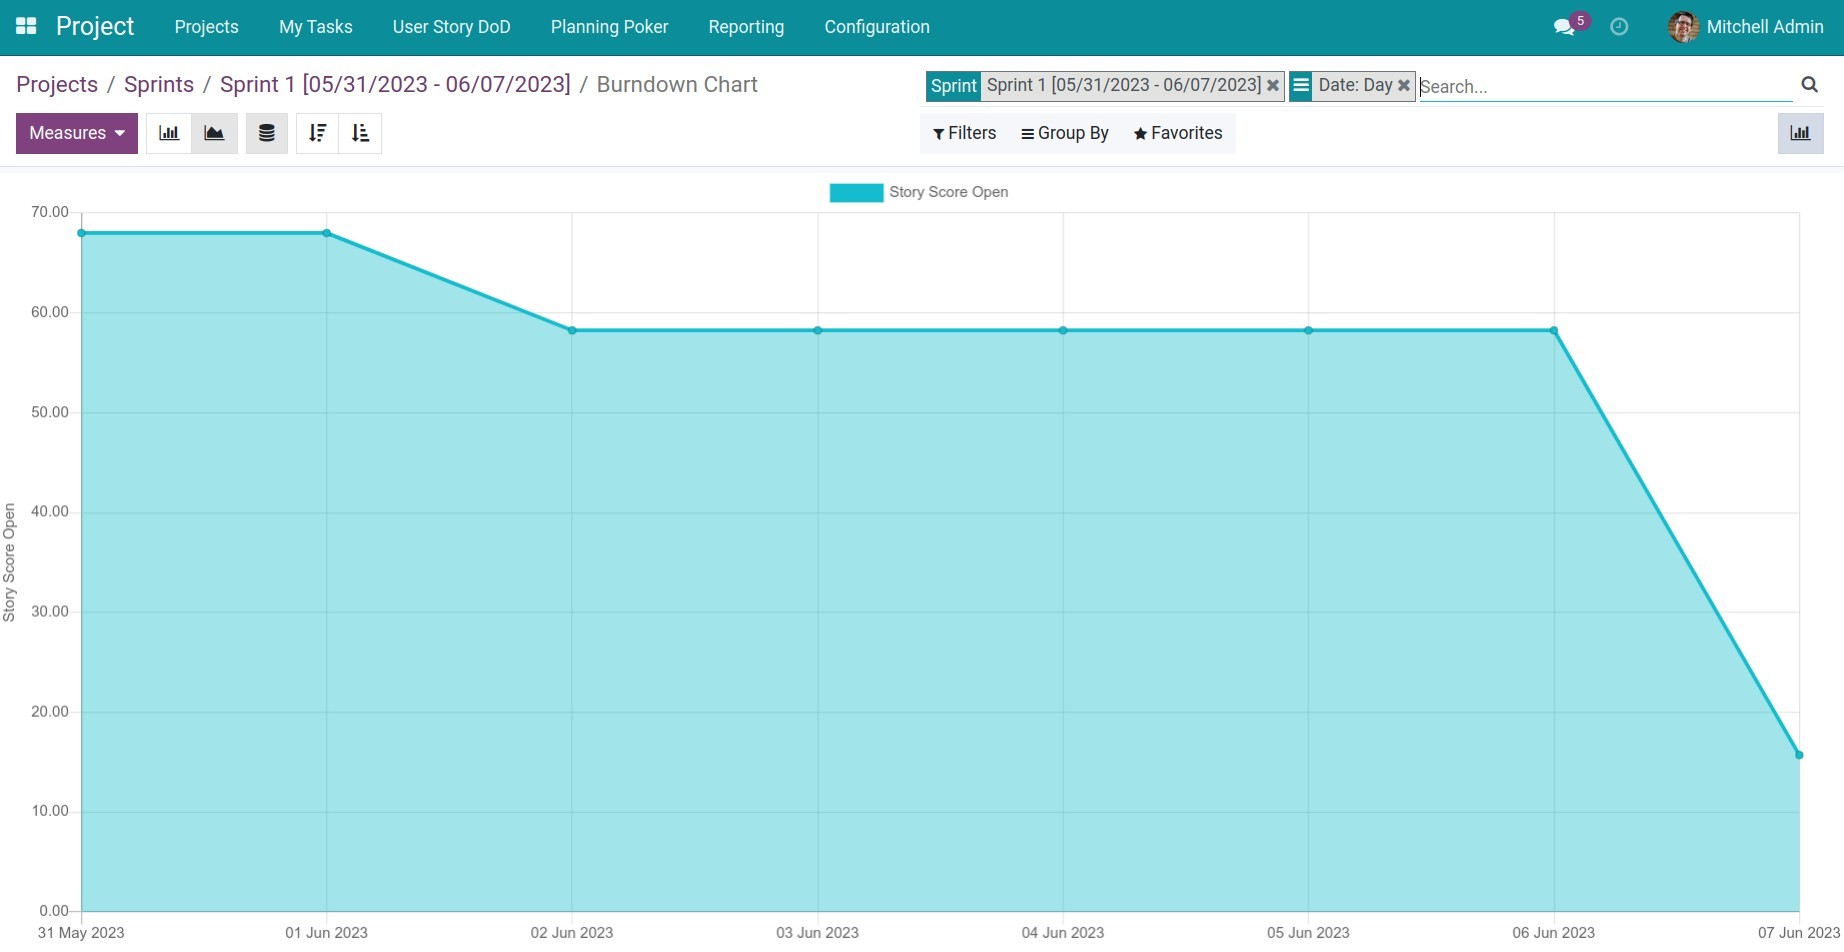
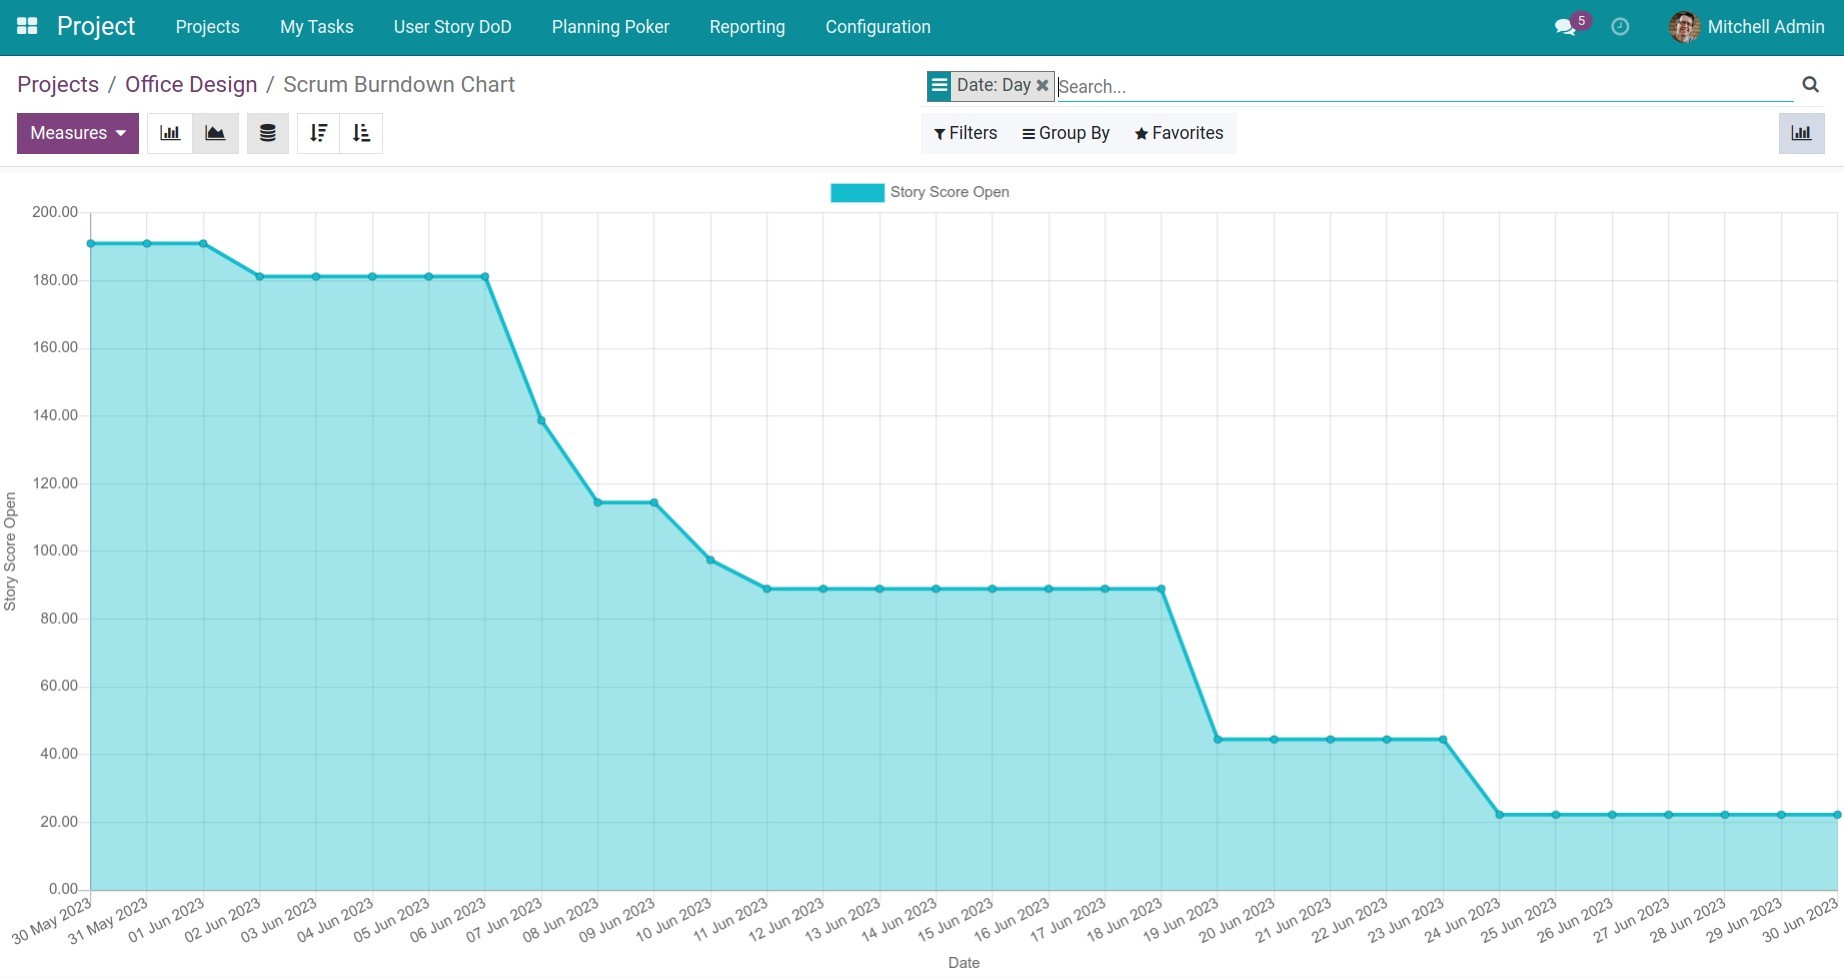
Sprint Burndown chart consists of 2 axes. The horizontal axis represents time, divided into days within the sprint. The vertical axis represents the effort required to complete all tasks (represented by the total Points of all tasks to be completed in this sprint).
In the example above:
The total points to be completed in the sprint are 68 points, and the sprint lasts for 8 days. Therefore, an average of about 8.5 points per day is needed to achieve the sprint goal.
By the end of day 3, the team has completed 9.75 points, which is less than the total average points needed to be completed in 3 days (8.5 x 3 = 25.5 points). The remaining points to be completed are 58.25 points.
Thus, the project manager or coordinator realizes the risk that, with the current velocity, the team will not be able to achieve the goal according to the initial plan. Therefore, they need to decide whether adding resources to support or requiring developers to put in more effort to achieve the sprint goal.
Therefore, from the Sprint Burndown report, the project manager or coordinator can see the actual progress that the team is making in the sprint and can analyze and make timely decisions to adjust as appropriate.
Project Burndown
Go to Project > Project, click the three-dot icon on the project and select Edit.

On the project information interface, press Scrum Burndown button to view the Burndown Chart for the entire project.
You can apply the Sprint Burndown logic to read the Project Burndown chart data.
Reporting project velocity
Velocity is a tool to precisely measure the average speed at which developers complete work. In other words, the Velocity report reflects the performance of an individual or a Scrum Team over a period of time or the entire project.
To view the velocity report of an individual/team in a project, go to Project > Project, click the three-dot icon and select Velocity Chart, then group by Employee/Scrum Team.
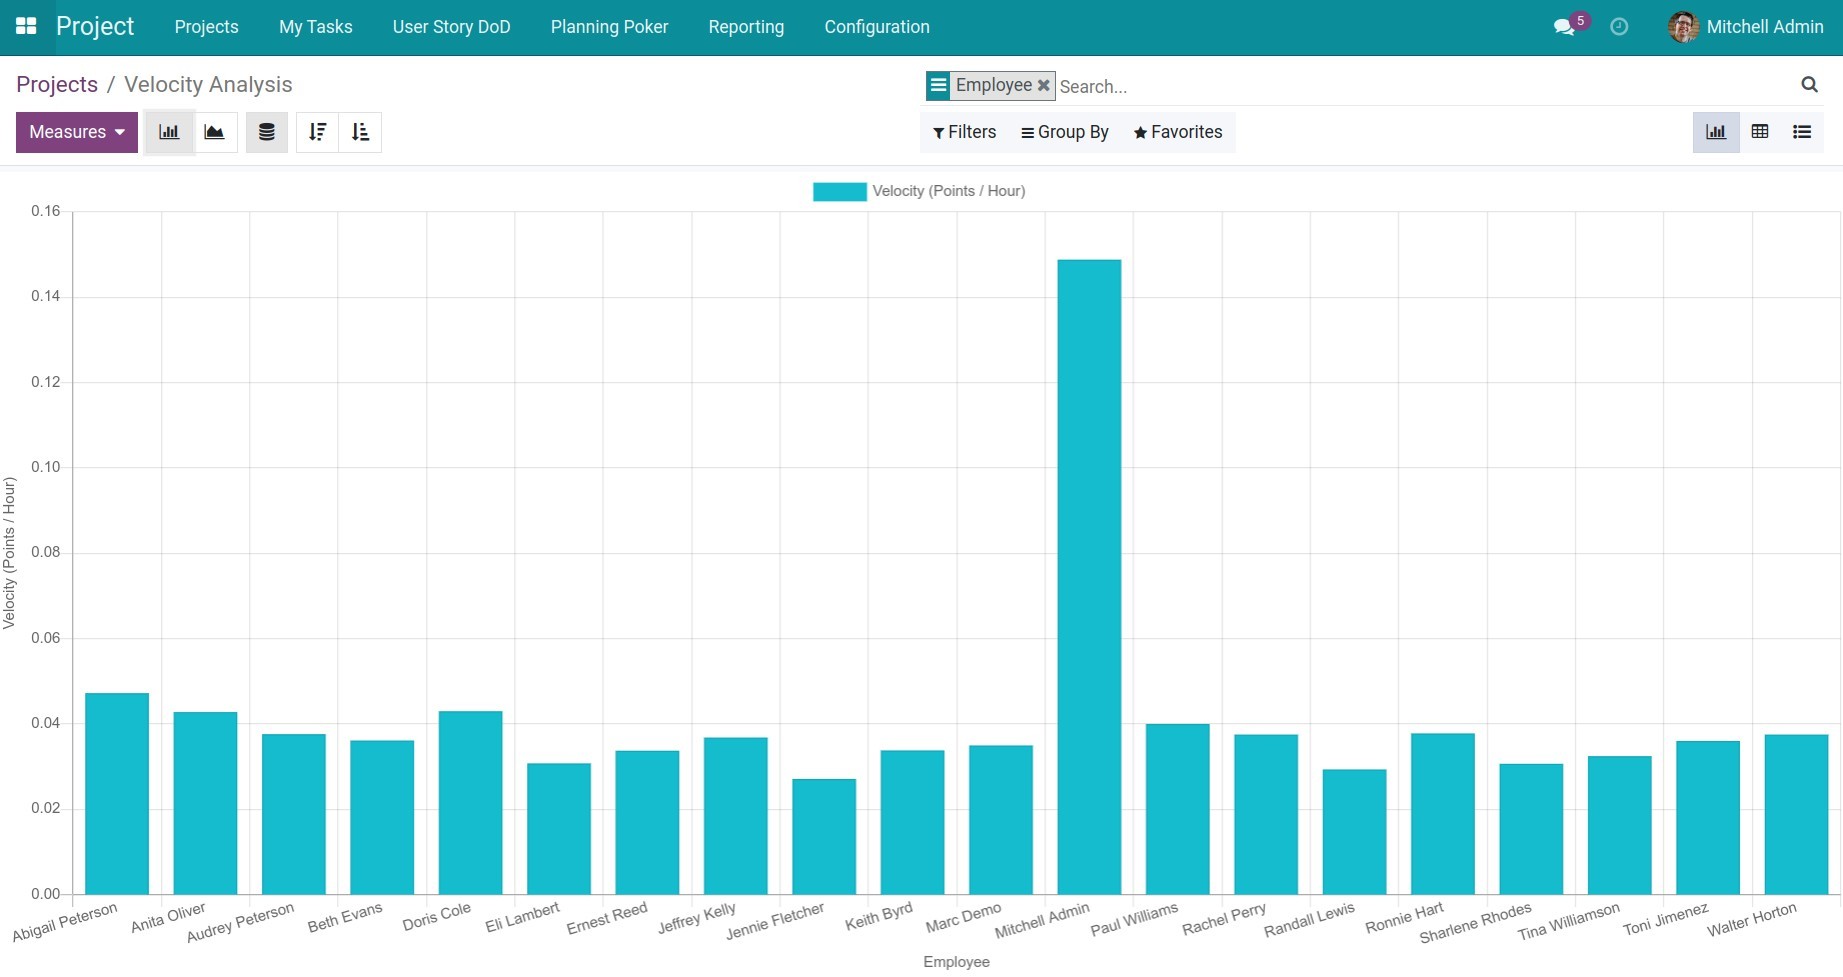
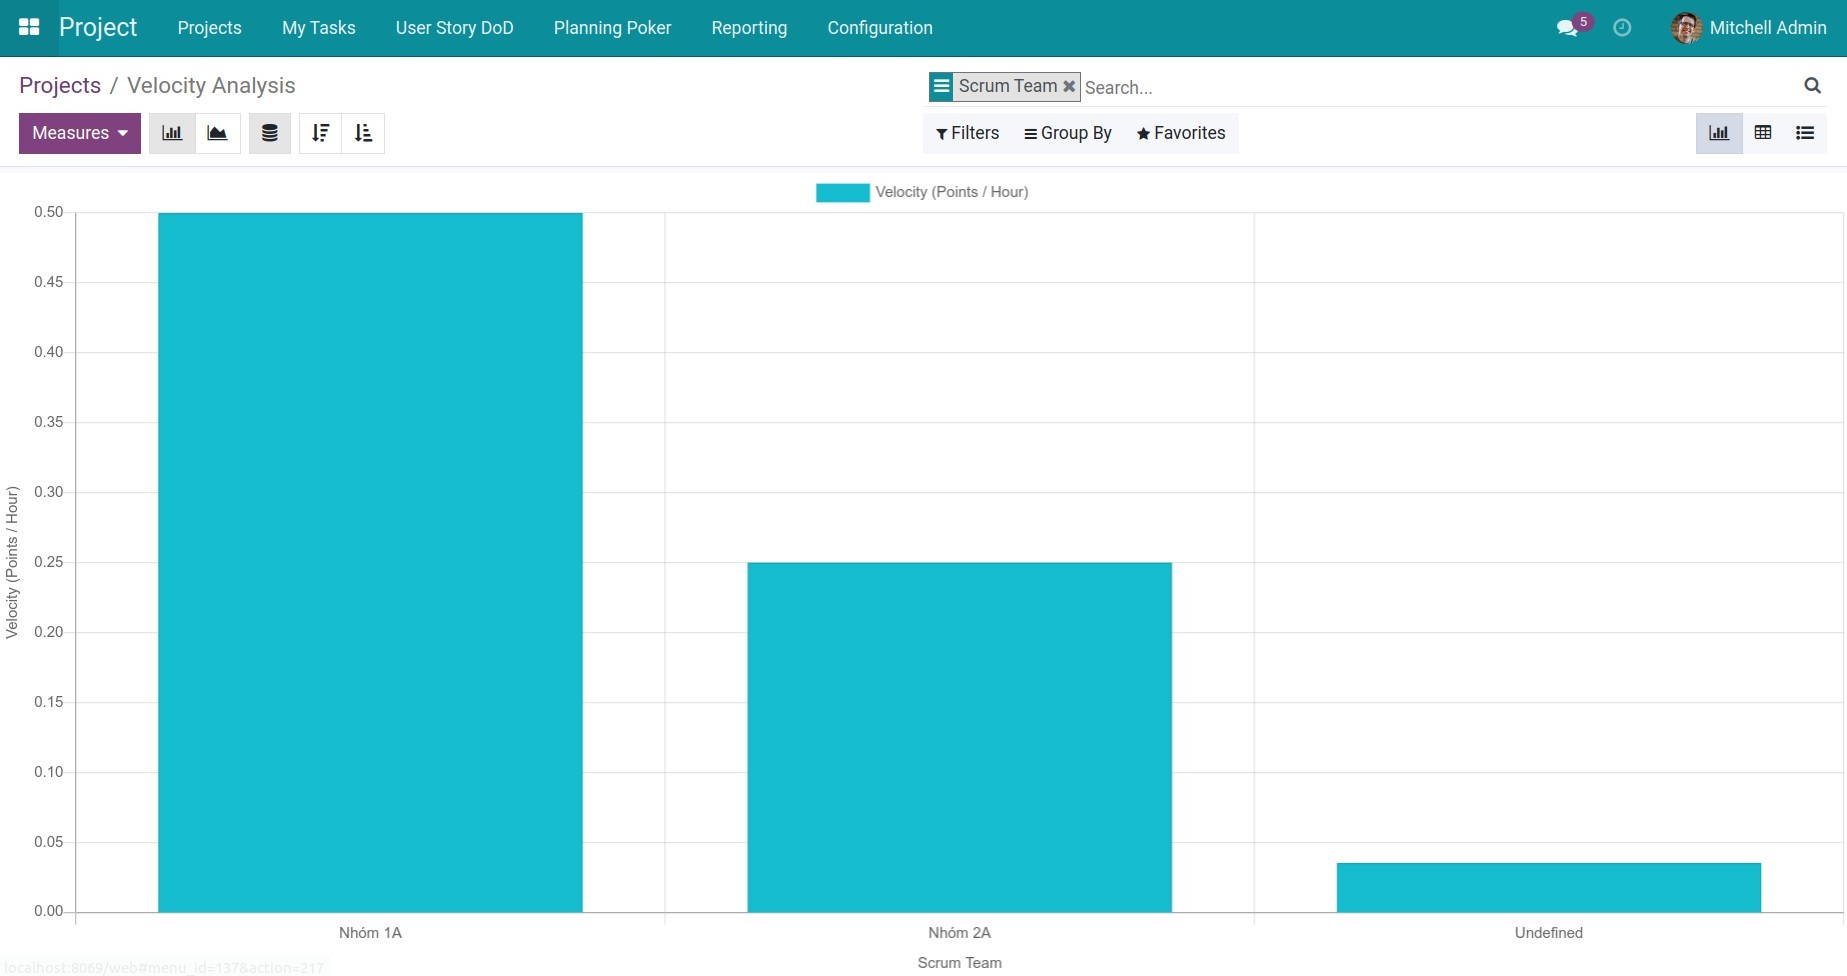
Computing principle: The average execution speed of an individual or team = the total number of points completed by that individual or team / the total time spent by said individual or team.
In the example above:
Employee 1 - Audrey Peterson: Velocity (points/hour) is 0.04, meaning that in 1 hour, this employee completed 0.04 points.
Employee 2 - Anita Oliver: Velocity is 0.05, meaning that in 1 hour, this employee completed 0.05 points. Therefore, when compared, the manager can see that employee 2 is more efficient than employee 1, but she only achieves 40% of the expected efficiency (assuming 1 point represents the amount of work that a person can efficiently perform in an 8-hour workday, then the normal speed of an employee is 1/8 = 0.125 points per hour).
Thus, based on the Velocity Chart, leaders and managers can assess the work efficiency of individuals participating in the project in order to make reasonable rewards/punishments or assign task efficiently.
See also
Related article:
Optional modules: