
How to analyse your purchases with graphs and pivot tables
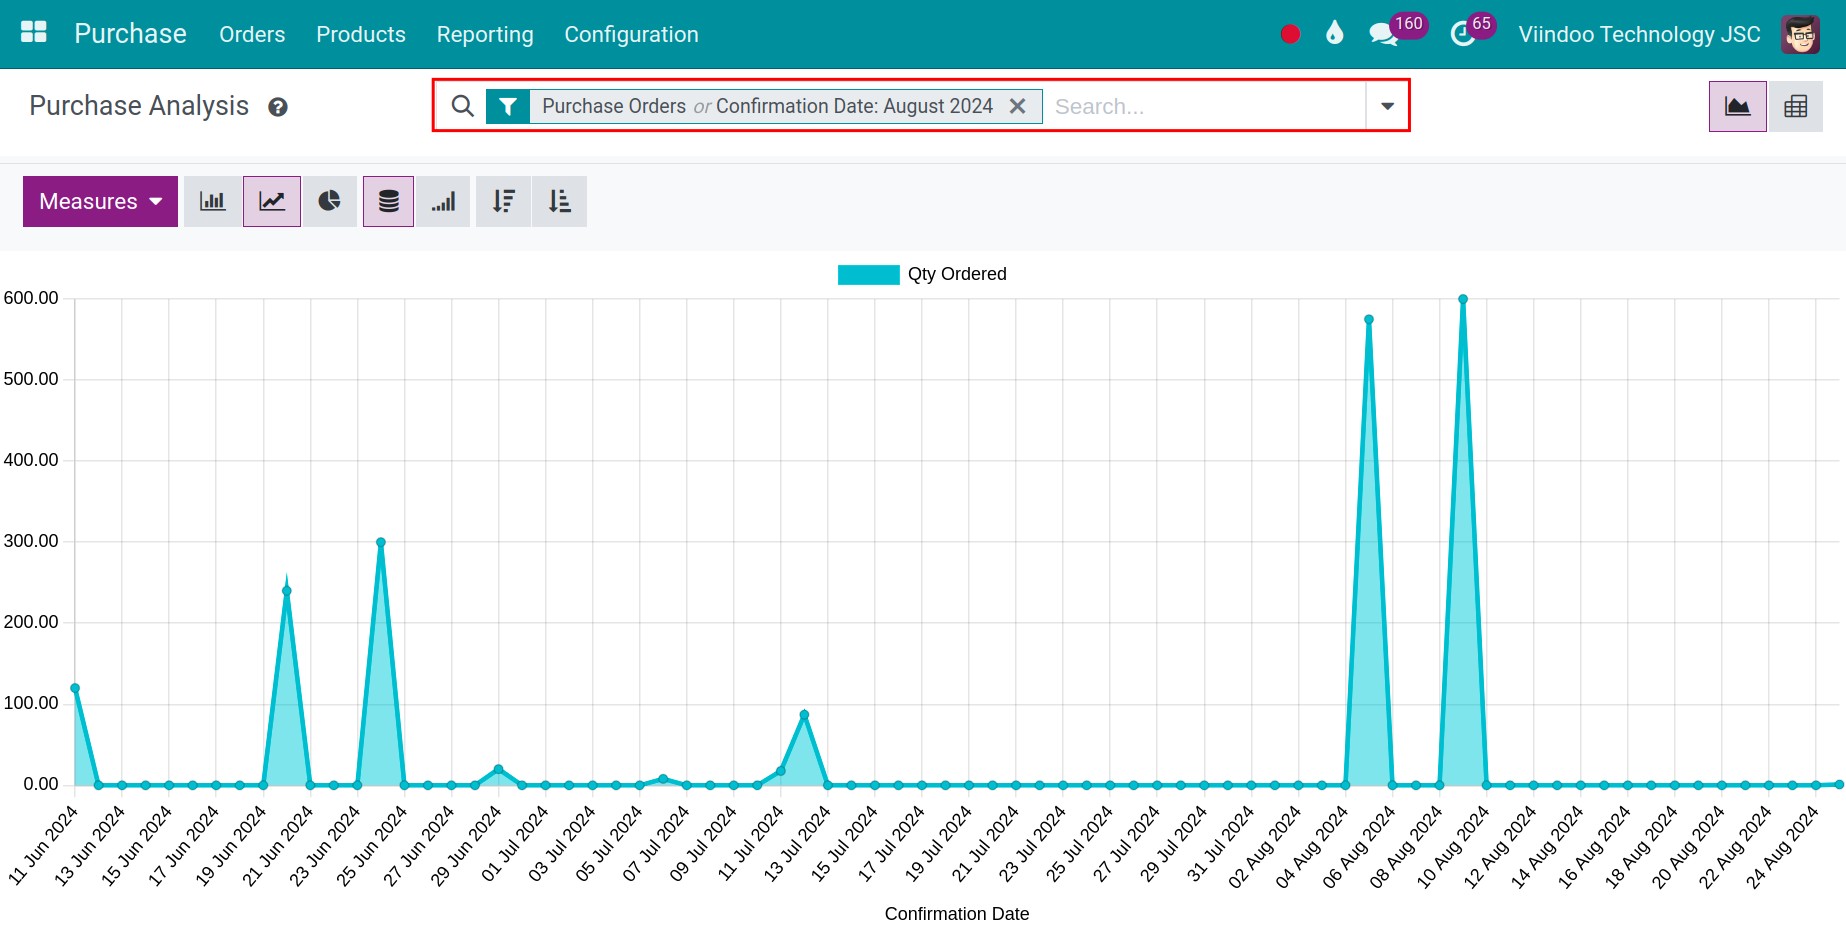
Open Purchase ‣ Reporting ‣ Purchase to see your purchases as a graph or a pivot table, updated in real time from your RFQs and purchase orders. By default it shows the confirmed purchase orders by confirmation date. Choose a measure (amount, quantity ordered, received or billed, days to receive…), group by vendor, product, buyer or period, and download the pivot table to Excel.
Who |
Purchase managers (Purchase access right Administrator). Buyers with the User right open the same analysis from Orders ‣ Purchase Analysis. |
App |
Purchase |
Before you start
Install Purchase and get an access right.
Know how to filter and group records.
How do I read purchases as a graph?
Go to Purchase ‣ Reporting ‣ Purchase. The line graph shows the Untaxed Total per day, filtered on Purchase Orders or Confirmation Date of the current month, that is every confirmed order. Remove or change the filter in the search bar to see another period, or add Requests for Quotation.
![Purchase Analysis line graph with the default filter Purchase Orders and Confirmation Date]()
Click Measures and choose what to show on the vertical axis (one measure at a time in the graph), see the table below.
![Measures menu of the purchase graph]()
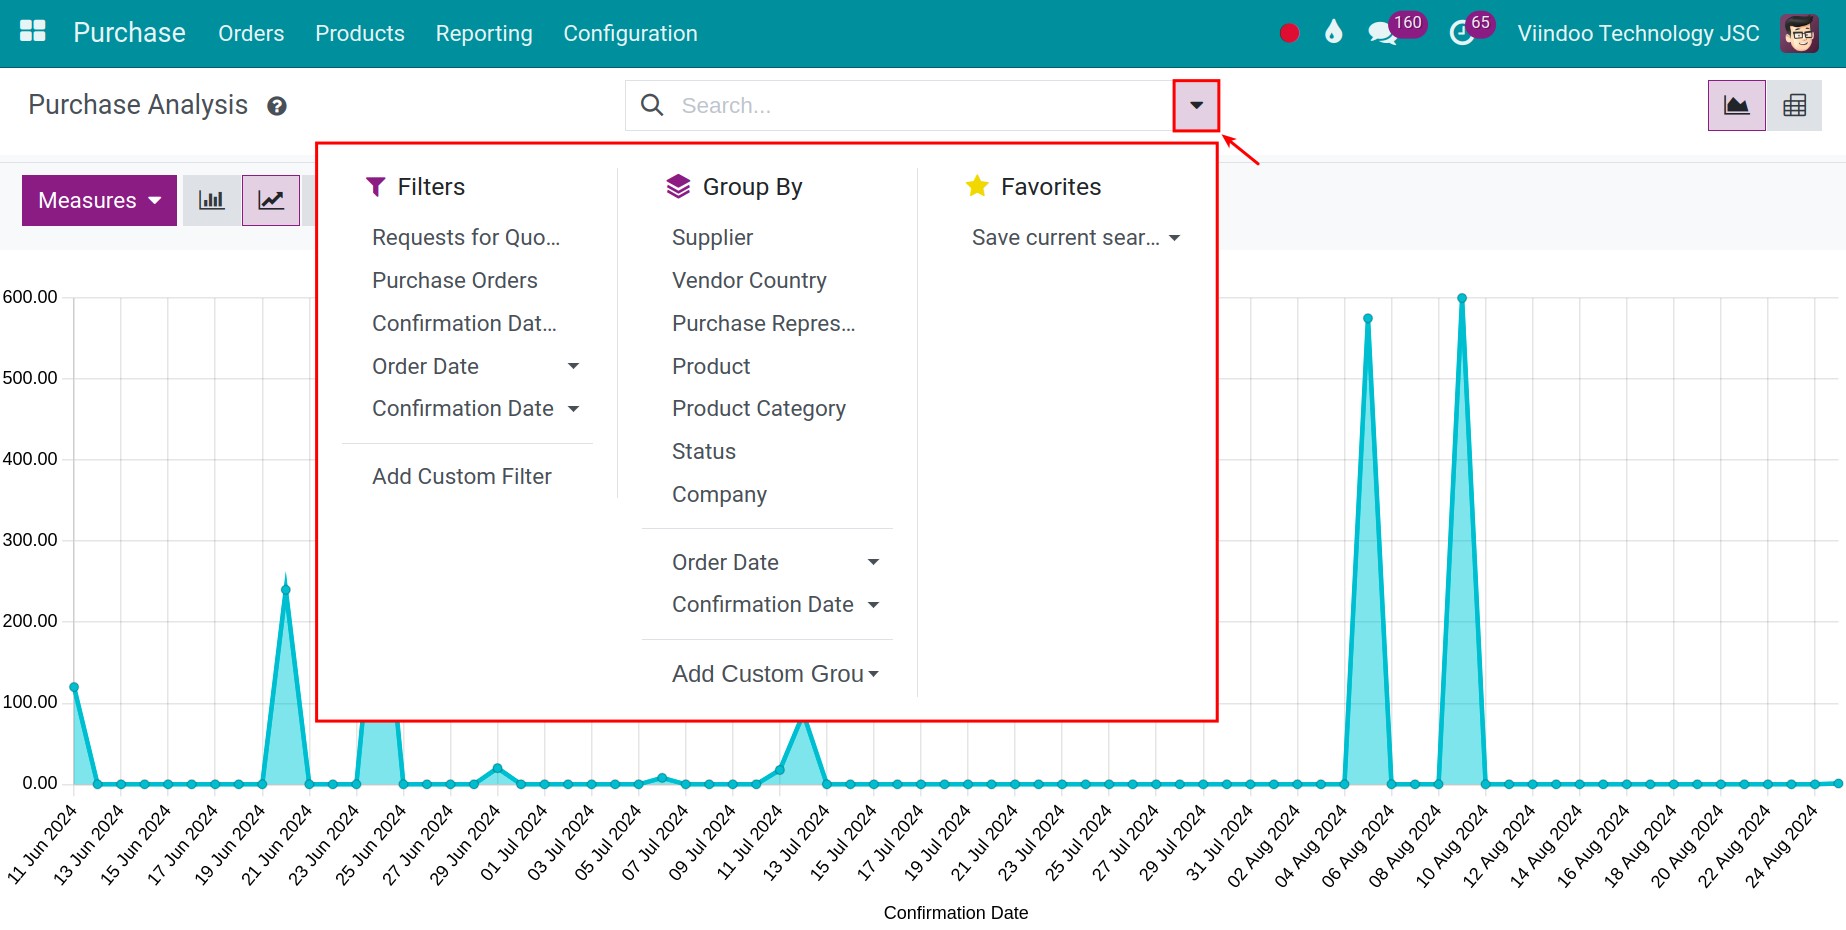
To change the horizontal axis, open the search panel (arrow at the right of the search bar) and choose a Group By: Vendor, Vendor Country, Buyer, Product, Product Category, Status, Company (when you work in several companies), Order Date or Confirmation Date, or Custom Group.
![Group By options of the purchase analysis]()
Switch between Bar Chart, Line Chart and Pie Chart with the buttons next to Measures. Stacked (bar and line charts) and Cumulative (line chart) change how values add up, and Descending / Ascending sort the bars.
![Purchase analysis as a bar chart with the chart type buttons]()


Which measures can I use?
Measure |
Meaning |
|---|---|
Untaxed Total, Total |
Amount of the order lines without and with taxes. |
Qty Ordered, Qty Received, Qty Billed, Qty to be Billed |
Quantities ordered, received, billed by the vendor and still to be billed. |
Average Cost |
Average unit price paid. |
Days to Confirm, Days to Receive |
Average days between the order date and the confirmation of the order, and between the order date and the expected arrival of each line. |
Effective Days To Arrival |
Average days between the order date and the first receipt of the goods; the expected arrival of the line while nothing is received yet. |
# of Lines, Count |
Number of order lines. |
Gross Weight, Volume |
Weight and volume of the products ordered. |
How do I analyse purchases in a pivot table?
Click the Pivot view icon at the top right. By default, rows are Product Category then Order, and columns are Count, Untaxed Total and Total.
![Purchase analysis in pivot view by product category and order]()
Click Measures to add or remove columns. Unlike the graph, the pivot shows several measures at once.
![Measures menu of the purchase pivot table]()
Click a row or column header (for example Total) and choose a criterion to split it, for example Vendor or Product. Click an open header again to fold it.
![Choosing a criterion to expand the Total header of the pivot table]()
Click Flip axis to swap rows and columns.
![Flip axis button and the pivot table with rows and columns swapped]()
Click Download xlsx to export the table as shown to Excel.
![Download xlsx button of the purchase pivot table]()
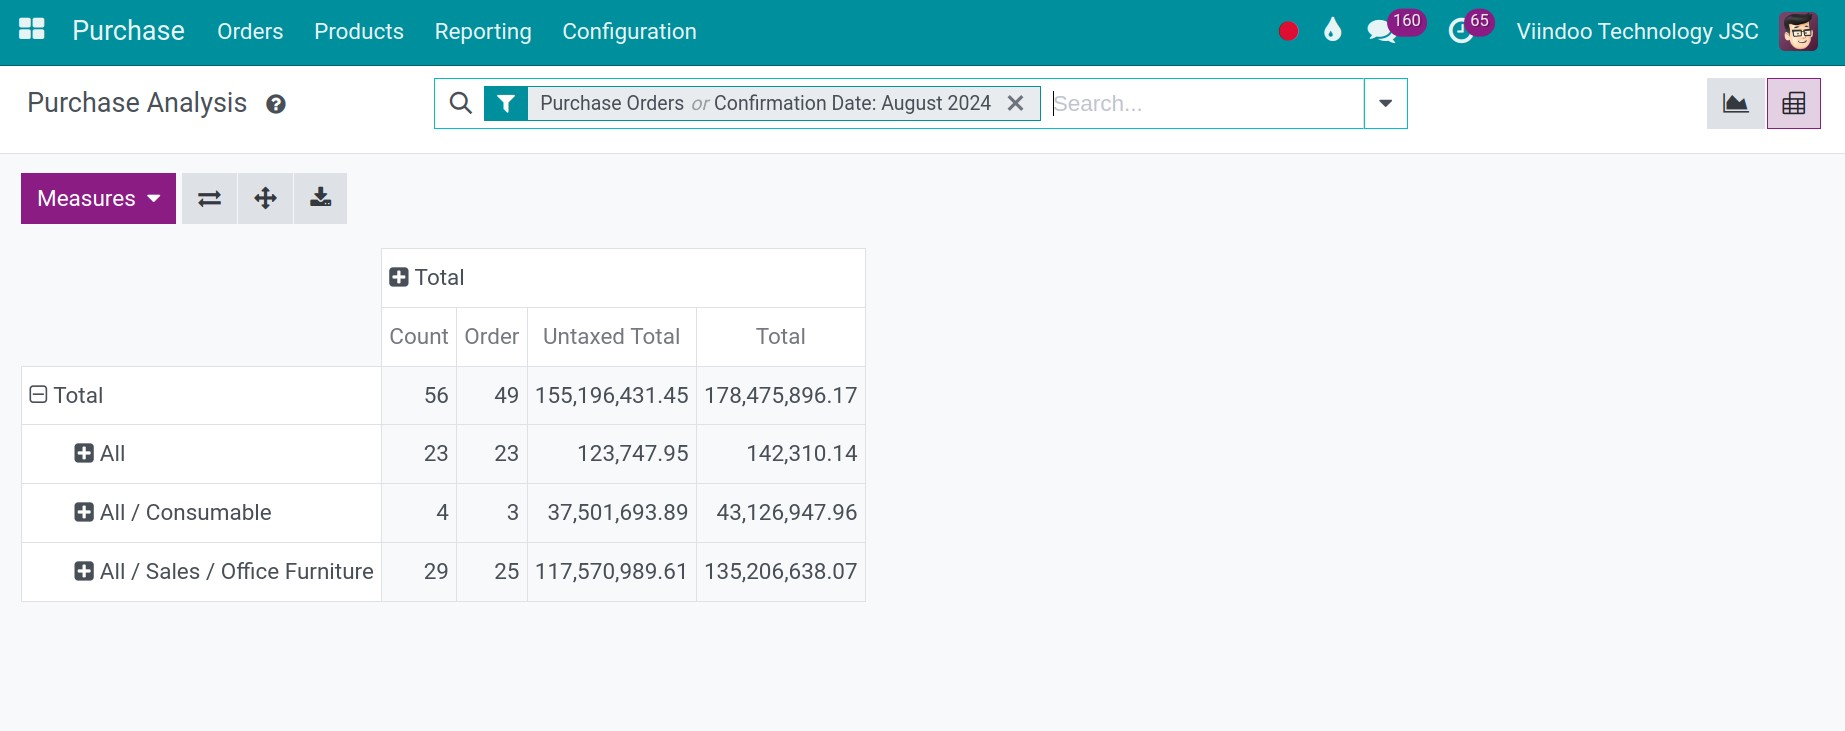


You should now see the purchase figures grouped the way you chose. Click a cell to open the order lines behind it. To keep the layout, save the search as a favourite, see How to search, filter, group and save searches.
Common errors
Message |
What to do |
|---|---|
The graph is empty. |
No order is confirmed yet. Confirm an RFQ, or add the filter Requests for Quotation to include the RFQs. |
RFQs are missing from the analysis. |
The default filter Purchase Orders only keeps confirmed orders. Add the filter Requests for Quotation. |
I do not see the Reporting menu. |
It needs the Purchase access right Administrator. Use Orders ‣ Purchase Analysis. |
Next steps
Views and reports: which view should I use?: more about graph and pivot views.
How to control when vendor bills are created: follow quantities still to be billed.