
How to analyze accounting data with the Pivot and Graph reports
Viindoo Accounting gives you two analysis reports that you can read as a pivot table or as a graph: Journal Items Analysis (Accounting > Reporting > Audit Reports) for the financial accounts and Analytic Report (Accounting > Reporting > Management) for the management accounting (analytic) accounts. Choose the measures, group and filter the data, and save the view you use often.
Who does this: an accountant (the Auditor - Readonly access right of Accounting is enough to read both reports). Application: Accounting.
Before you start
This tutorial requires the installation of the following applications/modules:
Viindoo Accounting & Finance
Accounting & Financial Reports for Journal Items Analysis
Both reports follow the general behaviours of the pivot and graph views of Viindoo, described in Views and reports: which view should I use?.
How do I open the Journal Items Analysis?
The report is built from the journal items generated in the accounting system. Navigate to Accounting > Reporting > Audit Reports > Journal Items Analysis.

By default it shows the posted entries as a pivot table, with the journals in rows and the months in columns.
Depending on your needs, use the Measures menu. The measures you will use most are Debit, Credit, Balance, Amount in Currency, Quantity and Count; the menu offers more (for example Amount Paid, Amount Unpaid, Residual Amount).
![Measures of the journal items analysis in Viindoo Accounting]()
Use the filter and grouping tools to read the report by other criteria, for example by account or partner.
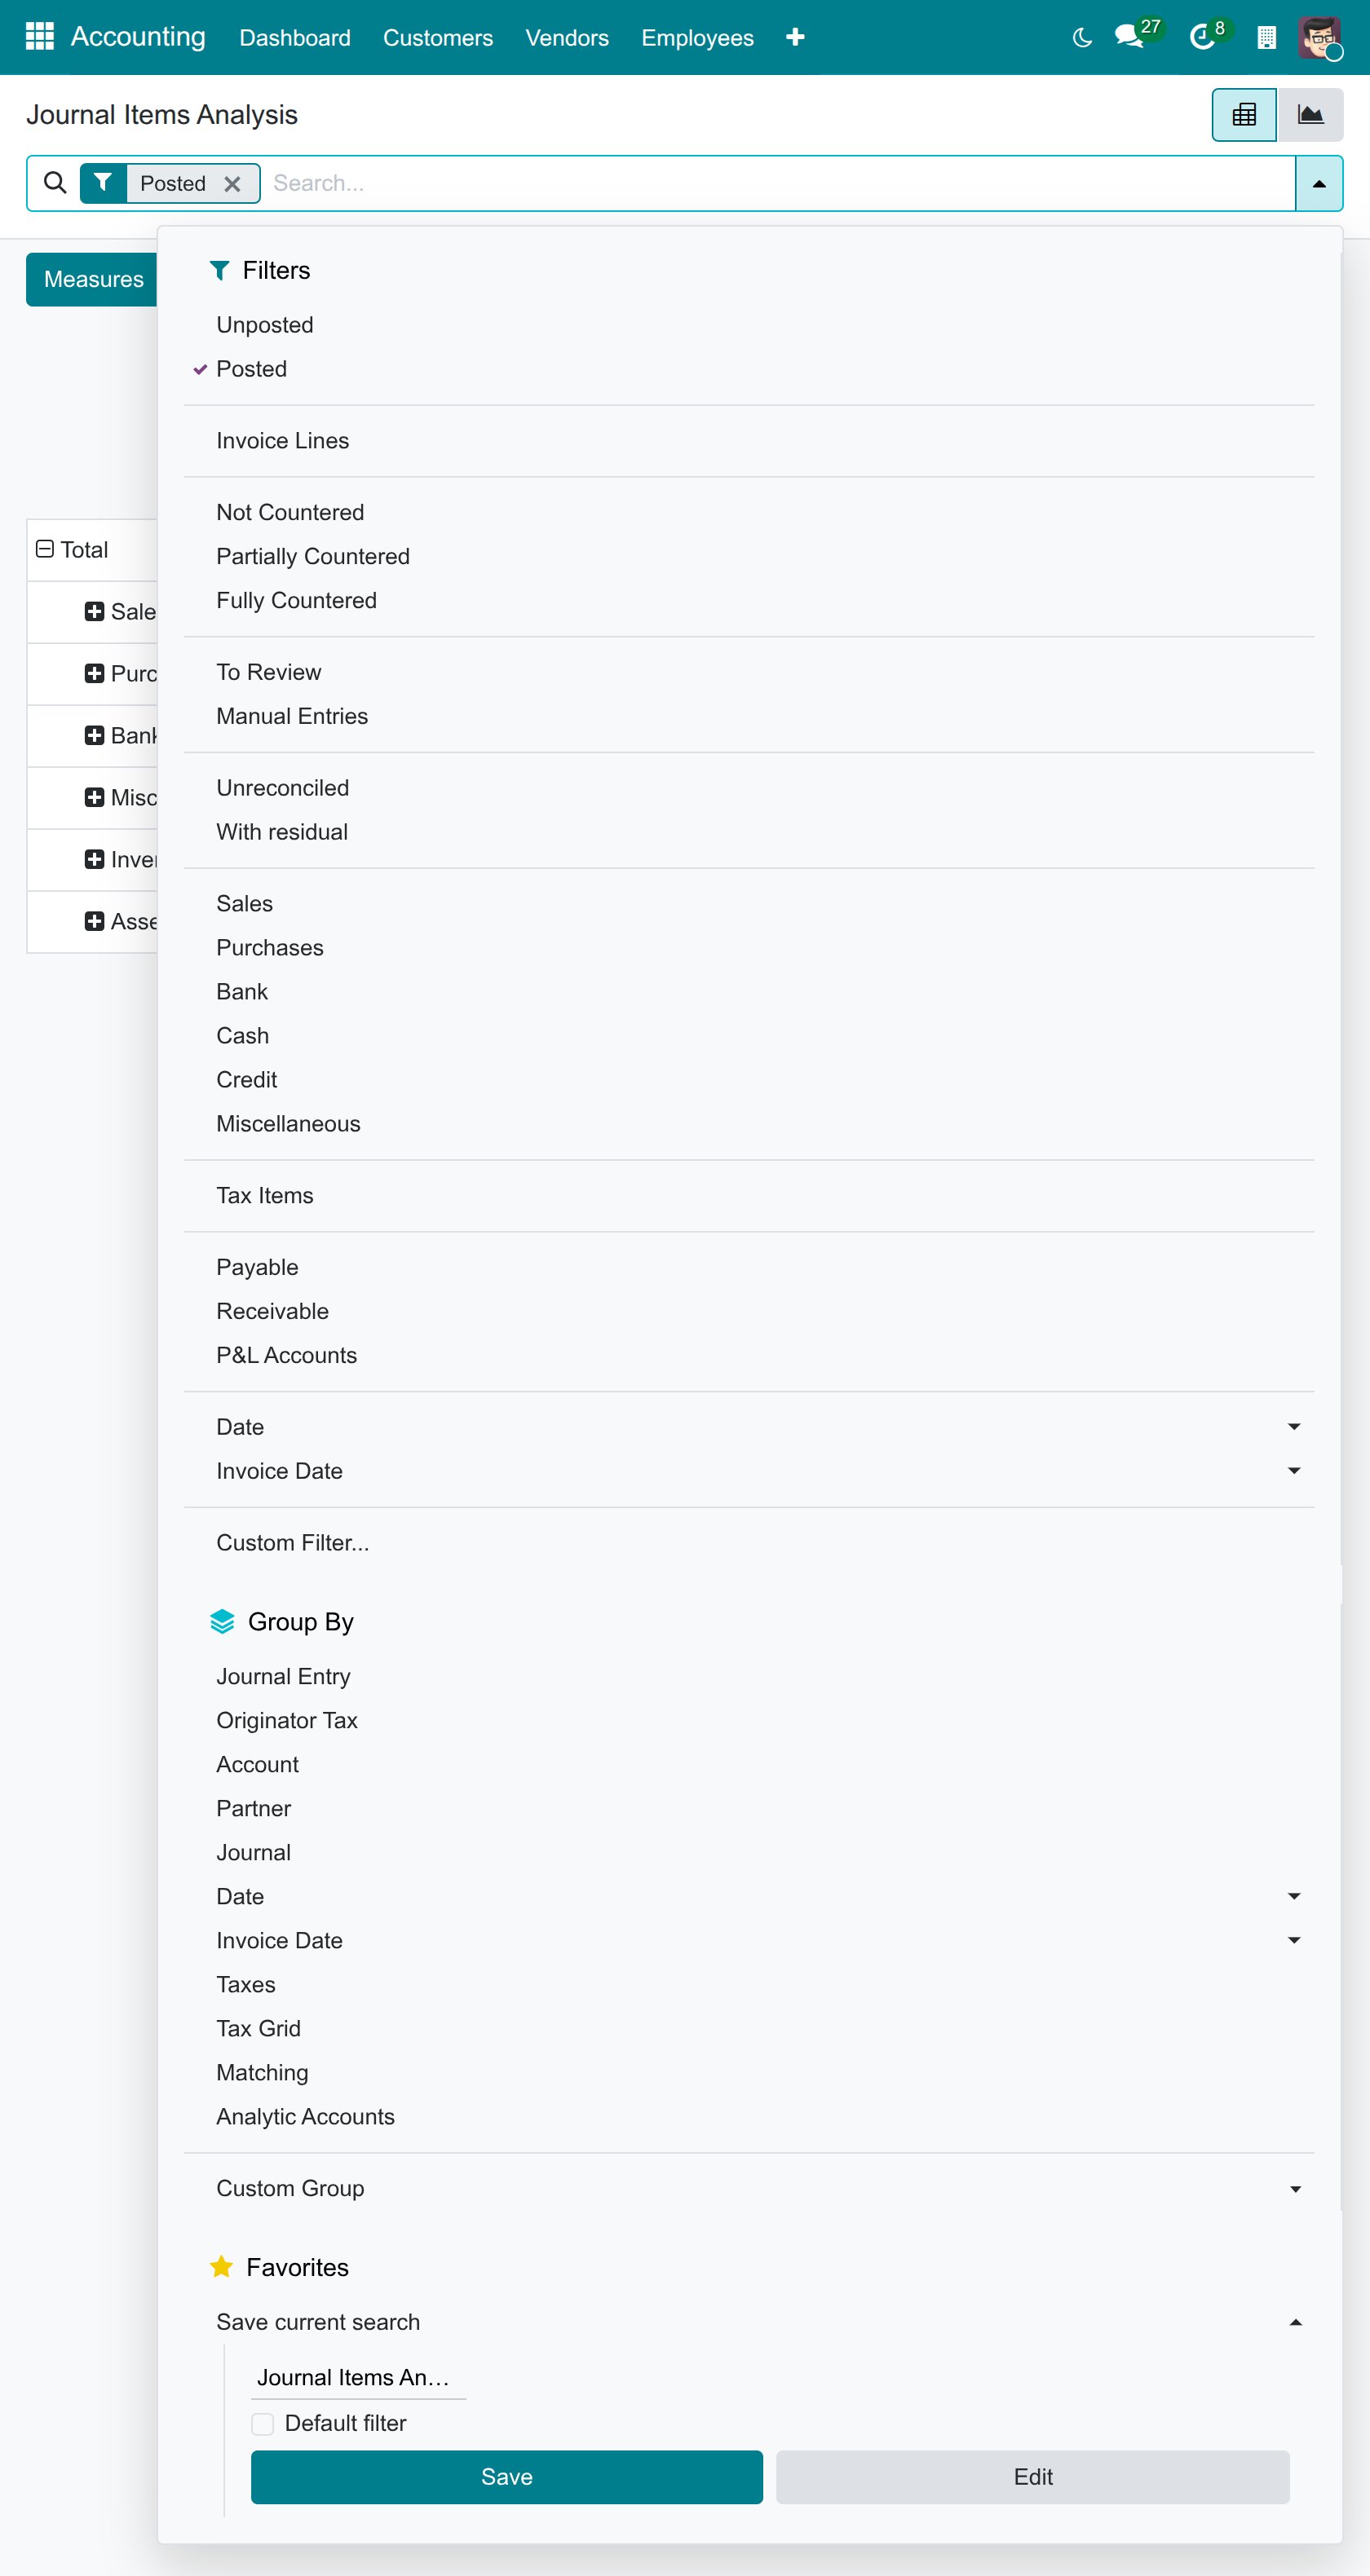
Save the report as a favorite to reuse it later or to share it with other users:
![Save the current search as a favorite in Viindoo Accounting]()
Two views are available:
The Pivot view is dynamic and can be downloaded to an Excel file. Click a row or column heading to expand or collapse it:
![Pivot journal items analysis report in Viindoo Accounting]()
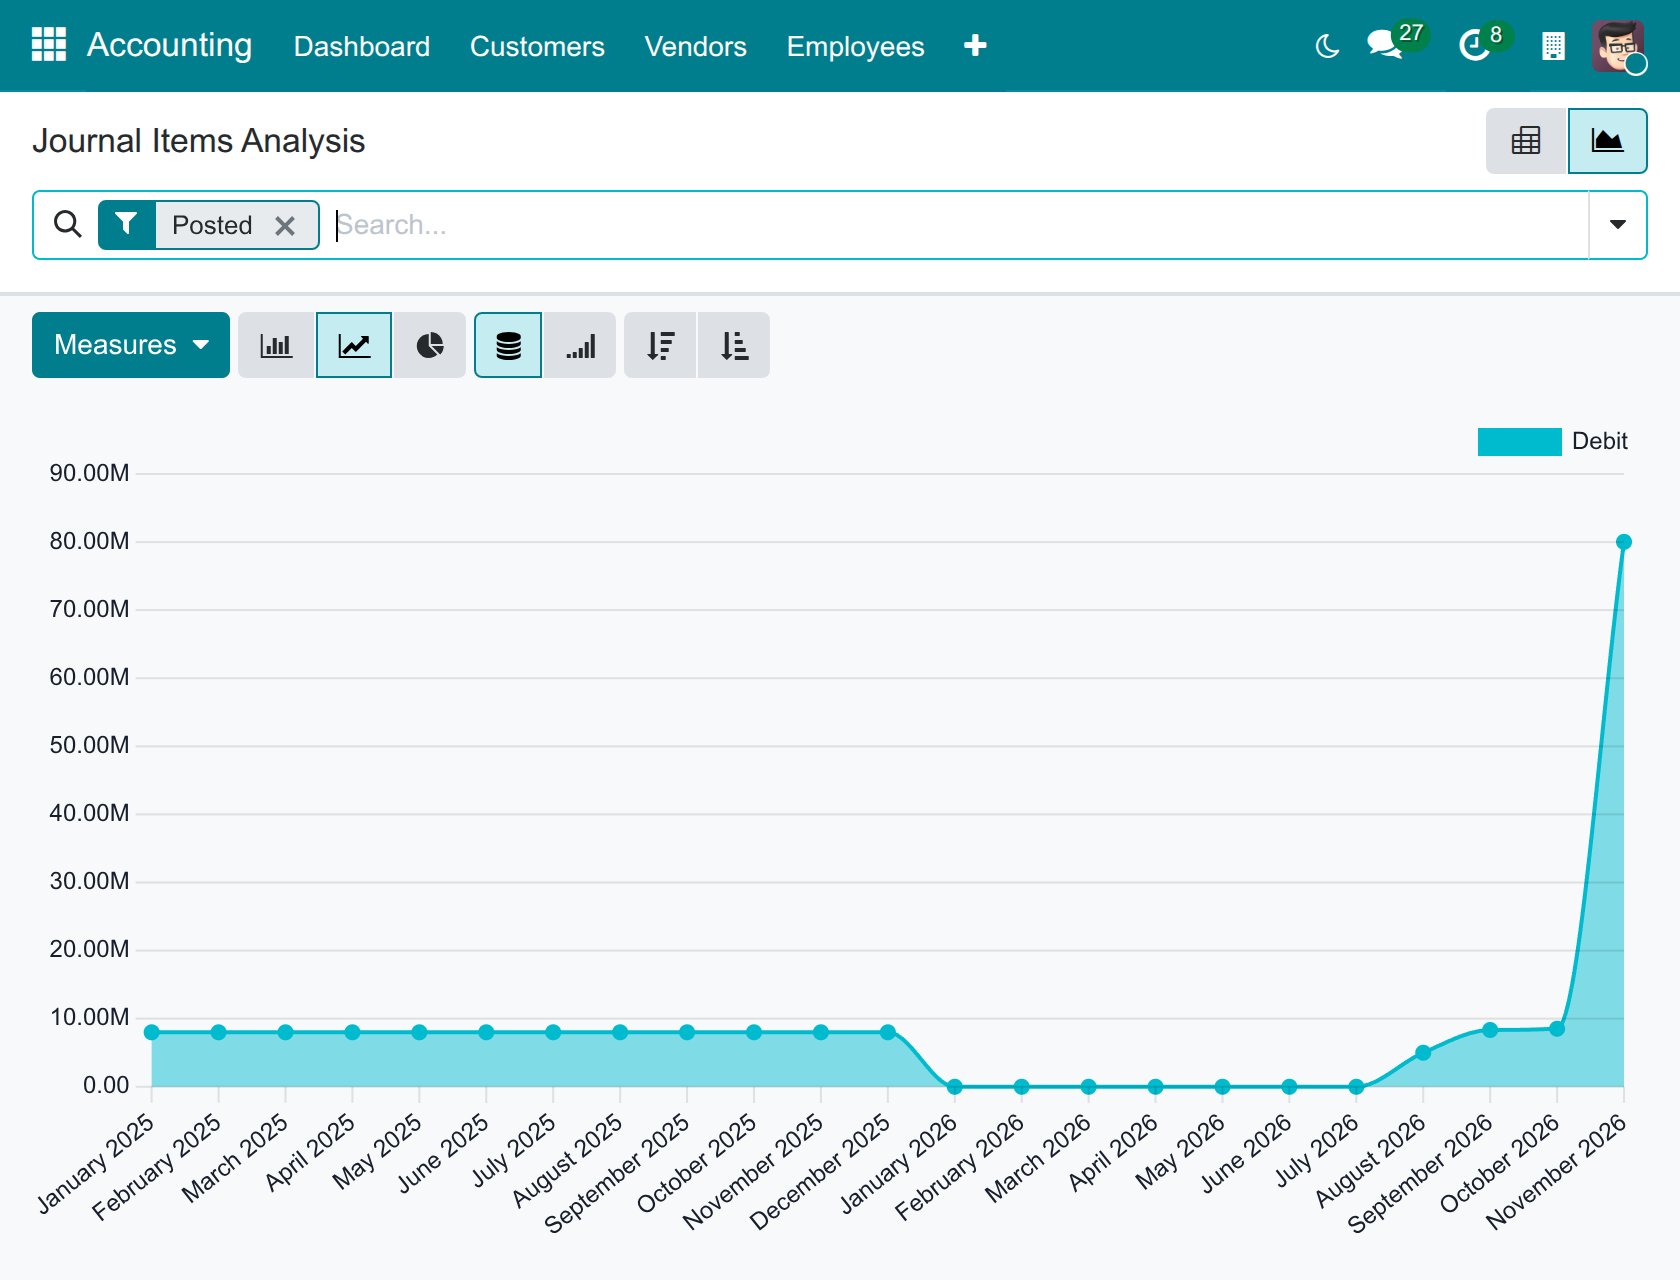
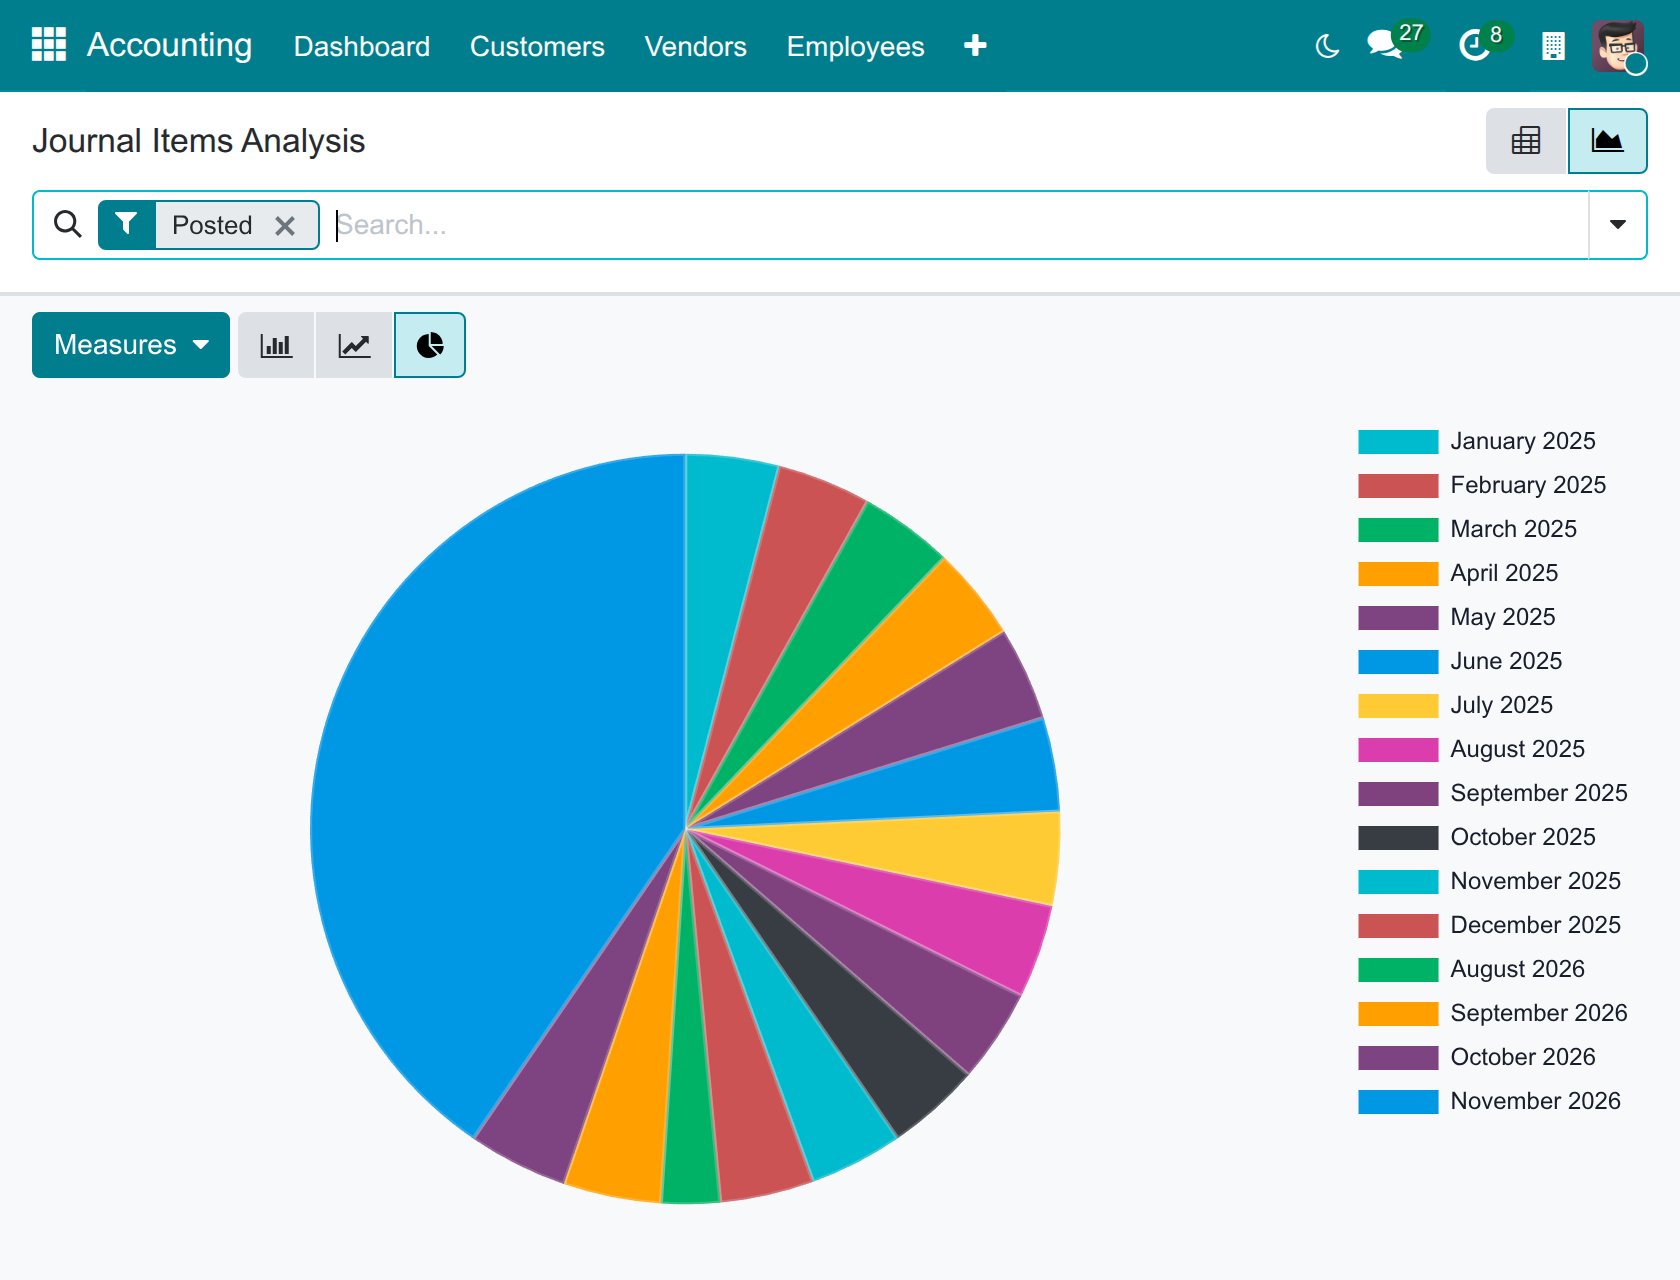
The Graph view can be read as a bar, line or pie chart:
Bar chart
![Journal items analysis as a bar chart in Viindoo Accounting]()
Line chart
![Journal items analysis as a line chart in Viindoo Accounting]()
Pie chart
![Journal items analysis as a pie chart in Viindoo Accounting]()



How do I use the Analytic Report?
The Analytic Report analyzes the analytic items, which gives managers a multi-dimensional view of costs and revenues by analytic account.
Analytic items are only recorded when Analytic Accounting is on. Navigate to Accounting > Configuration > Settings, tick Analytic Accounting in the Analytics section and click Save.

Then navigate to Accounting > Reporting > Management > Analytic Report. By default the filters From last fiscal year and P&L Accounts are applied; change them to read other data.

As in the Journal Items Analysis you can:
Read the report in the Pivot, List, Kanban or Graph view.
Pivot report:![Analytic report as a pivot table in Viindoo Accounting]() Graph report:
![Analytic report as a graph in Viindoo Accounting]()
Choose the measures: Amount, Quantity, Start Time and Count.
Save the report to your favorite filters for later use.


Expected result
A pivot table or graph of the journal items or of the analytic items that you can group, filter, save and share.
Common mistakes
The Analytic Report is empty - no analytic item exists in the period: check that Analytic Accounting is on and that the journal items carry an analytic distribution, or change the default filters.
Next steps
See also
Related article
Optional module