
Views and reports: which view should I use?
Every Viindoo menu shows its records in several views: list, kanban, calendar, pivot, graph, activity and, in some apps, cohort, map, hierarchy or Gantt. Switch views with the icons at the top right. All views use the same search and filters, so you can filter once and look at the result as a table, a board, a chart or a calendar. Reports are simply the pivot and graph views of the data.
Who |
Any user. |
App |
All apps (the examples below use CRM and Sales) |
Before you start
Know how to filter and group records: views show only the filtered records.
The examples use the CRM and Sales apps. The hierarchy view is in Employees, the Gantt view needs the Project Scheduling module and the dashboards are in the Dashboards app.
Which views does a menu offer?
Each menu shows only the views that suit its data. For example, Sales ‣ Orders ‣ Quotations offers list, kanban, calendar, pivot, graph and activity views, while Sales ‣ Reporting ‣ Sales offers only graph, pivot and list.


View |
Use it to |
|---|---|
List |
Read, compare and edit many records at once; select records for actions such as export. |
Kanban |
Follow work by stage and move a card to the next stage by dragging it. |
Calendar |
See records on their dates (meetings, deadlines, deliveries). |
Pivot |
Sum and count by rows and columns, like a spreadsheet pivot table. |
Graph |
See trends and shares as bar, line or pie charts. |
Activity |
See every planned activity (call, meeting, to-do) per record and its status. |
Cohort, Map, Hierarchy, Gantt |
Specialised views available in some apps, described below. |
How do I read records in a list or kanban view?
Click the List icon to show one record per line. Each column is a field, such as Opportunity, Email or Expected Revenue.
![CRM pipeline in list view]()
Click the Kanban icon to show one card per record, in columns by stage (for example New, Qualified, Proposition, Won). Drag a card to another column to change its stage.
Click the arrows at the top of a column to fold it; click a folded column to open it again. The screenshot shows the last two columns folded.
![CRM pipeline in kanban view with one column per stage and the last two columns folded]()


How do I see records on a calendar?
Click the Calendar icon. Records are placed on their date, for example opportunities on the deadline of their next activity. Use the arrows and Today to move in time, the scale selector (Month) to switch between day, week, month and year, and tick or untick people in the right panel to show or hide their records.
![CRM pipeline in calendar view by month]()

How do I analyze data in a pivot table?
Click the Pivot icon. Click a row or column header to break it down by another field, and use the buttons above the table (see the table below).
![Pivot table of expected revenue by month and stage]()

Button or icon |
What it does |
|---|---|
Measures |
Chooses the values to sum or count, for example Expected Revenue or Count. |
Flip axis |
Swaps rows and columns. |
Expand all |
Opens every row and column that was collapsed. |
Download xlsx |
Downloads the table as an Excel file. |
How do I show data as a chart?
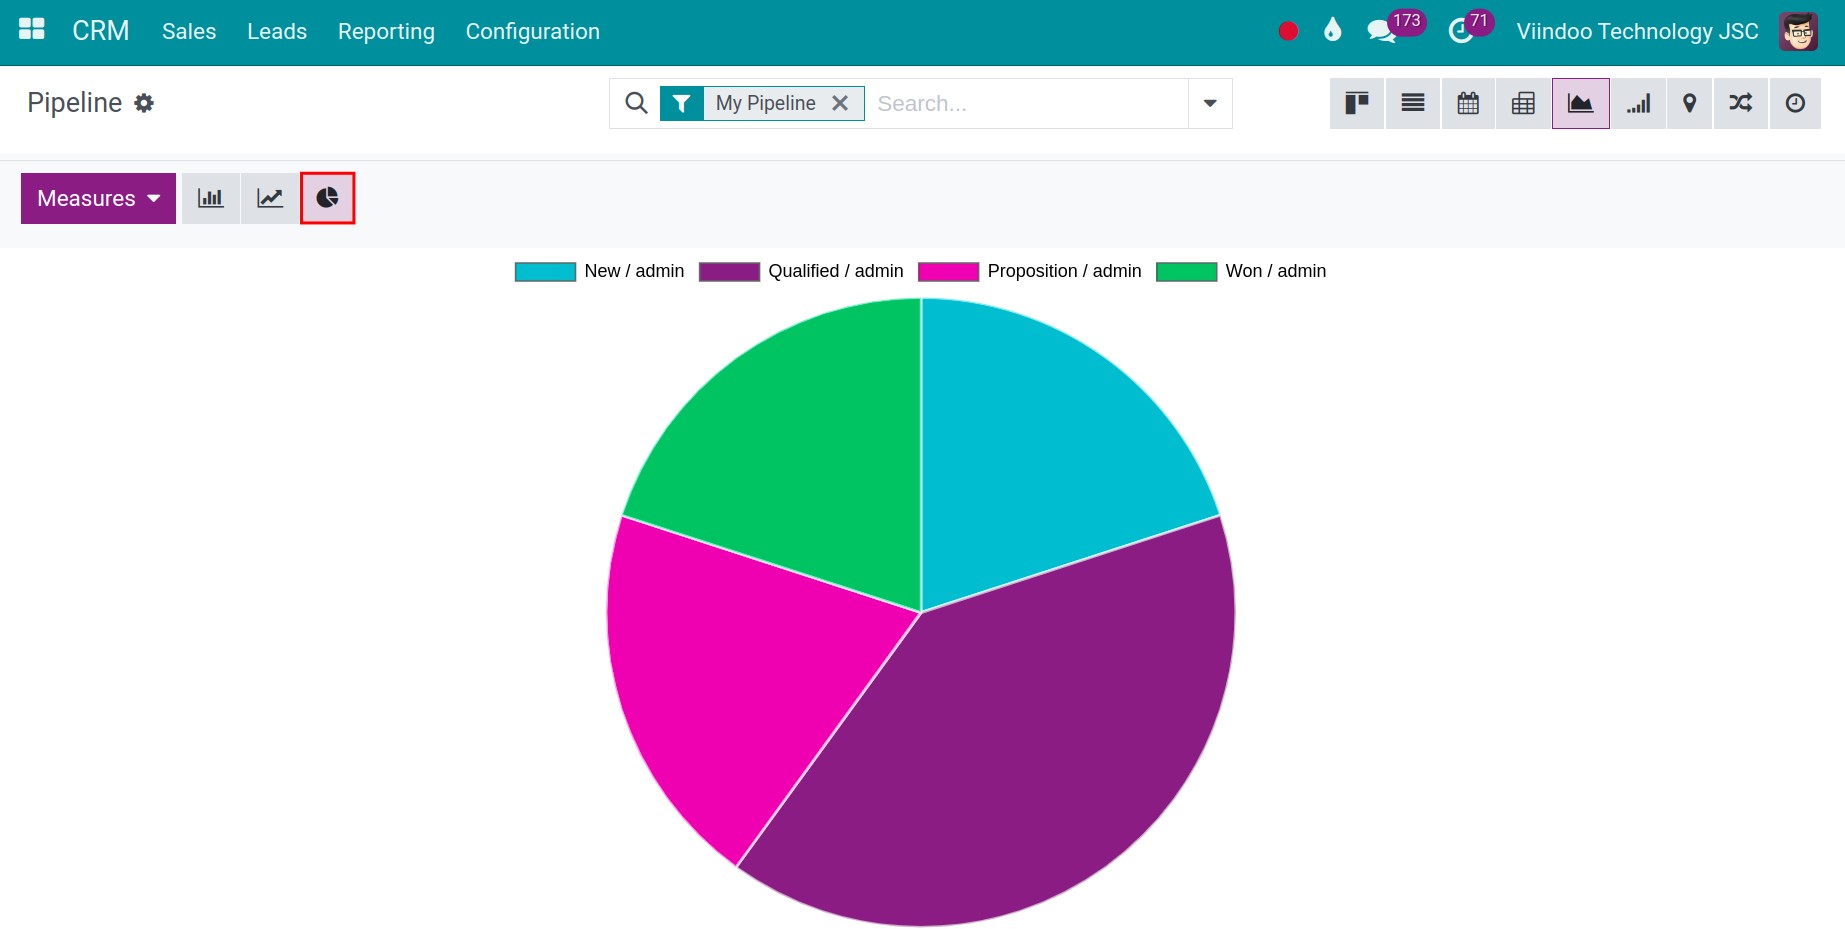
Click the Graph icon, then choose Bar Chart, Line Chart or Pie Chart with the icons above the chart, and the value to show in Measures.
![Bar chart of opportunities by stage with the chart type buttons]()
For bar and line charts, use Stacked to stack the groups, and Descending or Ascending to sort the bars. Line charts also offer Cumulative.
![Pie chart of opportunities by stage]()

How do I see planned activities?
Click the Activity icon. Each row is a record and each column a type of activity; green is planned, orange is due today and red is overdue. Click a cell to see or plan an activity.
![Activity view with one row per opportunity and one column per activity type]()

Which specialised views exist?
View |
What it shows |
Where to find it |
|---|---|---|
Cohort |
How groups of records created in the same period evolve over time. |
CRM pipeline, cohort icon. |
Map |
Records placed on a map by the address of their contact. Click Open in Google Maps to get directions. |
CRM pipeline, map icon. |
Hierarchy |
Records as an organization chart. |
Employees, Employees and Departments menus, hierarchy icon. |
Gantt |
Tasks as bars on a timeline, with the dependencies between them. Choose the scale (hour, day, week, month or year) next to Today. |
Project tasks of a project, Gantt icon, when the Project Scheduling module is installed. |


How do I put several reports on one screen?
The Dashboards app shows ready-made dashboards grouped by area (CRM, Sales, Invoicing, Logistics, Services, Website…). Click a dashboard in the left panel to open it, and change the period with the date filter at the top right of the search bar.

Common problems
Problem |
What to do |
|---|---|
A view icon is missing. |
The menu does not offer that view, or the module that adds it (for example Gantt) is not installed. |
The pivot or graph shows fewer records than the list. |
The views share the same filters. Check the facets in the search bar. |
The pivot, graph or dashboard shows no data. |
The filter excludes every record (for example My Pipeline when you have no opportunity) or the period of the dashboard is too short. Remove the filter or widen the period. |
Next steps
How to search, filter, group and save searches: filter and group the data before you analyze it.
How to export and import data in Viindoo: export a list to Excel.