
How to see quotation conversion with a Sankey chart
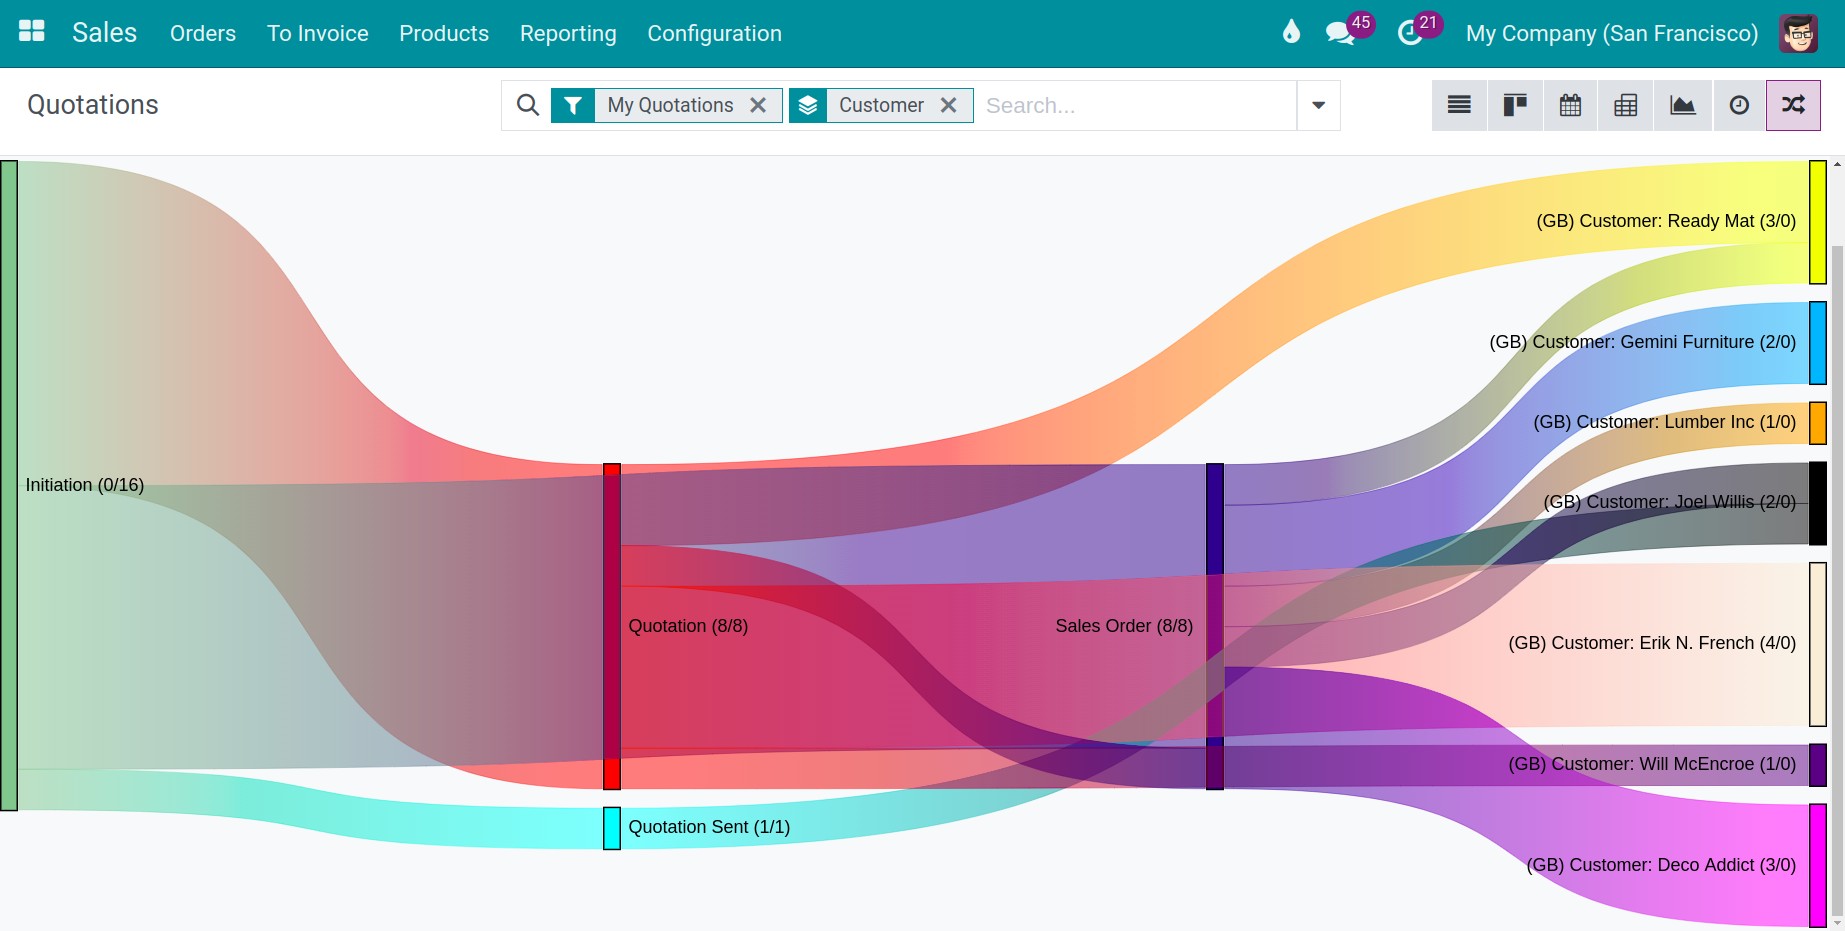
The Sankey view shows how your quotations flow through their stages: from Initiation (created) to Quotation, Quotation Sent, Sales Order or Cancelled. The width of each band is the number of documents moving between two stages, so you see at a glance where quotations stop. Open Sales ‣ Orders ‣ Quotations (or Orders) and click the Sankey view icon at the top right.
Who |
Any Sales user (they see the documents their role allows). |
App |
Sales (module |
Before you start
Know how to filter and group records.
How do I open the Sankey chart?
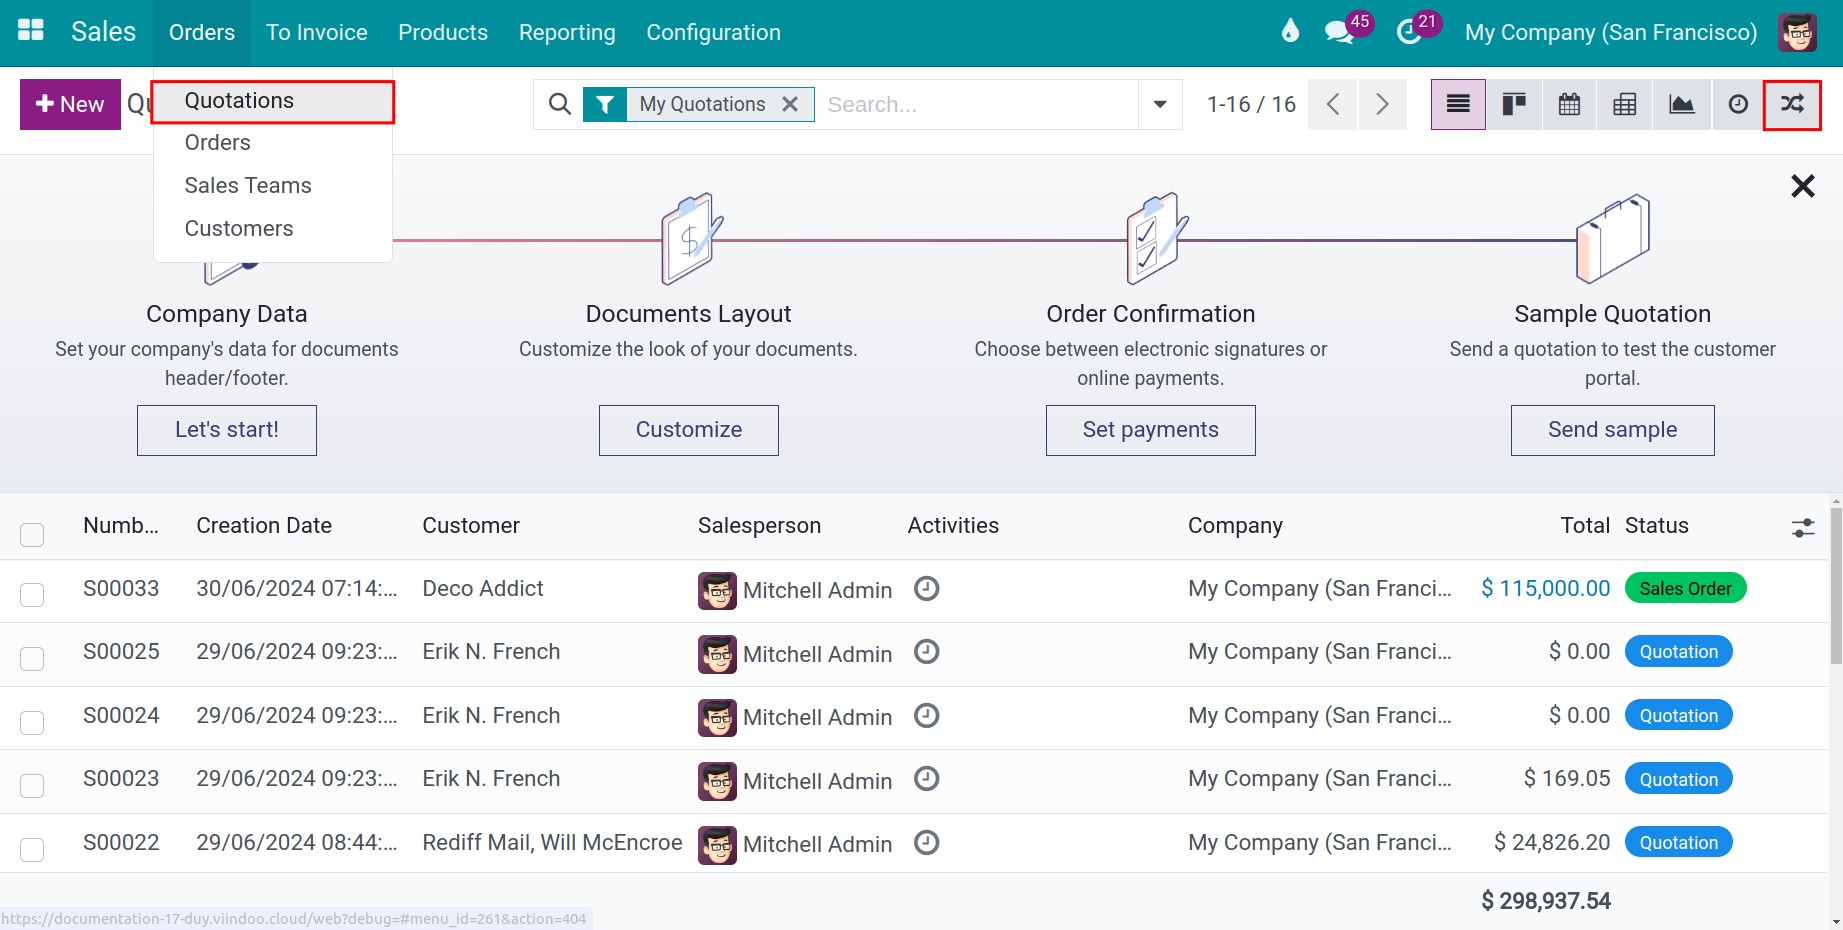
Go to Sales ‣ Orders ‣ Quotations (or Sales ‣ Orders ‣ Orders).
Click the Sankey icon among the view icons at the top right.
![Sankey view of quotations in the Viindoo Sales app]()
How do I read the chart?
Each block is a stage of the order. The numbers in/out on a block are the documents that reached the stage and those that moved on to another stage.
Initiation counts all quotations and orders created.
Quotation shows quotations not sent yet; a high in with a low out means quotations are prepared but not sent.
Quotation Sent shows quotations sent to customers; what leaves it goes to Sales Order or Cancelled.
Hover a band to see how many documents follow that path.
The conversion rate is the number reaching Sales Order divided by Initiation.
How do I compare customers, salespeople or periods?
Use Filters (for example this month) and Group By (for example Customer or Salesperson): the chart then shows one flow per group.
Common errors
Problem |
What to do |
|---|---|
The Sankey icon is missing. |
The module |
The chart is almost empty. |
The default filter of the menu limits the documents (for example My Quotations). Remove it. |