A shop floor digitalization roadmap decides what gets done first, what waits, and what each step must pay back. Without one, the story is familiar. The plant buys tablets, plans sensors on every machine and expects a full dashboard by the end of the year. A few months later, output is written on paper again during the shift and typed in afterwards, and the dashboard shows numbers nobody quite trusts.
This closing article of the series asks why projects stop halfway, and when connecting machines or using AI is actually worth it.
Why shop floor digitalization projects stall halfway
The gap between the ideal design and real resources
Most stalled projects began with a design that was correct on paper. It assumed complete master data, every operation recorded in real time and a supervisor with time to watch screens. The real plant has half-finished master data, operators with both hands on the product, supervisors who also lead a team, and one IT person shared with the office.
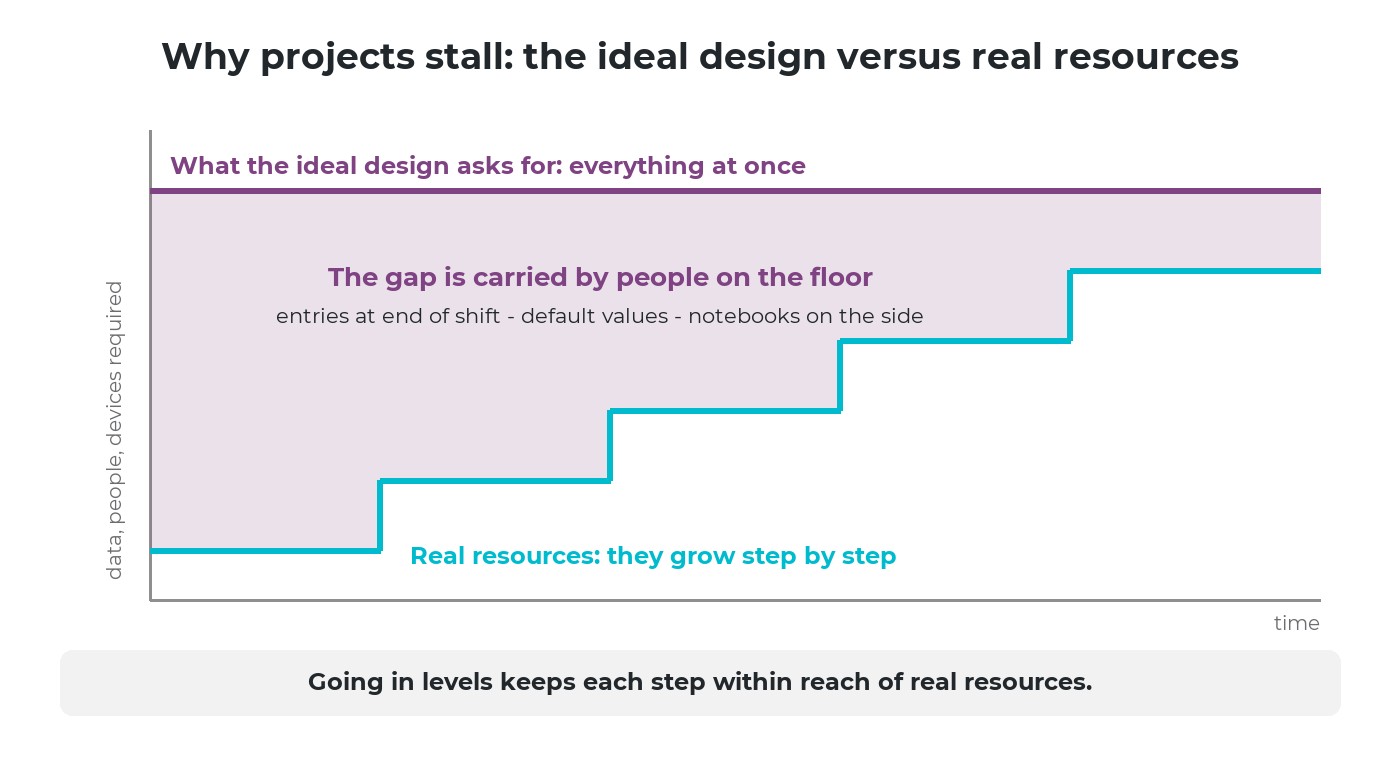
The ideal design asks for everything at once; real resources grow step by step. A project stalls when the gap becomes too wide.
The wider the gap, the more each person on the floor has to carry. When that extra load brings no visible return, the floor quietly works around the system: entries made at the end of the shift, default values, notebooks kept on the side.
Avoiding the system is a symptom, not the cause
It is tempting to call this resistance and blame people. But operators avoid a system for concrete reasons: it asks for data their work does not produce, it serves someone else's report, or it adds steps without saving any. These are design and sequencing decisions made above the floor, a trap described in why digitalization sometimes adds tasks.
What the evidence says
In 2020, Boston Consulting Group combined a survey of 825 senior executives with 70 of its own digital transformation engagements: 30% met or exceeded their target value with lasting change, 44% created some value but missed the target, and 26% created less than half of it. Its first success factors were a clear, integrated strategy and leadership commitment from the CEO to middle management.
In Vietnam, a 2019 study by Dương Thị Hải Phương (University of Economics, Hue University) surveyed 153 managers, IT staff and users in companies running ERP: organisational factors explained 76.9% of the effect on successful implementation, and leadership support weighed most, as published in the Hue University Journal of Science.
The popular claim that "70% of transformations fail" is better left out: a 2011 review by Mark Hughes in the Journal of Change Management found no valid empirical evidence behind it. The real data says something narrower: most projects miss their original expectations, and the causes sit in leadership, strategy and sequencing, where change management in manufacturing starts.
Keeping things as they are is not a way out either
After a stalled project, many owners decide to wait. Meanwhile output and defects are still known a shift late, stops are remembered rather than counted, and the plant depends on a few experienced people. These are the information, coordination and knowledge gaps of shop floor management.
Customers keep asking for shorter lead times and lot traceability. So the question is not whether to have a shop floor digitalization roadmap, but how big each step should be.
The way out: a shop floor digitalization roadmap in levels
Maturity frameworks share one idea: assess where the plant stands, then take the next step without skipping. Singapore's Smart Industry Readiness Index (2017) scores a plant from 0 to 5 on process, technology and organisation. The acatech Industrie 4.0 Maturity Index puts computerisation and connectivity before visibility, transparency, prediction and adaptability.
For a plant of 20 to 300 people, this fits into four levels: paper, digitized people's work, connected machines, then analysis and AI.
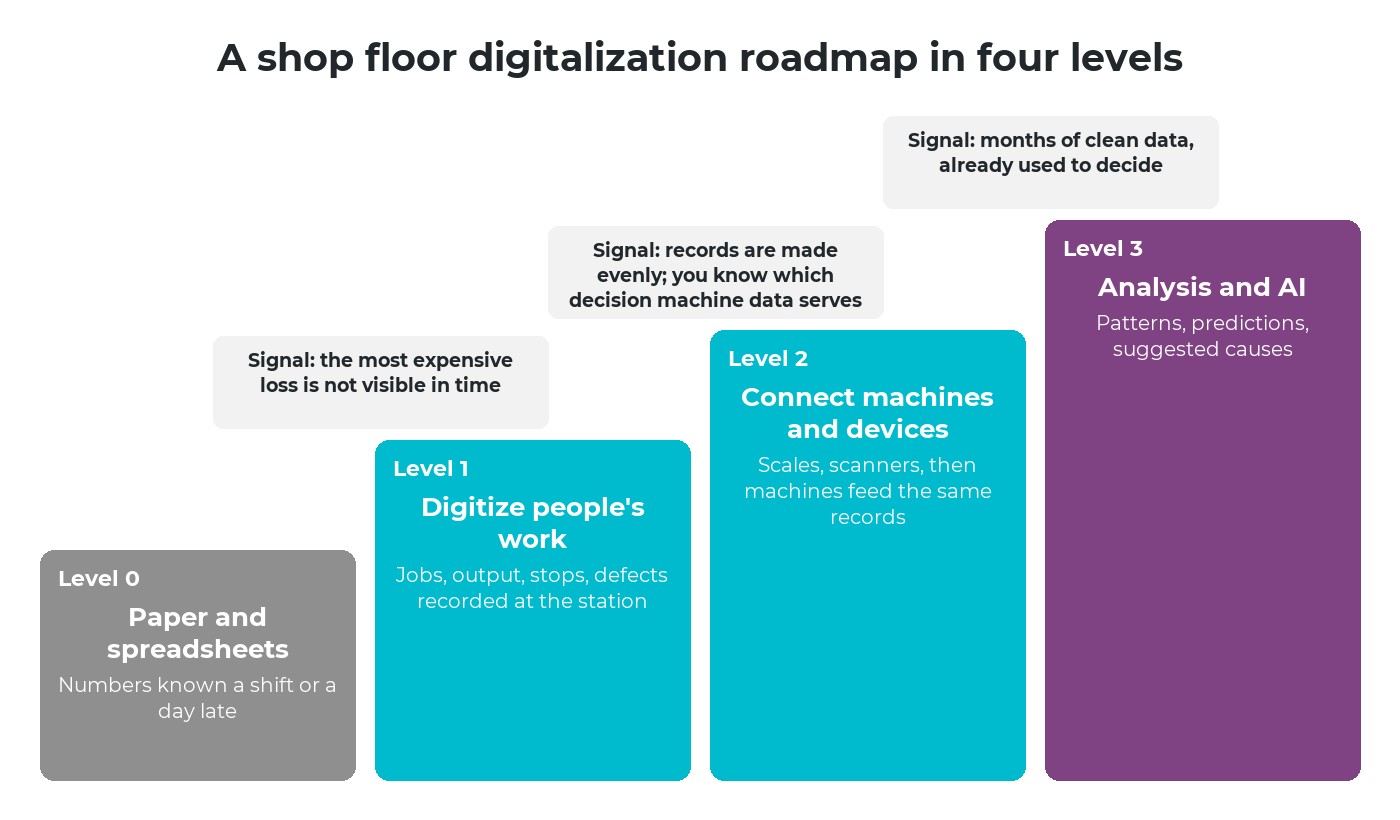
Each level must pay back before the next one starts. The signal to move up is observed, not planned.
A shop floor digitalization roadmap built this way follows five rules:
Start from the most expensive pain
Not from the newest technology. If unplanned stops cost most, start with machine stops and incidents.
Value within weeks
Each level gives the supervisor something usable within weeks.
Only data the work produces
A job started, a quantity finished, a stop and its reason. Nothing typed only for a report.
Standards grow gradually
Reason codes and loss rates are refined from floor records, not perfected before go-live.
Move up on a signal
When the current level is used daily and its limit is clear.
On sequencing: standardize the work just enough to record it, then let the records improve the standard, as discussed in whether automation should come before or after standardization.
When machine connectivity is worth it (level 2)
Connecting machines pays only under two conditions. First, people already record level 1 data evenly, so machine data has an order, an operation and a reason to attach to. Second, the plant knows which decision the machine data serves: counting output, timing stops, or reading a value now copied by hand. Otherwise a sensor only produces another number, as explained in applying IoT in manufacturing.
Every plant needs its own design
Machines on one floor differ in brand, age and controller; some have a data port, some need a sensor, some are not worth connecting. In the ISA-95 model, machine control sits at levels 0 to 2 and production operations at level 3. Connecting the two is designed plant by plant, in four steps.
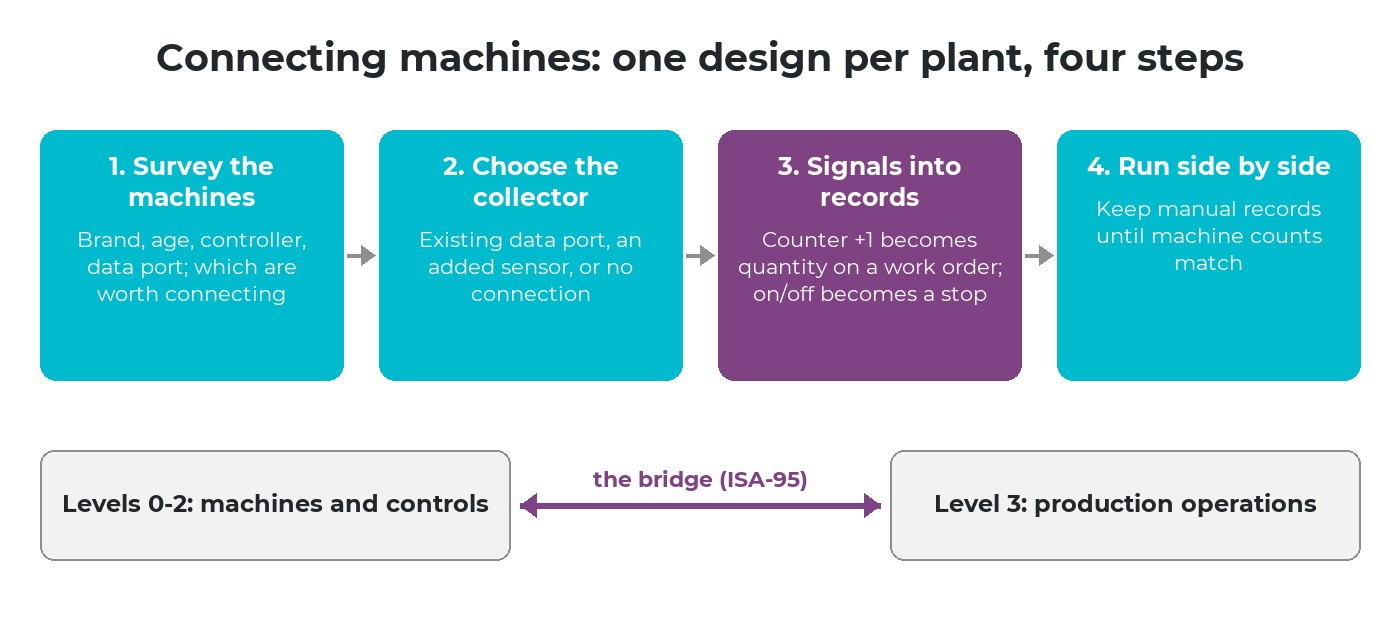
Survey the machines, choose the data collector, turn signals into records, then run alongside manual records until the two match.
The third step takes most effort: a signal such as "counter +1" means nothing to management until it becomes a quantity on a work order or a stop with a start and an end. Until machine counts match operators' records, keep both.
The cheapest start is often a device already at the station, such as a scale or a barcode scanner, which removes copying errors on day one. How these fit with other systems is covered in ERP, WMS, MES, IoT: where should businesses begin?
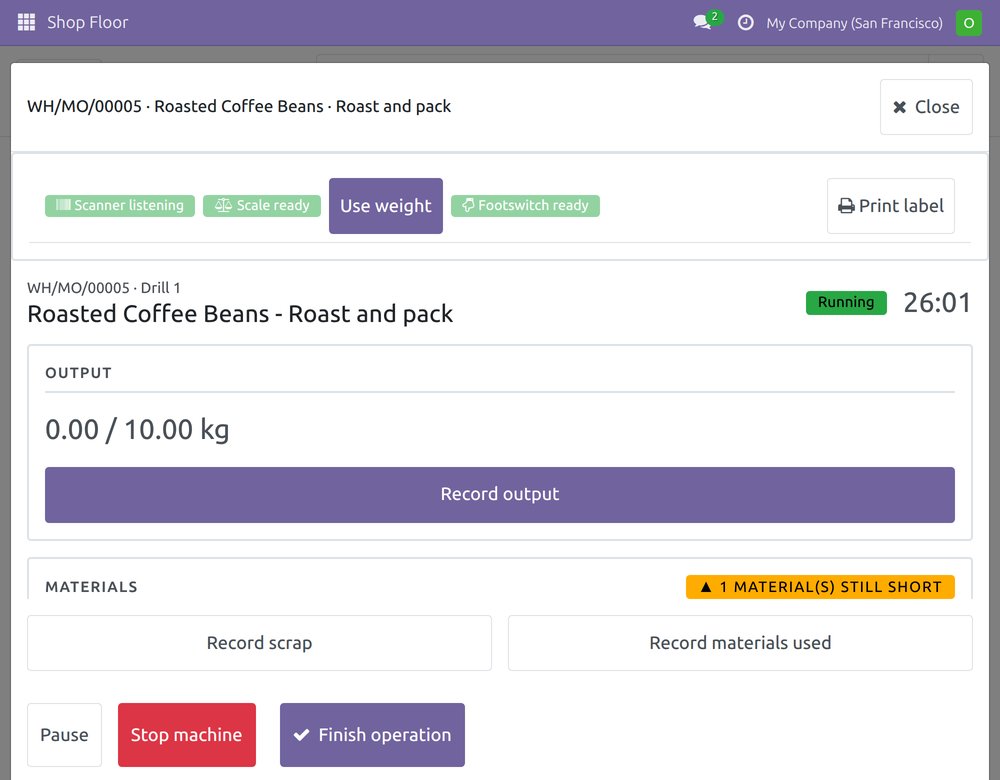
Example: the station's own scanner, scale and footswitch show their status on the operator's screen.
When to use AI (level 3)
AI promises to find bottlenecks, predict late orders and suggest causes of breakdowns. All of it depends on data that is long and clean enough: several months covering the usual mix of products and shifts, one shared list of reason codes, every record tied to an order, every number carrying its source.
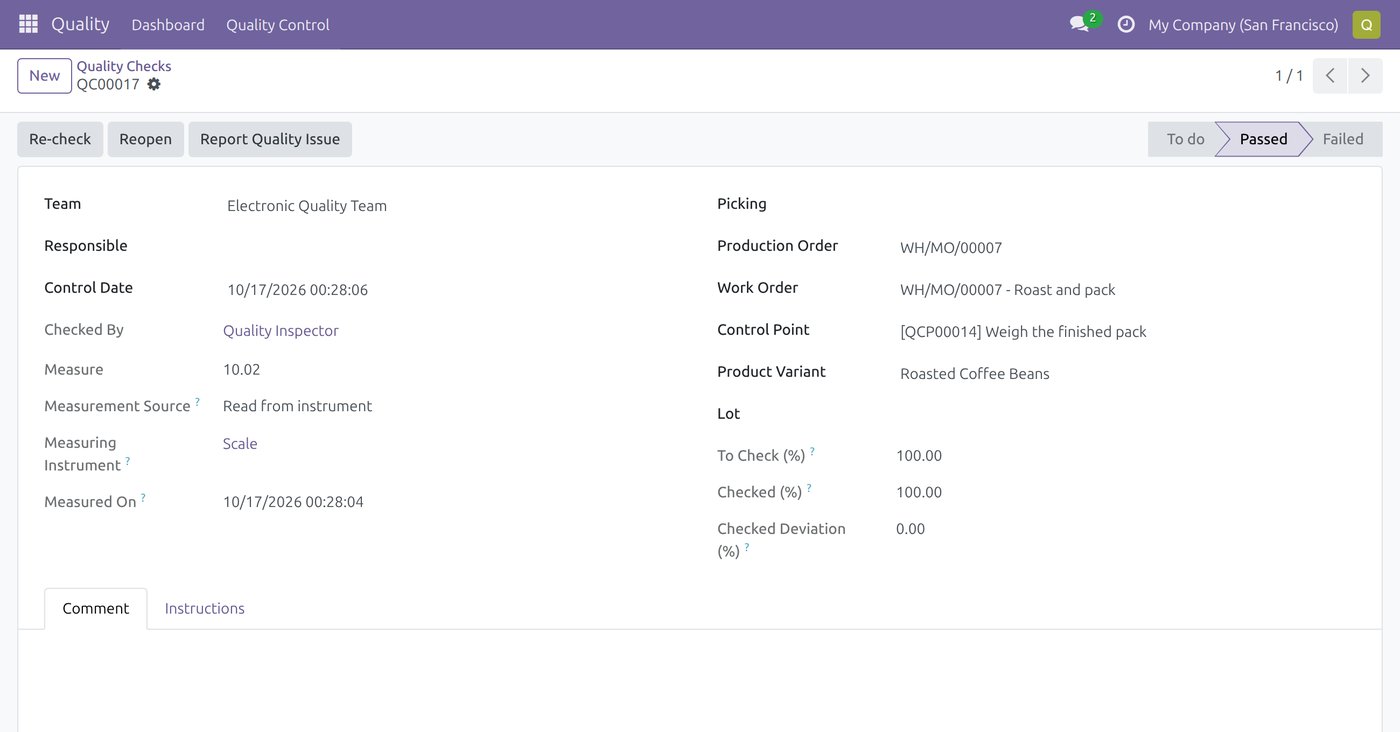
Example: a quality check keeps the measured value, its source, the instrument and the time it was read.
A plant is ready for this stage of its shop floor digitalization roadmap when managers already decide from level 1 and 2 data every week, the open questions are patterns nobody sees by eye, and someone will act on the findings. Otherwise AI on patchy data only gives confident guesses. More in when to use AI in Kaizen and ERP.
Connect machines when you know which decision their data serves. Use AI when the data is long and clean enough to learn from.
Starting the shop floor digitalization roadmap: 90 days on one line
The safest start is a time-boxed trial on the line with the most visible loss.
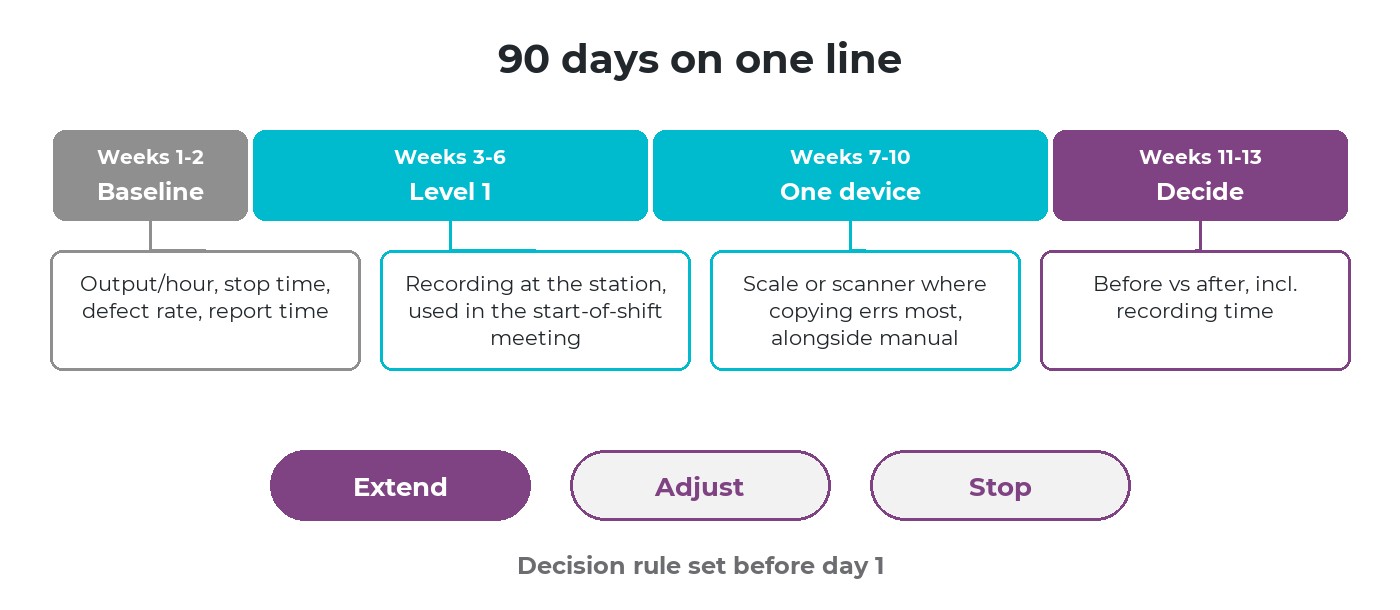
Baseline first, then level 1, then one connected device where it pays, then a decision based on numbers.
Weeks 1-2: baseline
Output per hour, stop time, defect rate and report compiling time, measured the current way.
Weeks 3-6: level 1
Operators record jobs, output, stops and defects on a tablet; the supervisor uses them at the start-of-shift meeting.
Weeks 7-10: one device
Connect one device where copying causes most errors, often a scale or scanner, alongside manual records.
Weeks 11-13: decide
Compare before and after, including recording time. Extend, adjust or stop.
With no baseline at all, the first two weeks become the baseline; see measuring ROI without a baseline.
Set the decision rule before the trial starts, for example: extend if stop time falls and recording takes operators no longer than the old paper form (illustrative example).
The whole series as one shop floor digitalization roadmap
Each article in this series asked what management must see in one part of the floor, and the smallest level of technology that shows it. Together, the answers form one plan.
| Topic | Level usually enough to start |
|---|---|
| Readiness before releasing an order | Level 1 |
| Production progress | Level 1 |
| Machine stops and incidents | Level 1, level 2 on critical machines |
| Quality and traceability | Level 1, level 2 for scales |
| Material flow | Level 1 |
| Reports and management rhythm | Level 1, level 3 once data is long |
| Operators and skills | Level 1 |
Almost every topic starts at level 1, because that is where the frame for every later level is built.
Six questions before choosing the next step
Most expensive pain
Which loss costs the most today: stops, waiting for materials, defects, or late deliveries?
Current level
Is work recorded on paper, at the end of the shift, or when it happens at the station?
Workarounds
Where does the floor still keep a notebook beside the system, and why?
Machine data
Which decision would machine data change, and who would make it?
Data history
How many months of clean, order-linked records exist today?
Leadership
Who in management owns the shop floor digitalization roadmap and reviews it monthly?
The first question decides where to start; the last decides whether the roadmap survives.
How Viindoo supports a step-by-step roadmap
At Viindoo, the levels are switched on within one system, so moving up does not mean replacing the software. Each level writes into the same work orders and quality checks the previous level already uses.
| Level | In Viindoo |
|---|---|
| Level 1 - people's work | Available: the Shop Floor screen on a tablet at the station |
| Level 2 - station devices | Available: scales and barcode scanners through an IoT box; a scale reading can fill the output quantity or a quality check measurement |
| Level 2 - production machines | Ready for integration through the open API and webhooks, designed for each plant; no ready-made PLC or OPC UA connector |
| Level 3 - AI | Direction of development |
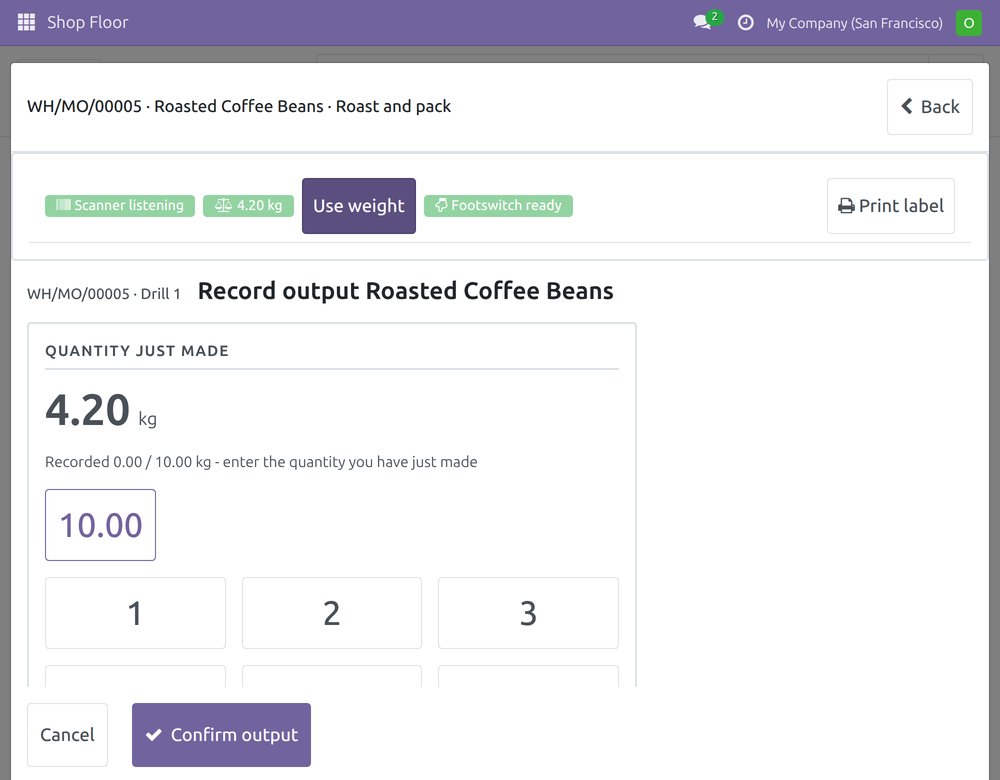
Example: the weight read from the station's scale is offered as the quantity just made; the operator confirms it.
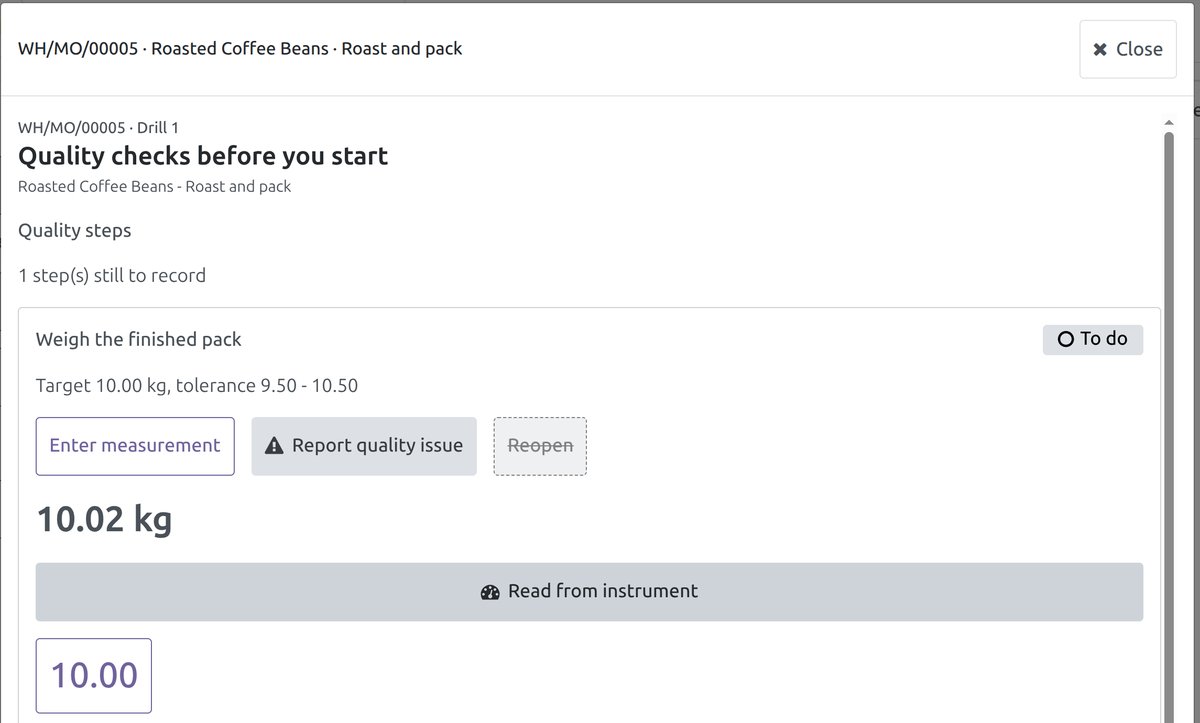
Example: a quality step shows its target and tolerance, and the measurement is read from the scale instead of being typed.
Frequently asked questions
Not before finding why it stalled. If the cause was sequencing or data the work did not produce, a new system with the same plan stops at the same point.
For one critical machine, sometimes. For the whole floor, machine data without orders and reasons from people is hard to use.
That is a result too. Check whether the line had the most expensive loss and whether the numbers were used daily, before changing technology.
Not sure which level your floor is at? Book a shop floor assessment with Viindoo: we look at your most expensive loss and your current records with you, and suggest a first step, before talking about software.
The series on shop floor management in manufacturing: the pillar article on shop floor management; production readiness before releasing an order; production progress; machine stops and incidents; quality and traceability; material flow through the plant; production reports and the management rhythm; operators and skills; and this closing article on going step by step.