Machine downtime response is where many plants lose more time than they think. A machine stops, the operator waits, someone makes a phone call, the team leader walks around looking for a technician. The machine runs again and the shift moves on.
At the end of the month, nobody can say for sure how many times that machine stopped, how long it waited before anyone came, or why it keeps stopping. The stops were real; the record of them is not.
Why machine downtime response drifts
In the shop floor management framework, an incident only counts as handled when its loop is closed. A verbal report breaks that loop at three points: nobody is clearly the owner, nobody knows exactly when the problem was solved, and nobody writes down why it happened.
This is not a problem of careless people. A spoken message passes through several hands, each of whom is busy with their own work. The design of the process, not the operator, decides whether a stop is followed to the end.
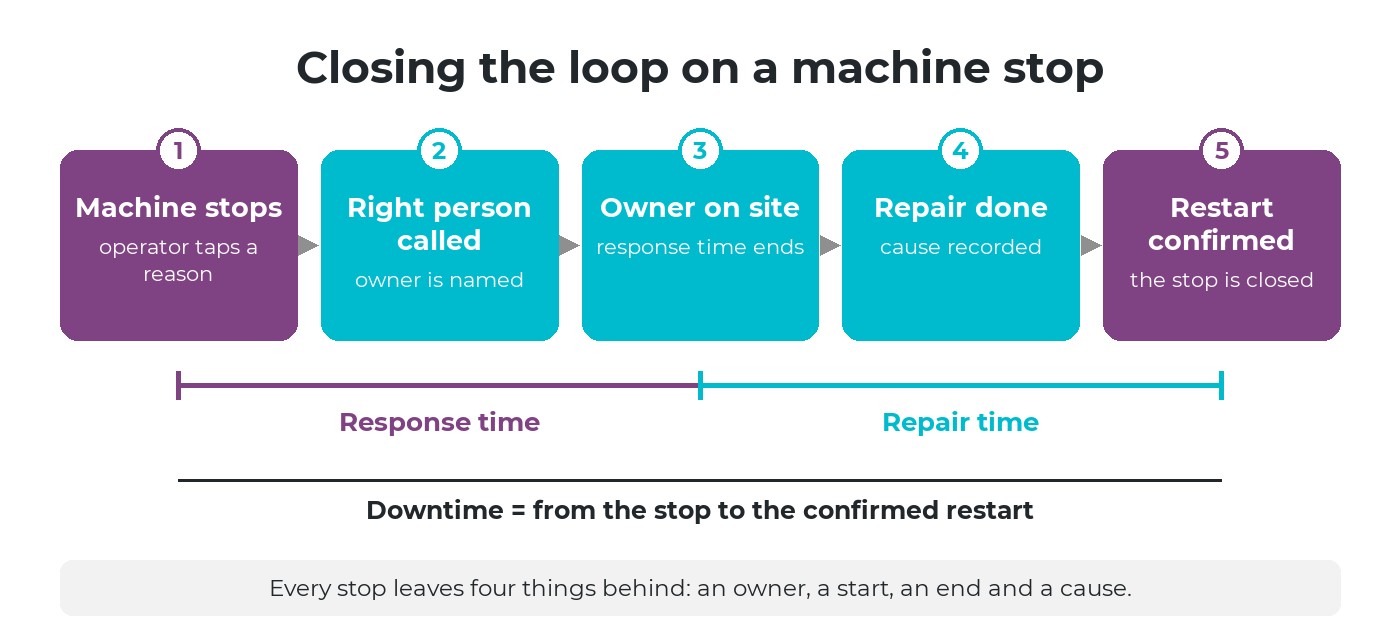
Five points close the loop on a stop. Response time and repair time are two different intervals with different causes.
Four facts every stop must leave behind
| Fact | Why it matters |
|---|---|
| Owner | Someone is accountable from the call until the restart; the stop does not fall between two teams |
| Start time | Recorded when the stop happens, not reconstructed from memory at the end of the shift |
| End time | Set when someone confirms the machine is back to work, so downtime has a clear end |
| Cause | Chosen from a short list, so stops can be added up and compared later |
These four facts are the raw material for every later decision: who to staff on call, which spare parts to keep, which machine to overhaul.
Report the stop with a reason, call the right person
In machine downtime response, not every stop needs the same person. A breakdown needs a technician; a material shortage needs the warehouse; a quality doubt needs the inspector; a changeover needs the setter. When the reason is chosen at the moment of the stop, the call goes straight to the right owner instead of passing through the team leader.
| Stop reason group | Who receives it | What closes it |
|---|---|---|
| Machine breakdown | Maintenance technician | Repair done and restart confirmed |
| Waiting for materials | Warehouse, planning | Materials delivered to the station |
| Quality doubt | Quality control | Decision to continue, adjust or hold |
| Setup and changeover | Setter, team leader | First good part produced |
The reason list should be short and written in the floor's own words. Ten clear reasons that people actually choose are worth more than fifty that nobody can find.
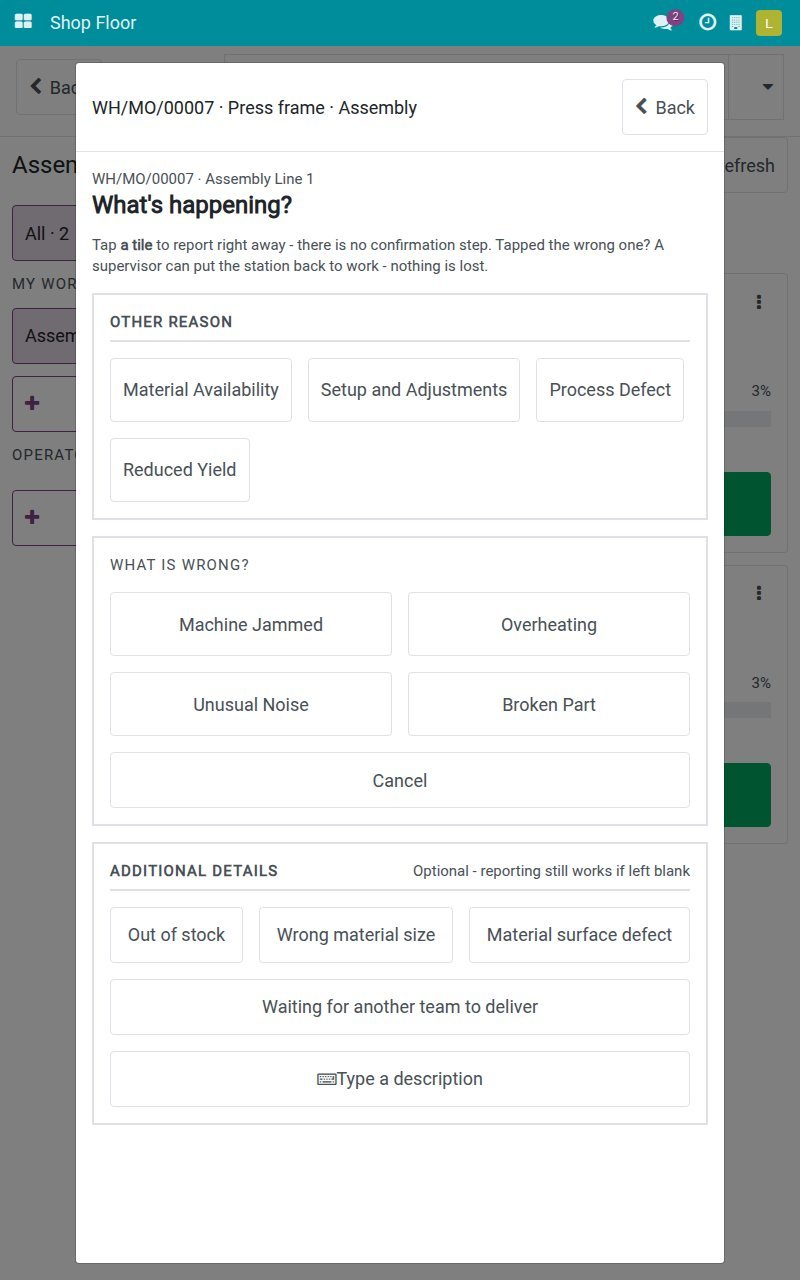
Example: at the station, the operator taps what is wrong (machine jammed, overheating, unusual noise, broken part) instead of typing a description.
Two more rules keep the call clean. First, one incident means one call: if a second person reports the same stop, they should see that someone has already been called, and when. Second, a machine that still runs but needs attention should be reported without stopping production, so small signs are not hidden until they become breakdowns.
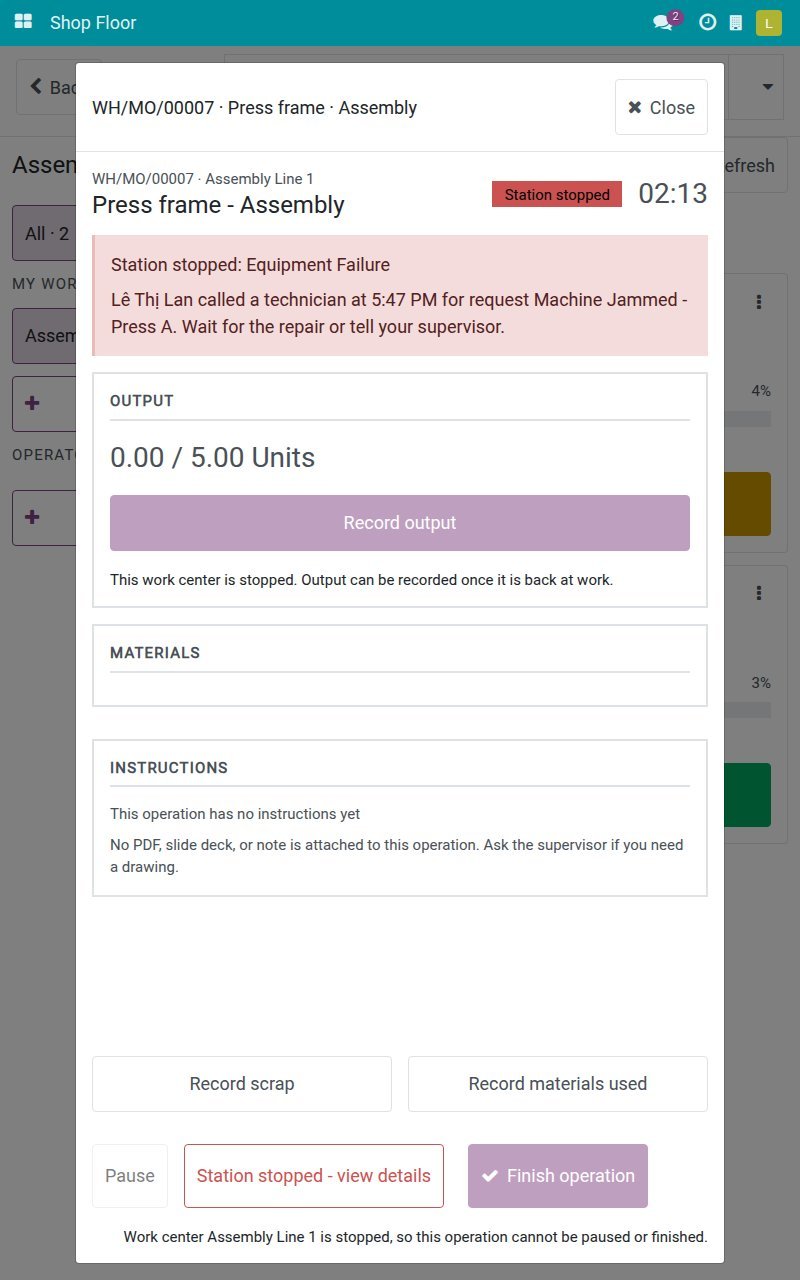
Example: the stopped station shows who called the technician and at what time, and asks people to wait for the repair or tell the supervisor.
Measure response time and repair time separately
Total downtime hides two very different problems. Response time runs from the stop until the right person is at the machine. Repair time runs from that moment until the machine is confirmed back at work.
A long response time is an organisation problem: who is on call, where they are, how they learn about the stop. A long repair time is a capability problem: skill, spare parts, repair instructions, access to the machine's history. Mixing the two leads to the wrong fix, such as hiring more technicians when the real delay is that nobody tells them in time.
The end of a stop also needs an owner. If anyone can simply clear the stopped status, the record shows the machine running while the cause is still there. A good machine downtime response lets the technician close the repair, and lets a supervisor decide when a machine that could not be repaired goes back to work.
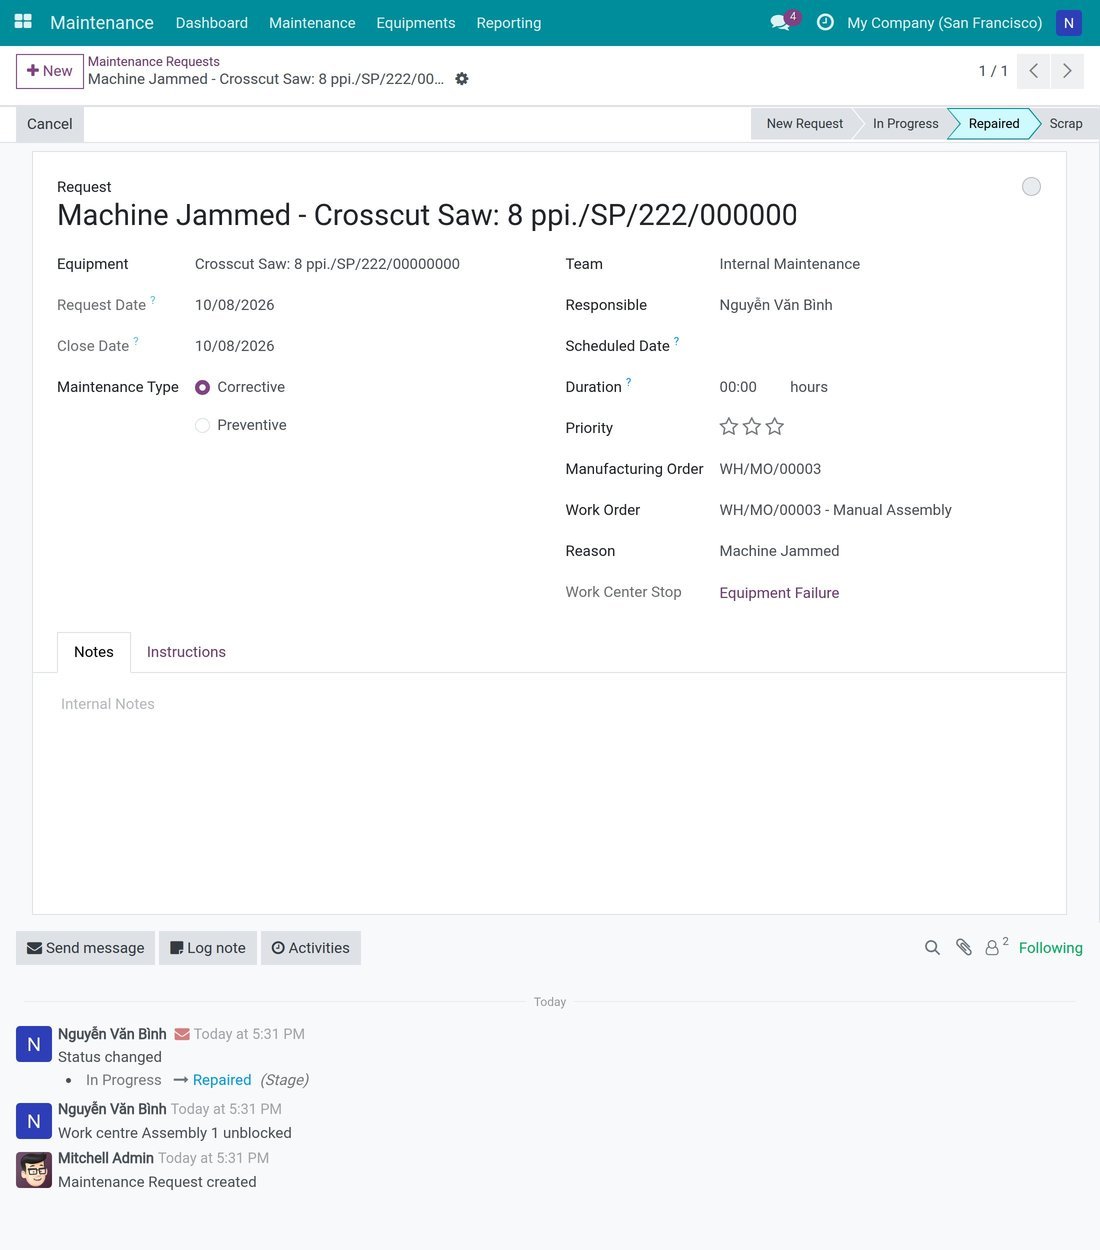
Example: the maintenance request carries the machine, the manufacturing order, the work order, the reason and the stop it belongs to; its history records when it moved to Repaired and when the work center ran again.
A simple internal target for machine downtime response helps, for example a technician at the machine within 10 minutes for a breakdown (illustrative example). The number matters less than measuring it the same way every time and reviewing it every week.
Add up stop reasons to see what keeps coming back
Each stop on its own looks like bad luck. Added up over a month, stops show a pattern. Sorting reasons by lost hours, the way a Pareto chart does, usually shows that a few reasons cause most of the lost time. It is one of the seven basic quality tools.
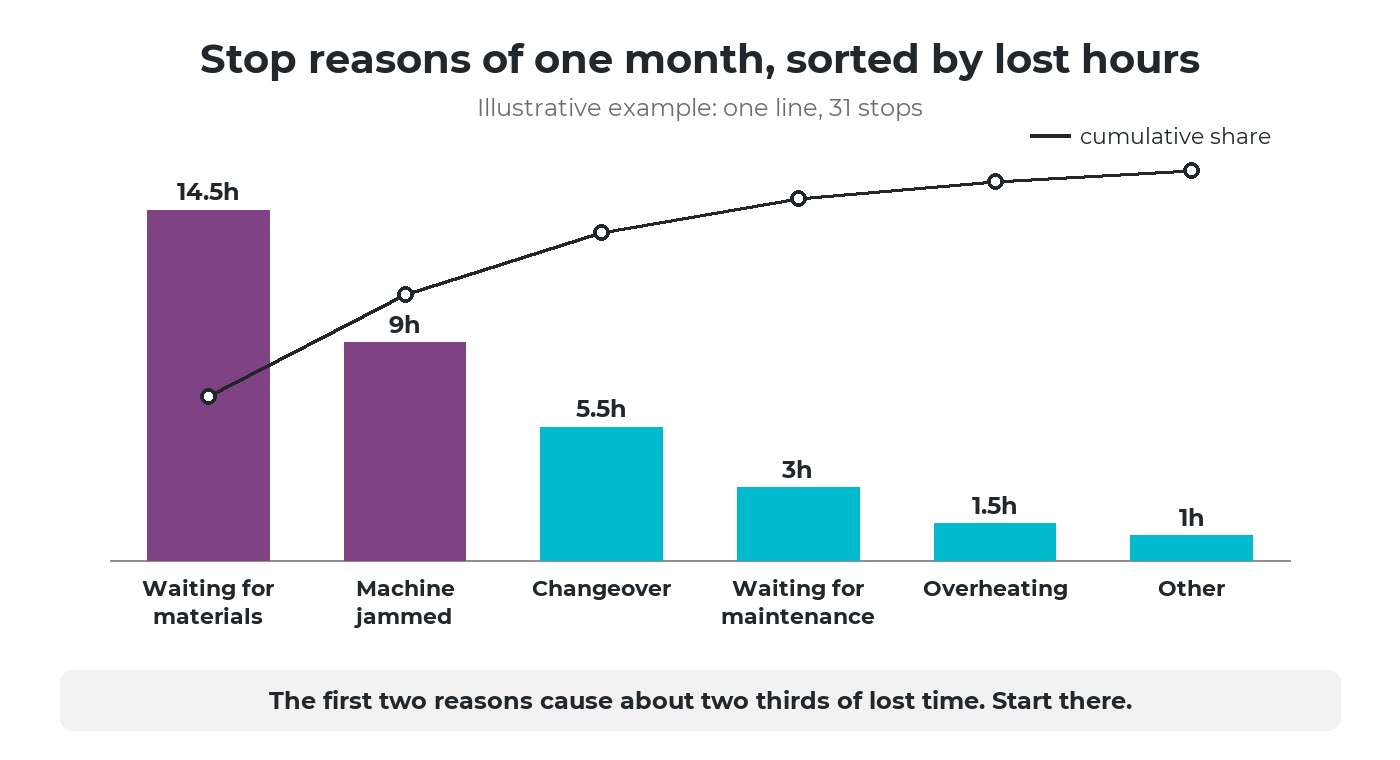
Illustrative example: two reasons cause about two thirds of the lost time on one line.
Notice that the biggest bar in the example is not a breakdown. Waiting for materials is a planning and warehouse problem; the maintenance team cannot solve it. This is why every stop needs a reason, not just the breakdowns: the list points each improvement to the team that can actually make it.
Stop time per reason is also what lowers the availability part of OEE. In machine downtime response, a short weekly review of the top three reasons, with one action and one owner for each, does more than a long monthly report. Ways to act on each type of loss are covered in what downtime in manufacturing is and how to reduce it.
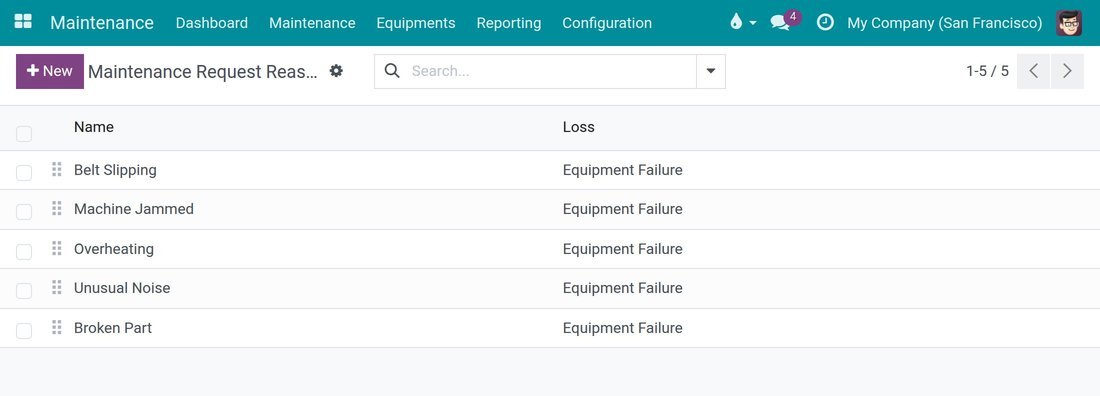
Example: a short list of breakdown reasons, each booked under a loss category so stop time can be added up.
From fixing breakdowns to planned maintenance
Once stops are recorded with causes, a plant can see which breakdowns could have been prevented. That is the moment to move part of the work from repairing after failure to maintaining before it. Three approaches are common, and most plants use a mix:
| Approach | Fits when | Needs |
|---|---|---|
| Repair after failure (corrective) | Failure is cheap and quick to fix, and does not stop a critical line | A fast call and spare parts on hand |
| Calendar-based preventive | Wear depends mostly on time: lubrication, filters, inspections | A maintenance calendar per machine and a reminder before each date |
| Usage-based preventive | Wear depends on how much the machine runs, and load varies by season | Running hours, estimated from shifts or read from the machine |
Running hours are where many plants overreach. Reading hours directly from a machine requires a data port or a sensor, and each machine model is different. Estimating hours from the shift pattern, for example 16 hours a day on two shifts (illustrative example), is good enough to start, as long as everyone knows it is an estimate. A planning approach is described in how to plan machinery and equipment maintenance.
Preventive work has a cost too: machine time and parts replaced before they fail. The stop records tell where it pays off. A machine with frequent, costly breakdowns of the same cause is a good candidate; a machine that rarely fails may be fine with repair after failure. The types of maintenance are compared in maintenance in production.
MTBF and MTTR in plain words
Two indicators summarise a machine's breakdown history. MTBF (mean time between failures) answers: on average, how long does this machine run before it breaks down again? MTTR (mean time to repair) answers: when it breaks down, how long does it take on average to get it back?
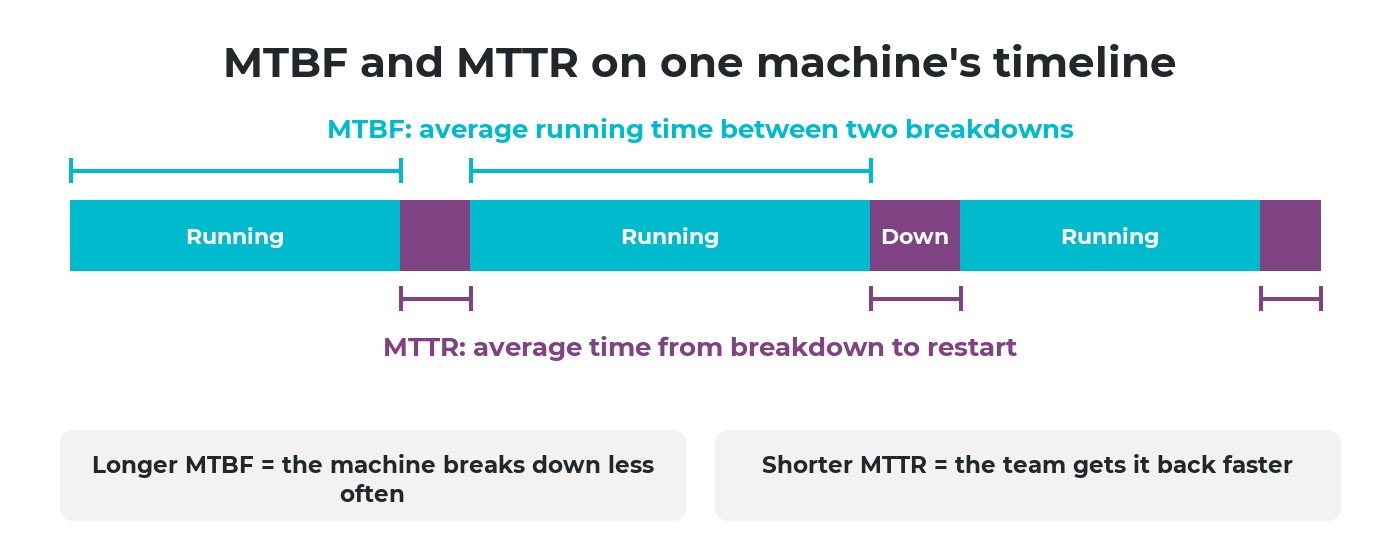
MTBF measures the running stretches between breakdowns; MTTR measures the stretches spent getting the machine back.
Read together, they point to different actions. A short MTBF calls for prevention: better maintenance, better operating conditions, or replacing a worn part for good. A long MTTR calls for faster repair: on-call arrangements, spare parts, repair instructions. A machine with both is a candidate for overhaul or replacement.
Both numbers are only as good as the records your machine downtime response keeps. With a handful of breakdowns a year, a single long repair moves the average a lot. They are best used to compare machines and watch trends, not as precise figures.
Technology for machine downtime response, in three levels
Level 1 - Digitize the report and the call
The operator reports the stop and its reason on a tablet; the right person is called; the stop has a start, an end and a cause. This alone closes most of the loop.
Level 2 - Connect the machines
The machine signals its own stops and running hours. Recording becomes more accurate, but a person still has to give the reason.
Level 3 - Analyse and anticipate
Recurring causes, failure trends and maintenance timing are analysed from a long, clean history of stops.
Move to level 2 when the reasons are already recorded reliably and the remaining doubt is about exact times, or when a critical machine needs hours read rather than estimated. More on this in applying IoT in manufacturing.
Six questions to assess your machine downtime response
Who knows first
When a machine stops, who knows first, and how does the technician find out?
Response time
Do you know, in minutes, how long a stopped machine waits before the right person arrives?
Reasons
Is every stop recorded with a reason from a fixed list, or only described in words, if at all?
Closing a stop
Who confirms that a machine is really back at work, and can anyone clear a stop by themselves?
Recurring causes
Can you name the three reasons that cost the most hours last month?
Maintenance
Which machines get planned maintenance, and is the plan based on their stop history?
How Viindoo supports machine downtime response
In Viindoo, a stop is reported on the Shop Floor tablet by choosing a reason. A breakdown stops the work center and raises a maintenance request in one tap, and the station returns to work when the repair is closed or when a manager restarts it. What is available and what is not:
| Need | In Viindoo |
|---|---|
| Close the loop on a stop | Available: stop time logged per reason; only the assigned technician or a maintenance manager closes a request that holds a machine stopped |
| Planned maintenance | Available: maintenance by calendar with reminders; by running hours estimated from average daily hours declared per machine, not read from the machine |
| MTBF and MTTR | Available per machine, in days, from completed corrective requests |
| Escalation and floor displays | Not available: no automatic escalation when a response is late, no Andon board |
| Machine connectivity | Integration-ready through the open API and webhooks, designed for each plant |
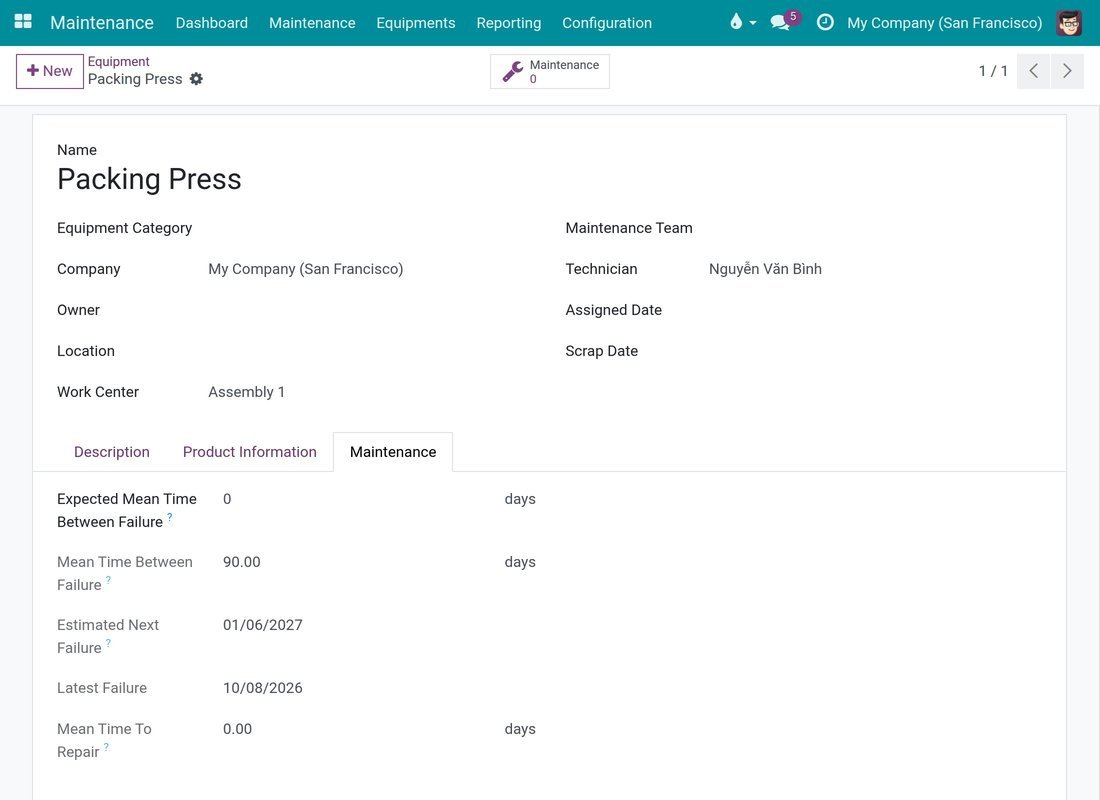
Example: the machine record shows the mean time between failures, the latest failure and the estimated next failure, computed in days from completed repair requests.
Frequently asked questions
They will if reporting takes one or two taps and brings them help faster. If reporting only feeds a report they never see, it will fade. Start with breakdowns, where the benefit to the operator is obvious.
Not by hand at first. Agree on a threshold, for example five minutes (illustrative example), and record everything above it. Very short stops are better captured later by machine connectivity.
For most machines, yes, as long as the estimate follows the real shift pattern and is reviewed when the load changes. Critical machines with very variable load justify reading hours from the machine.
Pick the line with the most stops, agree on a short reason list and who receives each reason, and record every stop for a month. The first Pareto of stop reasons usually tells you what to do next.
Want to know how your plant handles machine stops today? Book a shop floor assessment with Viindoo: we follow a few real stops with you, from the first call to the restart, before talking about software.
Next in the series: quality and traceability, catching defects at the source and tracing them back to their origin.
Related articles