Tiered meetings are how a plant turns its production numbers into decisions. Many plants already have plenty of numbers: an output sheet at the end of the shift, a spreadsheet for the morning meeting, a monthly report from accounting.
Yet the same problems keep coming back. The morning meeting runs long and ends with general reminders. The team leader learns about a defect batch from the customer. The cost overrun on an order shows up when the month is already closed. The numbers exist; the rhythm that makes someone act on them does not.
Why more reports rarely mean more decisions
In the shop floor management framework, a tiered management rhythm is one of the five principles. Without it, reports drift into three traps.
- Too late. A number collected at the end of the day describes a shift that is already over.
- Too general. A plant-wide total hides which team, machine or order caused the gap.
- Read by the wrong person. The person who sees the number cannot act on it, and the person who can act never sees it.
None of this is the fault of the people who fill in the sheets. When a report is designed for the person who compiles it rather than the person who decides, data entry becomes a chore and quality drops. The fix is in the design: fewer numbers, each with an owner and a time. The earlier article on building and tracking production reports covers the report formats; this one looks at who reads them and when.
Reports by role: the number, how to read it, the decision
A useful test for any report is one sentence: this person reads this number at this time to decide this. If the sentence cannot be completed, the report is decoration. Applied to six common roles, the test gives a short list:
| Role | Number | How to read it | Leads to |
|---|---|---|---|
| Team leader | Output vs plan by hour or shift; stops and defects in the shift | Gap per station, not a percentage for the whole team | Move people, call maintenance or quality, ask the supervisor for help |
| Supervisor | Teams behind plan; top stop reasons; material variance by order | Which team is off, and whether it is the same cause as yesterday | Rebalance work, fix a recurring cause, escalate what is beyond the workshop |
| Planning | Progress by order against due date; real capacity left | Days of expected delay, not percent done | Resequence orders, warn sales, confirm or move delivery dates |
| Quality control | Defects by type and operation; goods on hold | A defect that returns is a process problem, not bad luck | Hold or release goods, open a corrective action |
| Maintenance | Lost time by reason per machine; repeated breakdowns | Stops that keep rising, not the latest breakdown | Plan maintenance, stock spare parts, propose an overhaul |
| Plant manager | Delivery risk; OEE and loss trends; material variance; cost per order | Trends over weeks and the few exceptions sent up | Priorities, investment, pricing, staffing |
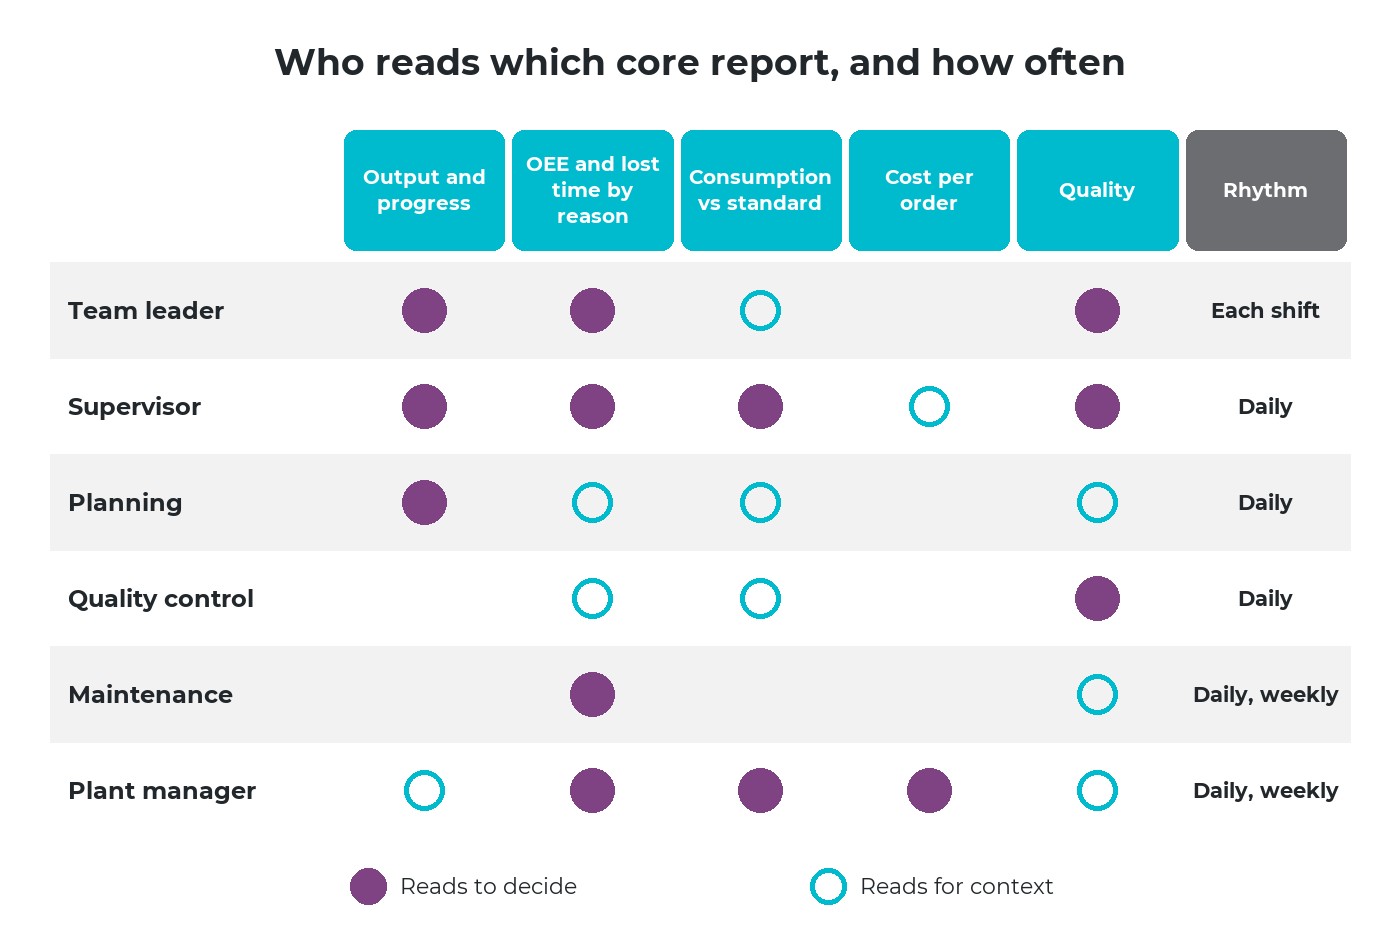
Each role reads a few reports to decide and a few more for context. Nobody needs all of them every day.
Fewer reports for the right people beat many that nobody reads
Every extra report costs time to produce and attention to read. Cutting daily reports to the few that pass the one-sentence test usually improves the data, because people see that what they record is used. The same idea runs through just enough data to manage.
In tiered meetings, a number goes to the lowest tier that can act on it, and a report nobody has used for a month is retired.
Five core reports every plant needs
Most decisions on the floor rest on five reports. All five rest on data recorded where and when the work happens.
1. Output and progress
Question: are we making what the plan says, in time for the due date? Read it per order and per operation, against the plan of the same period. A plant-wide percentage hides the order that is three days behind.
2. OEE and lost time by reason
Overall equipment effectiveness (OEE) combines availability, performance and quality into one figure. The single figure is good for trends; the decisions come from its parts, above all lost time sorted by reason. The article on what OEE is explains the calculation.
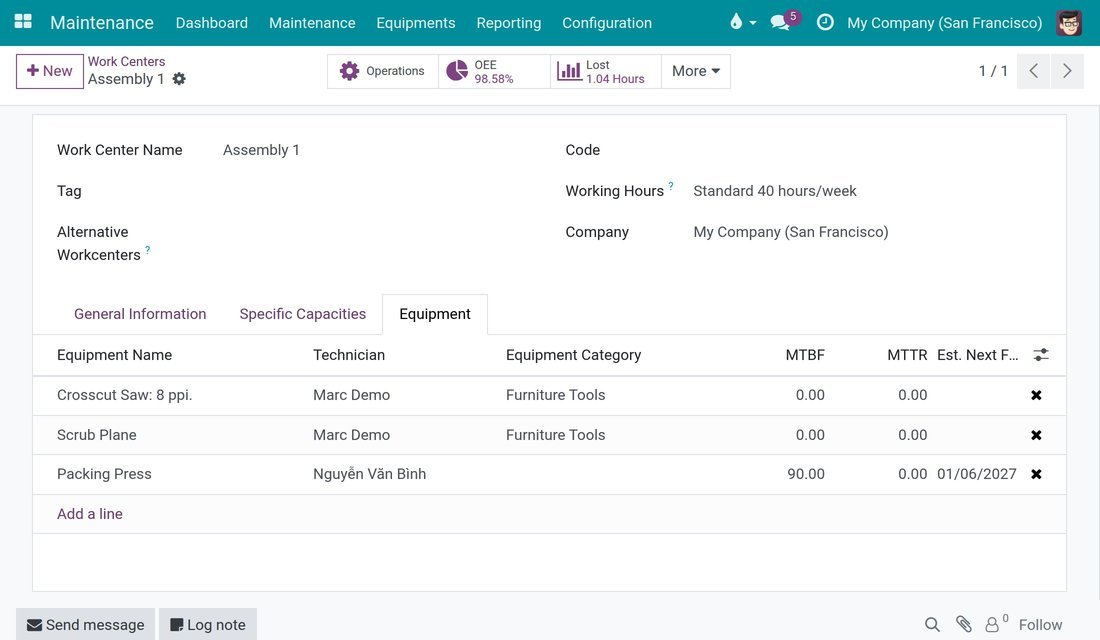
Example: a work center shows its OEE and lost hours for the last month, next to its equipment and their failure history.
For maintenance, breakdowns listed per station as they are reported show which machine needs attention before the monthly figure does.
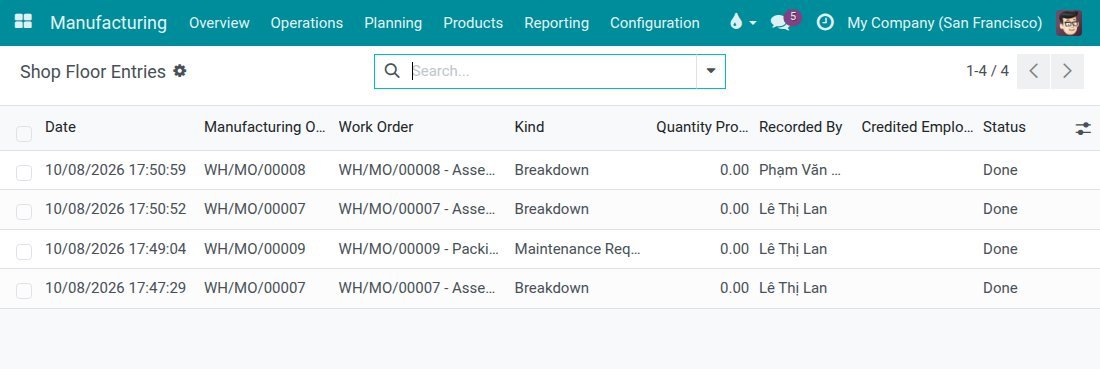
Example: breakdowns reported from the stations appear in the floor log with time, work order and the person who reported them.
3. Material consumption against the standard
Question: did each order use what the bill of materials says, including the expected loss rate? Read the difference per component and per order, not a monthly total. A gap that repeats on the same component points to the standard or the process; a one-off gap points to an event worth asking about. Ways to act on it are in material loss management.
4. Cost per order
Question: what did this order really cost, in materials, labour and overhead? Comparing the actual cost of each order with its estimate shows which products or customers lose money. Read it when an order closes, while the people involved still remember what happened. The elements are covered in how to calculate manufacturing cost.
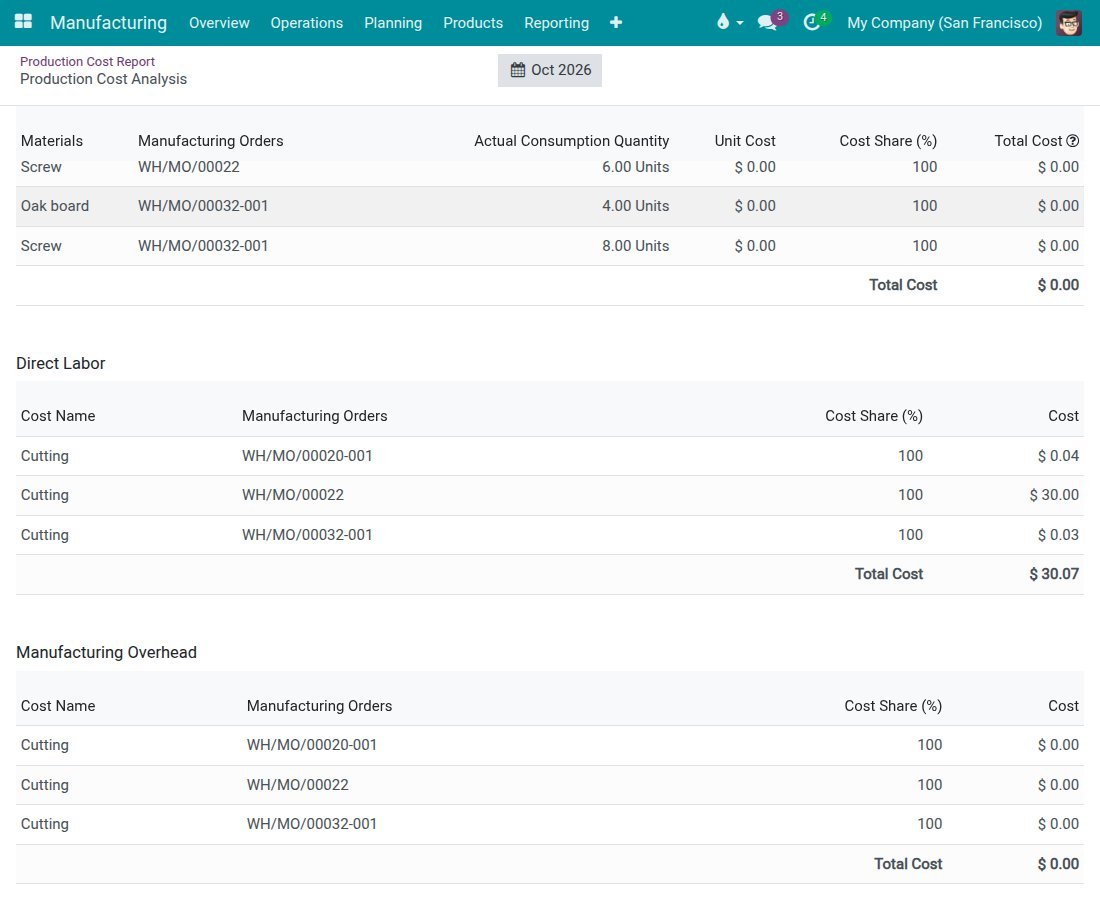
Example: the cost of a manufacturing order split into direct materials, direct labour and manufacturing overhead.
5. Quality
Question: where are defects born, and are they coming back? Read checks and defects by operation and by day. A rising share of failed checks on one operation is an early warning that a monthly defect rate will only confirm later.
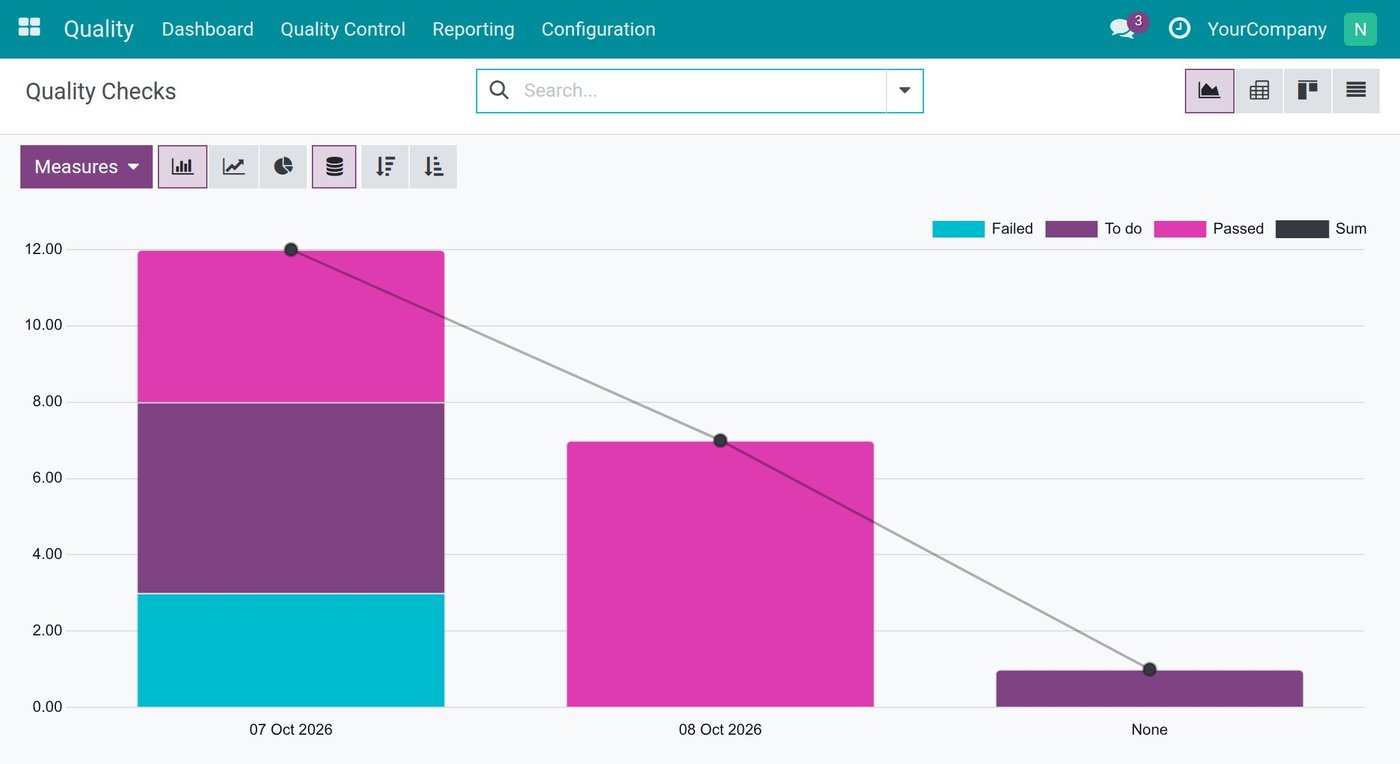
Example: quality checks per day, stacked by result, so a day with many failed checks stands out.
Tiered meetings: short, at the right level, escalated the same day
Reports only work when they are read at a fixed time by people who can act. Tiered meetings give them that time. They are short, held standing near the work, the idea Lean calls going to the gemba, and they run in a fixed order from the floor up.
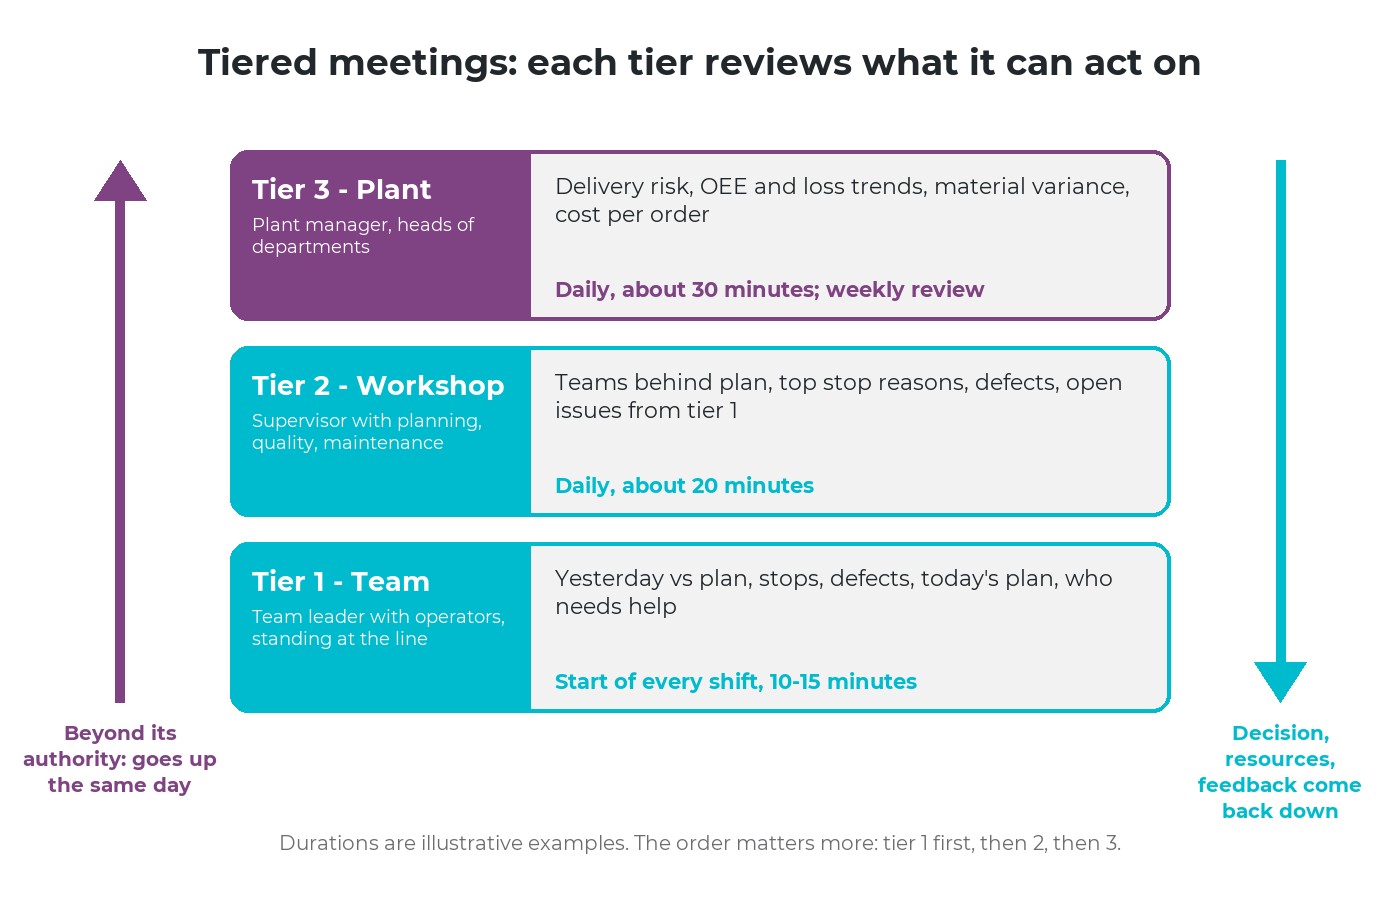
Three tiers meet in sequence each day. Problems beyond a tier's authority go up; decisions and resources come back down.
| Tier | Who | When and how long | Output |
|---|---|---|---|
| 1 - Team | Team leader and operators | Start of each shift, 10-15 minutes (illustrative example) | Today's plan confirmed, help requested, open issues listed |
| 2 - Workshop | Supervisor, team leaders, planning, quality, maintenance | After the team meetings, about 20 minutes | Issues from tier 1 assigned or solved, the rest escalated |
| 3 - Plant | Plant manager and department heads | Late morning, about 30 minutes | Decisions on priorities and resources sent back down |
The order matters more than the minutes. When the team meeting comes first, the workshop meeting deals with real issues from the floor, and the plant meeting deals with what the workshop could not solve. Each tier looks only at the numbers it can act on, which is why the meetings stay short.
Escalate within the day
A tiered management rhythm needs a clear rule for escalation: what a team leader can decide alone, what needs the supervisor, what needs the plant manager. Typical triggers are a long stop, a defect that may reach the customer, a shortage that blocks an order, a due date at risk. A problem that crosses that line goes up the same day, with an owner and a deadline, and the answer comes back down before the next shift.
Closing the loop keeps people reporting: a team leader who hears back what was decided raises the next issue earlier. Each meeting is a small turn of the PDCA cycle: look at yesterday, decide, act, check again tomorrow.
What a start-of-shift board should show
The first tier of tiered meetings runs on one board, on paper, a whiteboard or a screen. Its job is to let the team see in five minutes how yesterday went and what today needs. Six boxes are usually enough:
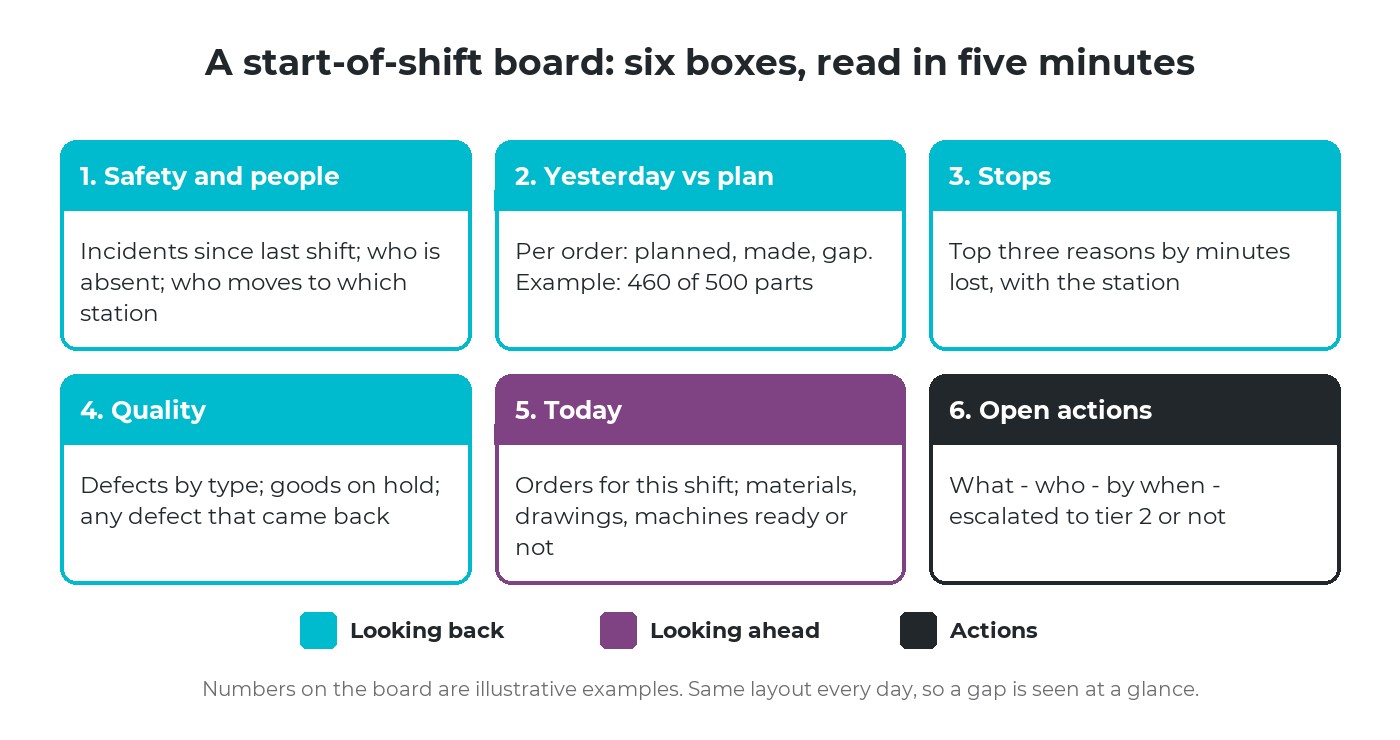
Four boxes look back, one looks ahead, one tracks actions. The layout stays the same every day so a gap stands out at a glance.
- Numbers are ready before the meeting. Yesterday's figures come from entries made during the shift, not from adding up sheets in the meeting.
- Talk about actions, not numbers. The board shows the gap; the meeting decides who does what about it.
- Every open action has a name and a date. Items without an owner are the ones that come back next week.
- Mark what was escalated. The team should see which issue went to the workshop and when an answer is expected.
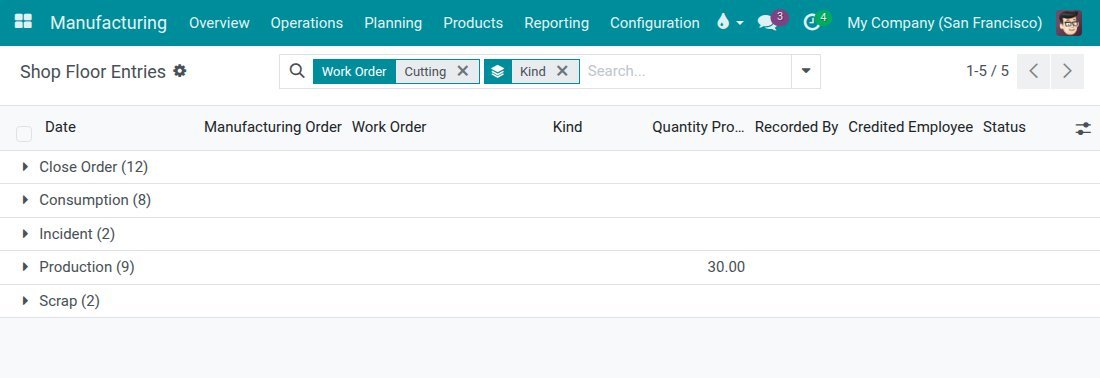
Example: entries recorded during the shift, grouped by kind, give the board its figures for output, incidents and scrap without anyone adding them up by hand.
Technology for tiered meetings, in three levels
Level 1 - Digitize the floor entries
Output, stops, scrap and checks are recorded at the station as they happen. The board and the reports read from these entries instead of from end-of-shift sheets.
Level 2 - Connect the machines
Machine signals give exact run and stop times and counts. Useful when short stops matter and manual records can no longer keep up.
Level 3 - Analyse and alert
Trends across weeks, comparisons between lines, alerts when a number crosses its threshold. Worth it once the first two levels give clean, regular data.
Master level 1 and a steady rhythm of tiered meetings before buying screens or sensors. A screen does not create the habit of meeting every day; the habit makes the screen worth having.
Six questions to assess your tiered meetings
The one-sentence test
For each daily report, can you say who reads it, when, and to decide what?
Timing
Do team leaders see yesterday's figures before the shift starts, or only later in the day?
Order of meetings
Do team meetings happen before the workshop meeting, and the workshop before the plant?
Escalation
Is there a written rule for what goes up, and does it go up the same day?
Lost time
Can you name the three reasons that cost the most machine hours last week?
Feedback
When a team leader raises an issue, do they hear back what was decided?
How Viindoo supports tiered meetings
Viindoo does not run the meetings; it supplies the numbers they need from entries made on the Shop Floor tablet. Every analysis opens as a pivot table or a chart, filtered by work center, order or period. What is available and what is not:
| Need | In Viindoo |
|---|---|
| Floor log for the shift | Available: every entry made on the floor (output, consumption, scrap, incident, order closing) with time, work order and the person credited |
| OEE and lost time | Available per work center, from recorded time over the last month, with lost time by reason. The OEE figure is productive time over all recorded time, with every loss counted together; it does not yet split availability, performance and quality |
| Material variance and cost | Available: consumption against the bill of materials and its loss rate, per component and order; cost per manufacturing order split into materials, labour and overhead |
| Floor displays and meetings | Not available: no Andon board and no module for running start-of-shift meetings |
Frequently asked questions
Usually 10 to 15 minutes (illustrative example), standing, at the same time and place every day. If it regularly runs longer, the board shows too much or problems are being solved in the meeting instead of being given an owner.
Not to start. A printed sheet or a whiteboard works if the numbers are ready before the meeting. A screen helps later, once the rhythm is stable and the data is recorded at the station.
Pick one workshop. Agree on the six boxes of the board and the escalation rule, run the team and workshop meetings every day for a month, and remove any number nobody used. Add the plant tier once the first two are steady.
Want to see how your plant's numbers reach the people who decide? Book a shop floor assessment with Viindoo: we sit in on a few of your meetings and trace each number back to where it is recorded, before talking about software.
Next in the series: operators and skills, keeping know-how on the shop floor.
Related articles