Production progress tracking looks simple: every order gets a percentage, and the percentage should tell you whether it will ship on time. On many floors it does not. The report says an order is at 60%, and the delivery is still late.
The signs are familiar. Every order is "in progress", nobody can say which operation is holding it up, and when a rush order is accepted, two other orders slip without anyone deciding they should.
These are symptoms of the information gap described in shop floor management. This article looks at three questions: what a progress percentage actually measures, how to find the operation that is late, and how to handle a rush order without breaking every other promise.
60% progress: 60% of what?
A percentage always has a numerator and a denominator. Three common choices give three different answers for the same order, and each answer describes a different thing.
| Method | What it says | Where it misleads |
|---|---|---|
| By output: units made / units required | How much of the product exists | It depends on where you count. Counted at the first operation, it runs ahead of reality; counted at the last, it sits at zero for days, then jumps. |
| By labour hours: hours used / hours planned | How much effort has been spent | Hours spent are not work done. Rework, slow machines and waiting at the station all push the number up without adding a single good unit. It can pass 100% while the order is unfinished. |
| By operations completed: finished / total | Where the order is on its route | Operations are not equal. A two-hour painting step and a twenty-hour machining step each count as one. |
Take an order of 500 units through cutting, welding, painting and packing (illustrative example). Cutting is finished, welding has done 400 units, painting and packing have not started. By labour hours the order is at 60%. By operations it is at 25%. By finished output it is at 0%. None of the three is wrong; they answer different questions.
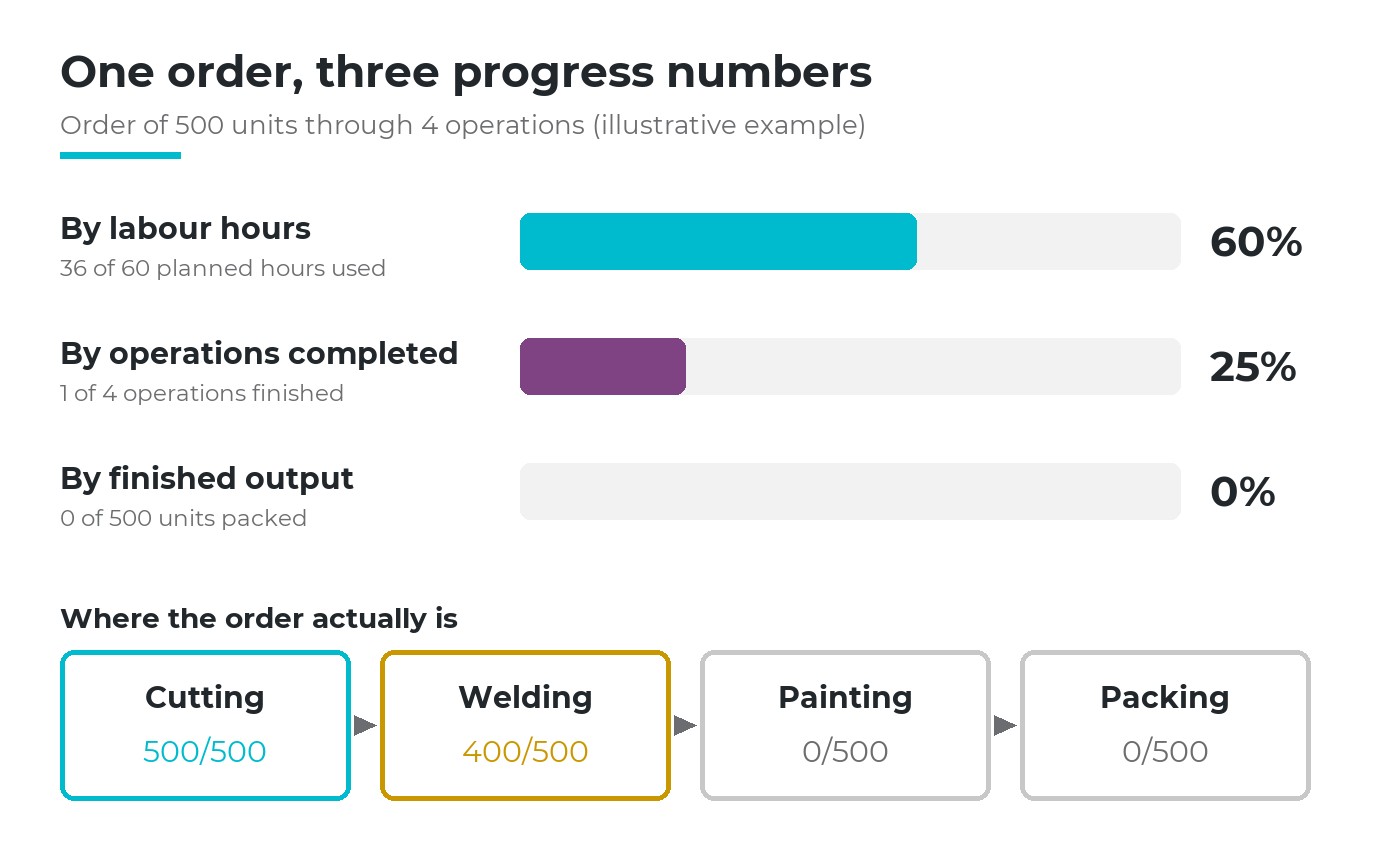
One order, three progress numbers: by labour hours, by operations completed and by finished output (illustrative example).
Two numbers side by side, not one
Good production progress tracking does not pick the "right" formula. It reads output and time together. Good output at each operation says how far the order has really gone. Hours used against hours planned says what it cost to get there.
When time runs ahead of output, something is eating hours: rework, stops, a slow machine. When output runs ahead of time, the planned times are probably too loose and the plan has more room than it shows. Either signal is worth more than a single percentage.
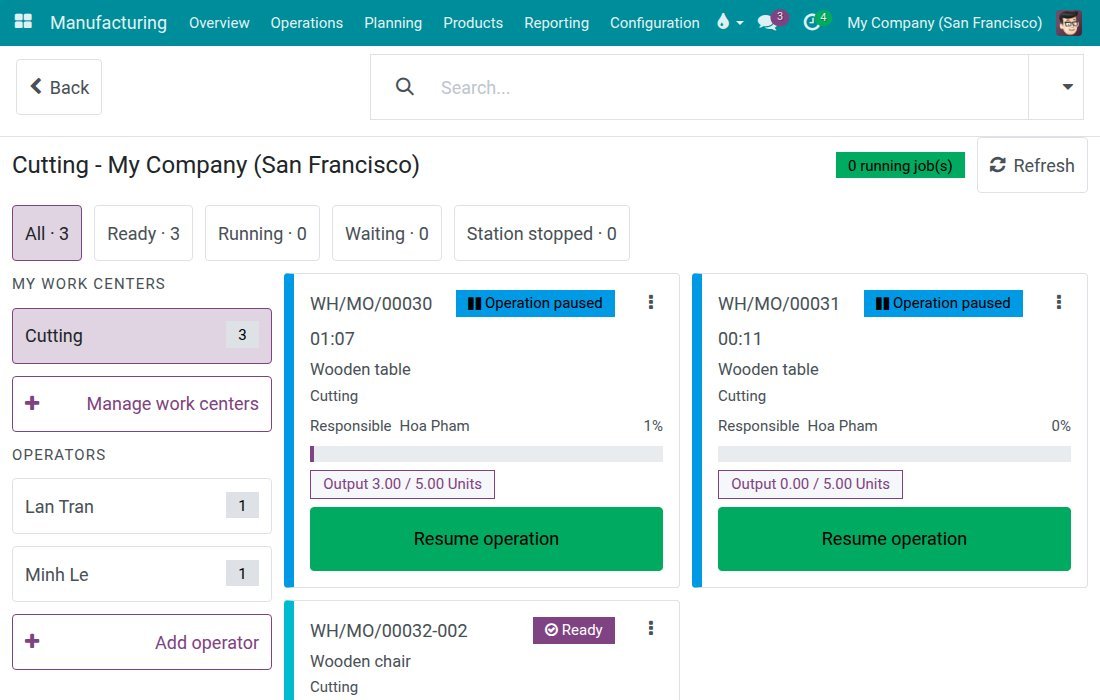
Example: on the same work order card, the progress bar counts time worked against expected time, while the output line shows 3 of 5 units recorded. Two numbers, two stories.
Two rules keep both numbers honest. Count only good units, not everything that passed through. And record at the moment the work is done, not at the end of the shift. Progress is only as fresh as the last entry, which is why the aim is just enough data to manage, recorded on time.
Production progress tracking by operation: where is the delay?
An order-level percentage hides the place where time is lost. Delays rarely spread evenly across the route. They pile up in front of one operation, the bottleneck, while the operations after it wait for work. The theory of constraints puts it plainly: the output of the whole line is set by its slowest step.
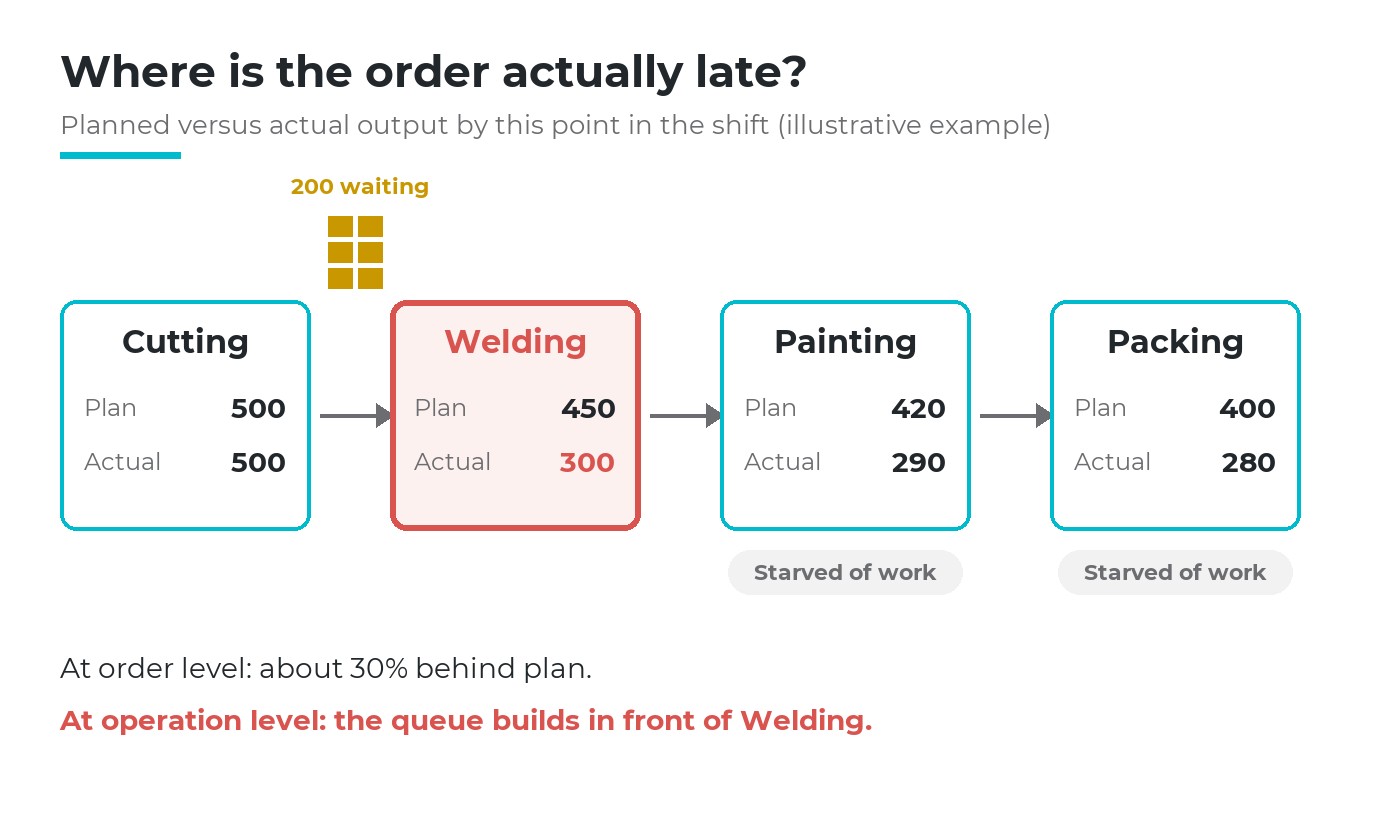
At order level the order is 30% behind. Per operation, the queue builds in front of welding while painting and packing are starved (illustrative example).
The tell-tale signs are physical before they are digital: a stack of half-finished parts in front of one station, people downstream waiting, one area always working overtime. Much of an order's lead time is spent waiting between operations rather than being worked on, as discussed in the production cycle.
Knowing where is half the answer. The other half is why, because each kind of delay needs a different response:
- Started late: the operation waited for materials, tools or the previous step. The fix lies in preparation, the subject of the previous article on production readiness.
- Running slow: the operation runs, but below its standard rate. Look at the method, the machine settings or the standard itself.
- Stopped: breakdowns, missing people, waiting for quality approval. Every stop needs a recorded reason, or the same stop will happen again next week.
To tell these apart, each operation needs three facts recorded at the station: when it started and finished, how many good units it produced, and why it stopped if it did.
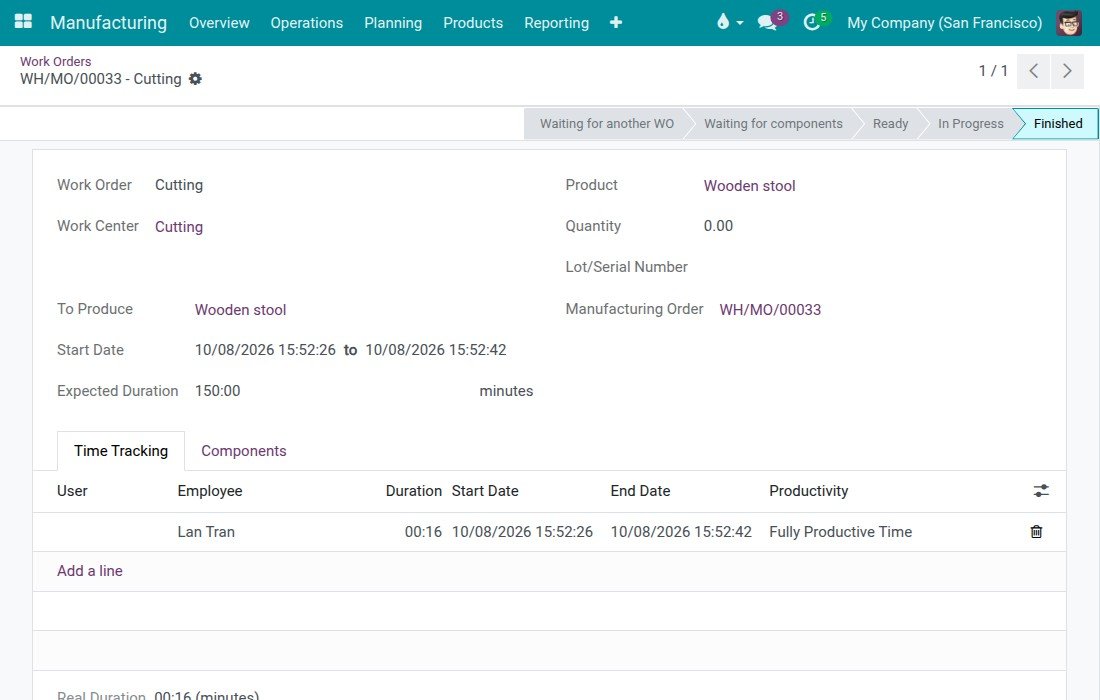
Example: a work order keeps its expected duration and every actual time entry, with who did it and when, so time can be compared operation by operation.
Visual management: let the deviation show itself
Visual management (one of the principles in the pillar article) means a deviation becomes visible without anyone having to ask or compile a report. In production progress tracking, that only works when the board shows actual against what should have happened by now, not just what has happened.
Compare with the plan at this hour
"300 done" means nothing alone. "300 done, 450 expected by now" is a signal anyone can read.
Clear colour thresholds
The supervisor decides in advance what counts as on track, at risk and late. Colour replaces debate.
The right view for each tier
Team leaders watch their stations, supervisors their lines, the plant manager the orders at risk of shipping late.
Fed by the work itself
The board updates from what operators record as they work. Nobody is assigned to copy numbers onto it.
A whiteboard that follows these rules works well for one line. With several lines or shifts, updating it by hand becomes a job in itself and the board lags. That is when a digital board pays off, letting a business see the flow of work without extra effort.
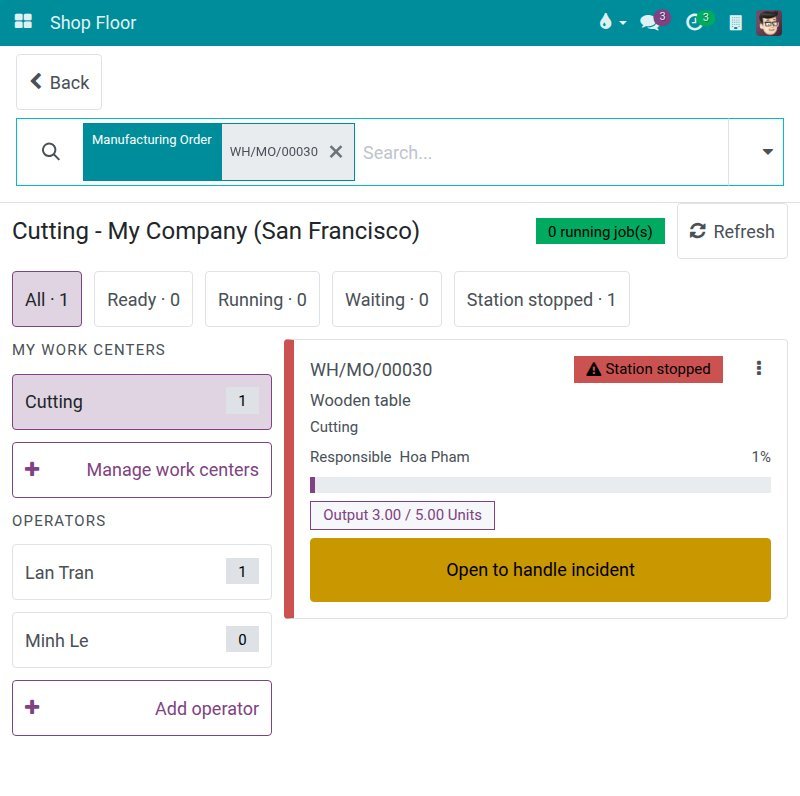
Example: a stopped station is filed under its own tab and marked in red, with the output already recorded, so nobody has to ask where the problem is.
A rush order: look at each area's load before promising a date
Accepting a rush order does not create capacity. It moves other orders back. The real question is never "can we squeeze it in?" but "which orders will move, by how much, and who will tell those customers?"
Here production progress tracking turns forward-looking. A common mistake is to look at the plant as a whole. The plant may have spare hours this week, while the one area the rush order must pass through is already full. The delivery date is set by the most loaded area on the order's route, the same logic as capacity planning.
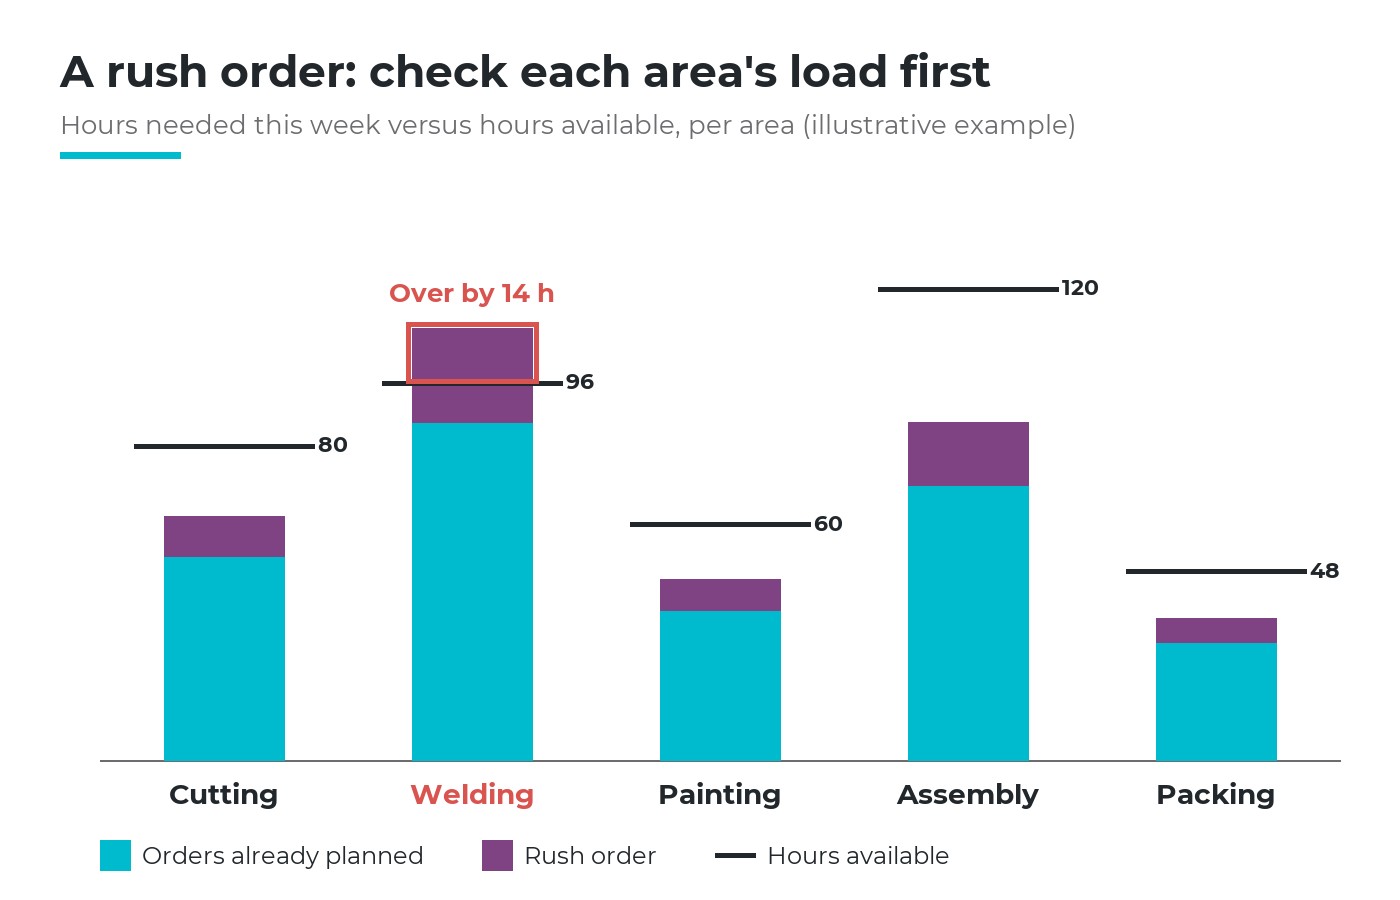
Hours needed this week against hours available. The plant has room overall, but welding goes 14 hours over (illustrative example).
Trace the route
List the areas the rush order passes through, from its bill of materials and routing.
Check each area's load
Hours already booked against hours available, week by week, for each of those areas.
Find the tightest area
That area sets the earliest realistic date. Add overtime or a second shift there, not elsewhere.
Decide who gives way
Choose the orders that move, tell their customers, then update the schedule and the floor.
The last step is a business decision, not a calculation: which customer matters more, which penalty is cheaper, which relationship can absorb a delay. Production scheduling can show the consequences; it cannot weigh them for you.
A rush order is not a capacity problem. It is a priority decision that must be made explicitly, before the promise, not discovered on the floor after it.
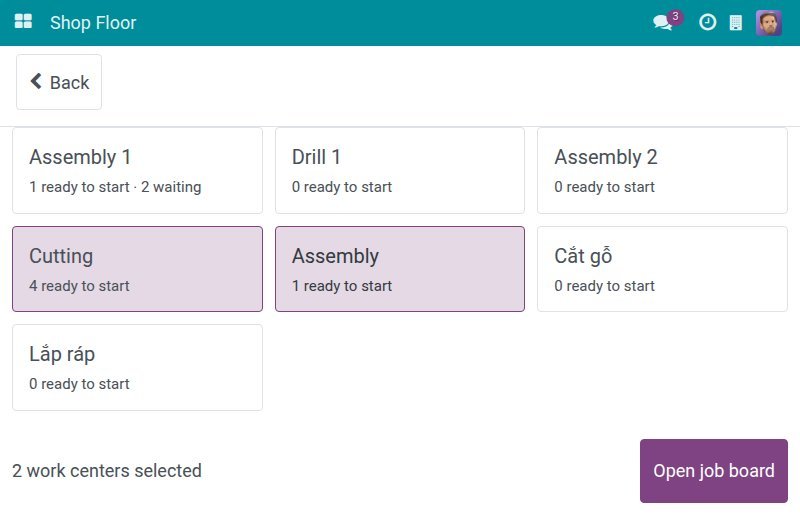
Example: each work center shows how many jobs are ready to start and how many are waiting, a quick view of where work is queuing.
If rush orders arrive every week, the problem is keeping room for urgent demand, which belongs in the master production schedule, not in daily firefighting.
Technology for production progress tracking, in three levels
Level 1 - Record at the station
Start, finish, good output and stop reasons entered by the operator in a few taps. This alone answers "where is the delay".
Level 2 - Count from machines
Counters, scales and sensors feed output and run time directly, tied to the right work order.
Level 3 - Forecast and suggest
Warn which orders risk shipping late and suggest schedule changes, based on accumulated data.
Most floors get the largest gain from level 1, because it turns "in progress" into facts per operation. Move to level 2 when manual counting becomes the bottleneck itself, as on high-speed lines.
Level 3, including automatic rescheduling tools (APS, advanced planning and scheduling), depends on reliable standard times. If the planned hours for each operation are wrong, an automatic schedule is simply wrong faster. Production progress tracking at level 1 is also how those standard times get corrected, a point also made in tracking production progress with software.
Six questions to assess your production progress tracking
The percentage
When your report says 60%, does everyone agree on what it is 60% of?
Where you count
Is output counted at each operation, or only at the end of the line?
Locating delays
For a late order, can you name the operation that held it up within minutes?
Reasons
Do you know whether it started late, ran slow or stopped, and why?
Seeing the deviation
Can a supervisor walking past see which station is behind plan right now?
Rush orders
Before accepting a rush order, does anyone check the load of the areas it will pass through?
Two or more "no" answers point to the same starting point for production progress tracking: recording output and time per operation, at the station.
How Viindoo supports this
In Viindoo, production progress tracking reads what is recorded on the floor, not a separate report. What it shows for each question in this article:
| Question | What Viindoo shows |
|---|---|
| How far is the order? | Progress of each manufacturing order by quantity produced against quantity required, with the deadline marked when it has passed and a flag when components are short |
| Which operation is late? | On the Shop Floor screen, each work order card shows time worked against expected time beside the output recorded; stopped stations are filed apart |
| Can we take the rush order? | Weekly load of each work center against its working hours, and a Gantt chart of work orders by work center where the planner drags to reschedule |
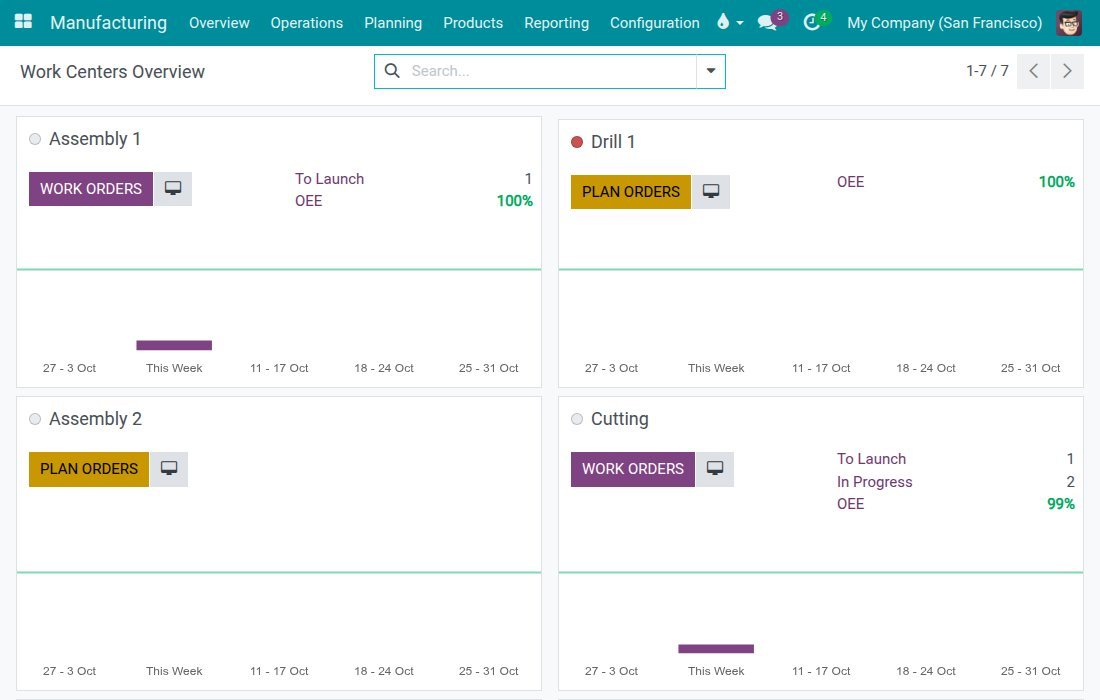
Example: the work center overview shows jobs to launch, jobs in progress and a weekly load chart for each area.
Viindoo does not reschedule automatically when a rush order arrives. It shows the load and lets the planner move work on the Gantt chart; deciding which order gives way stays with people, where it belongs.
Frequently asked questions
As often as someone can act on it. Recording at the end of each job at the station is usually enough.
The operation has taken longer than its standard. Look at the recorded stops and rework first. If neither explains it, the standard time itself may be wrong and should be revised.
Yes. Measure by operation with estimated hours. Estimates will be rough at first, but comparing them with actual time over a few orders makes them noticeably better.
Not sure what your progress numbers really measure? Book a shop floor assessment with Viindoo: we follow one late order through its operations with you and find where the time went, before discussing any software.
Next in the series: Machine stops and incidents: closing the loop right on the shop floor.