In Kaizen, one of the most important principles is to see the problem, and first of all the flow of work, before trying to improve anything.
In the first article of this series, we saw that Kaizen needs facts and digitalization produces them. But in practice, especially in small and medium-sized businesses, many operational problems remain invisible. Orders keep moving, people keep working, machines keep running and goods still get delivered, yet the business does not know exactly:
- Where is the order getting delayed?
- Which stage creates the longest waiting time?
- Which materials are often short?
- Why do products have to be reworked?
- Why does the same product take a different time to finish each time?
- Where is the actual cost exceeding the standard?
This is exactly where digitalization can directly support Kaizen.
Digitalization turns ongoing activities into a stream of data that can be observed, measured and analyzed.
Once the flow becomes clear, the business has a basis to pinpoint exactly where to improve.
Kaizen needs to see the flow of work, not only the results
In traditional management, the final results are usually quite visible: revenue, orders delivered and not yet delivered, stock on hand, monthly output and profit at the end of the period. But these figures mainly answer one question:
What happened?
Kaizen has to go further and answer:
Why did it happen?
For example, if an order is delivered 7 days late, "7 days late" is only the result. The business needs to know where those 7 days were lost: in engineering, in the BOM, in purchasing, waiting for raw materials, in production or in quality inspection. Without seeing the flow of work, it is very easy to improve the wrong place.
Digitalization creates a continuous stream of data
Take a mechanical company that manufactures to order. Its operations may look like this:
Sales → Engineering/BOM → Purchasing → Warehouse → Production → Quality control → Delivery
Before digitalization, each stage may use a different tool:
- Sales uses Excel.
- Engineering keeps the BOM in files.
- Purchasing works through email or Zalo.
- The warehouse records in Excel or on paper slips.
- The workshop tracks progress on a board.
- QC uses its own checklist.
- Accounting consolidates figures at the end of the period.
Every department has data, but the data does not form one continuous stream. This leads to a very common problem:
The business has plenty of data but no end-to-end picture of the flow of work.
Done right, digitalization links these scattered points together.
1. Seeing where each order is
This is the most basic layer of visibility. Leaders need to know whether the order has been confirmed, whether the BOM is ready, whether materials are sufficient, whether the manufacturing order has been released, which stage it is at, whether QC is done and whether it is ready to ship.
Before, finding this out could mean calling people, asking each department, messaging groups or opening several files. When data is digitalized and connected, the status of an order can be followed across the system. In Viindoo, a sales order links directly to its manufacturing orders, purchase orders and deliveries, and the Manufacturing Progress Management app shows how far each manufacturing order has progressed against its plan.
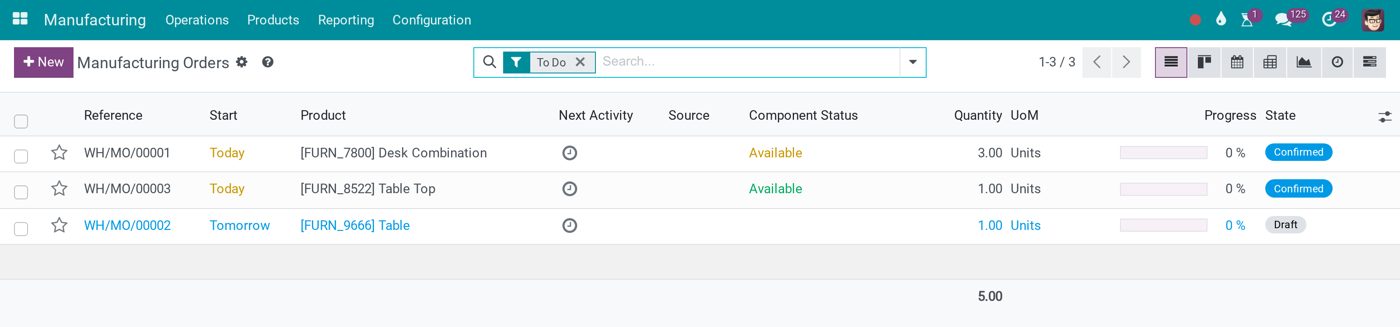
Manufacturing orders with component status and progress, so the flow of work is visible at a glance.
This is the first value of digitalization for Kaizen:
Visibility: the ability to see the flow of work.
2. Seeing waiting time
In many businesses, most of the lead time is not time spent actually making the product. It is time spent waiting: for approval, for materials, for a machine, for the previous operation, for QC or for delivery. These periods are hard to see unless the business records when each document changes status.
For example (as an illustration), an order is confirmed on day 1, the BOM is designed and approved by day 3, materials take 7 days to purchase and arrive on day 10, goods are received into stock by day 12, production takes 5 days until day 17, quality inspection takes 3 days and the order is delivered on day 22.
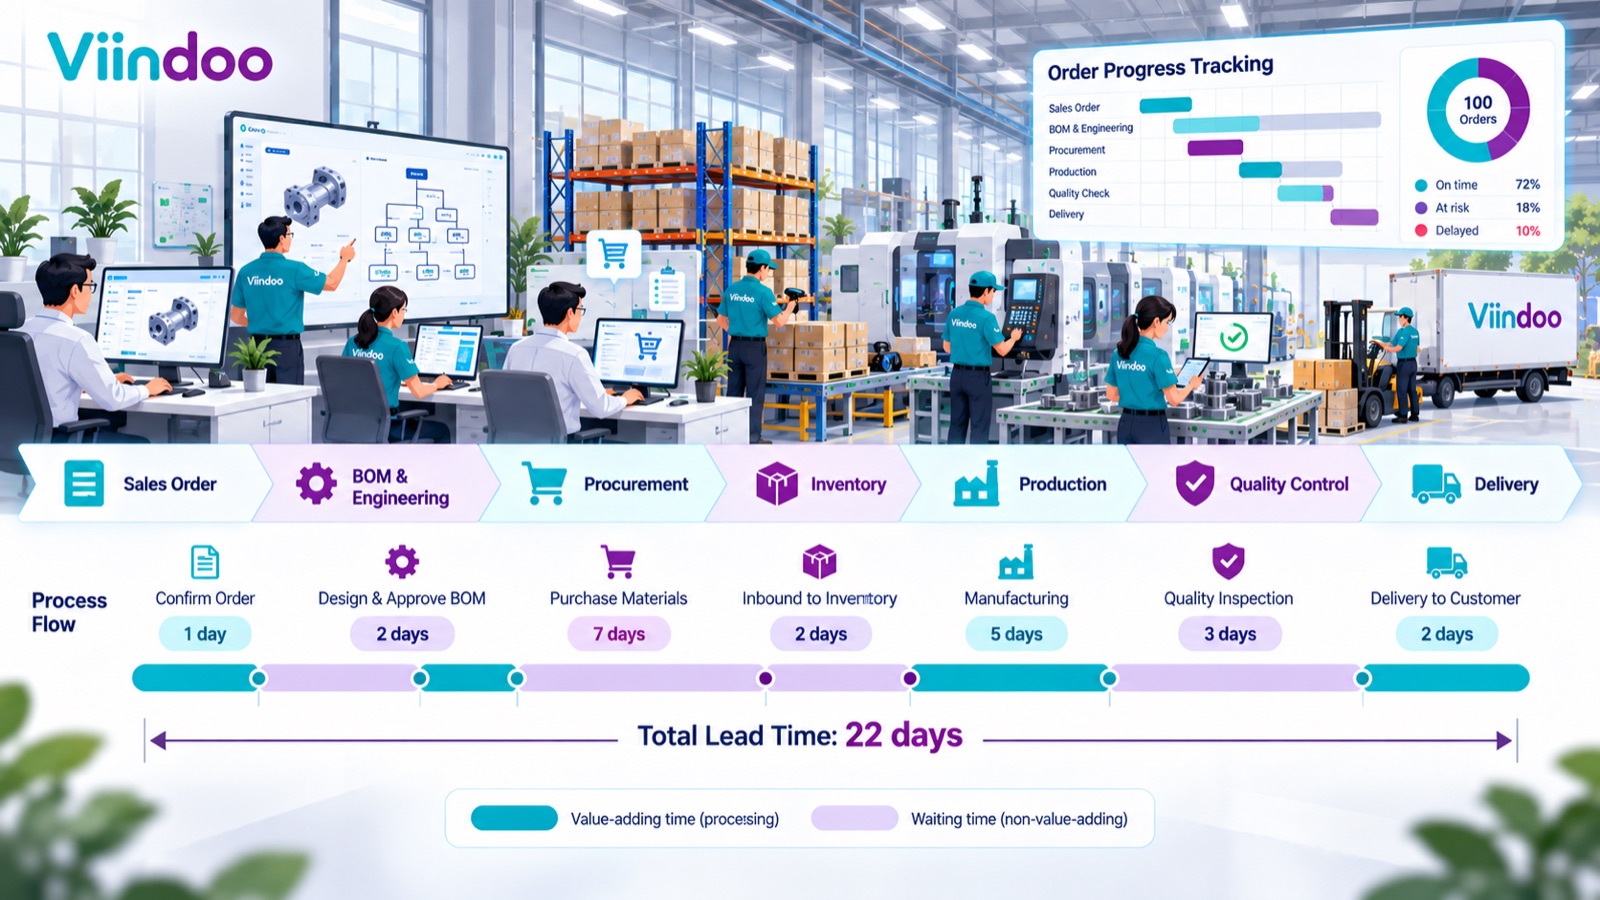
One order from start to finish: 22 days of lead time, of which 7 days are spent purchasing materials.
Looking at this stream of data, the business can see that:
7 days waiting for materials is longer than the entire 5 days of production.
Without data, a familiar situation happens: the workshop is pushed to raise productivity, while the real cause lies in purchasing or inventory. That is a typical case of Kaizen in the wrong place.
In Viindoo, the milestones needed for this analysis are already recorded: the confirmation date of sales and purchase orders, the completion date of receipts and deliveries, the start and end of manufacturing orders and work orders, together with a status history on each document. A breakdown of lead time by stage like the example above, however, is a consolidated report that the business defines and sets up during implementation, rather than a screen available out of the box.
3. Seeing the bottleneck
A bottleneck is the point that limits the overall flow. It can be a machine, an operation, a department, an approval step or even one person. Imagine five operations: Cutting → Machining → Welding → Painting → Assembly. If each day cutting handles 100 products, machining 90, welding 90, painting only 50 and assembly 80, painting is likely to become the bottleneck.
In reality, bottlenecks are not always that obvious. Sometimes machine capacity is enough, but materials arrive unevenly, plans are unstable, orders keep changing or waiting for approval leaves the machine starved of work. Data helps the business not only see the bottleneck, but also trace back its causes.
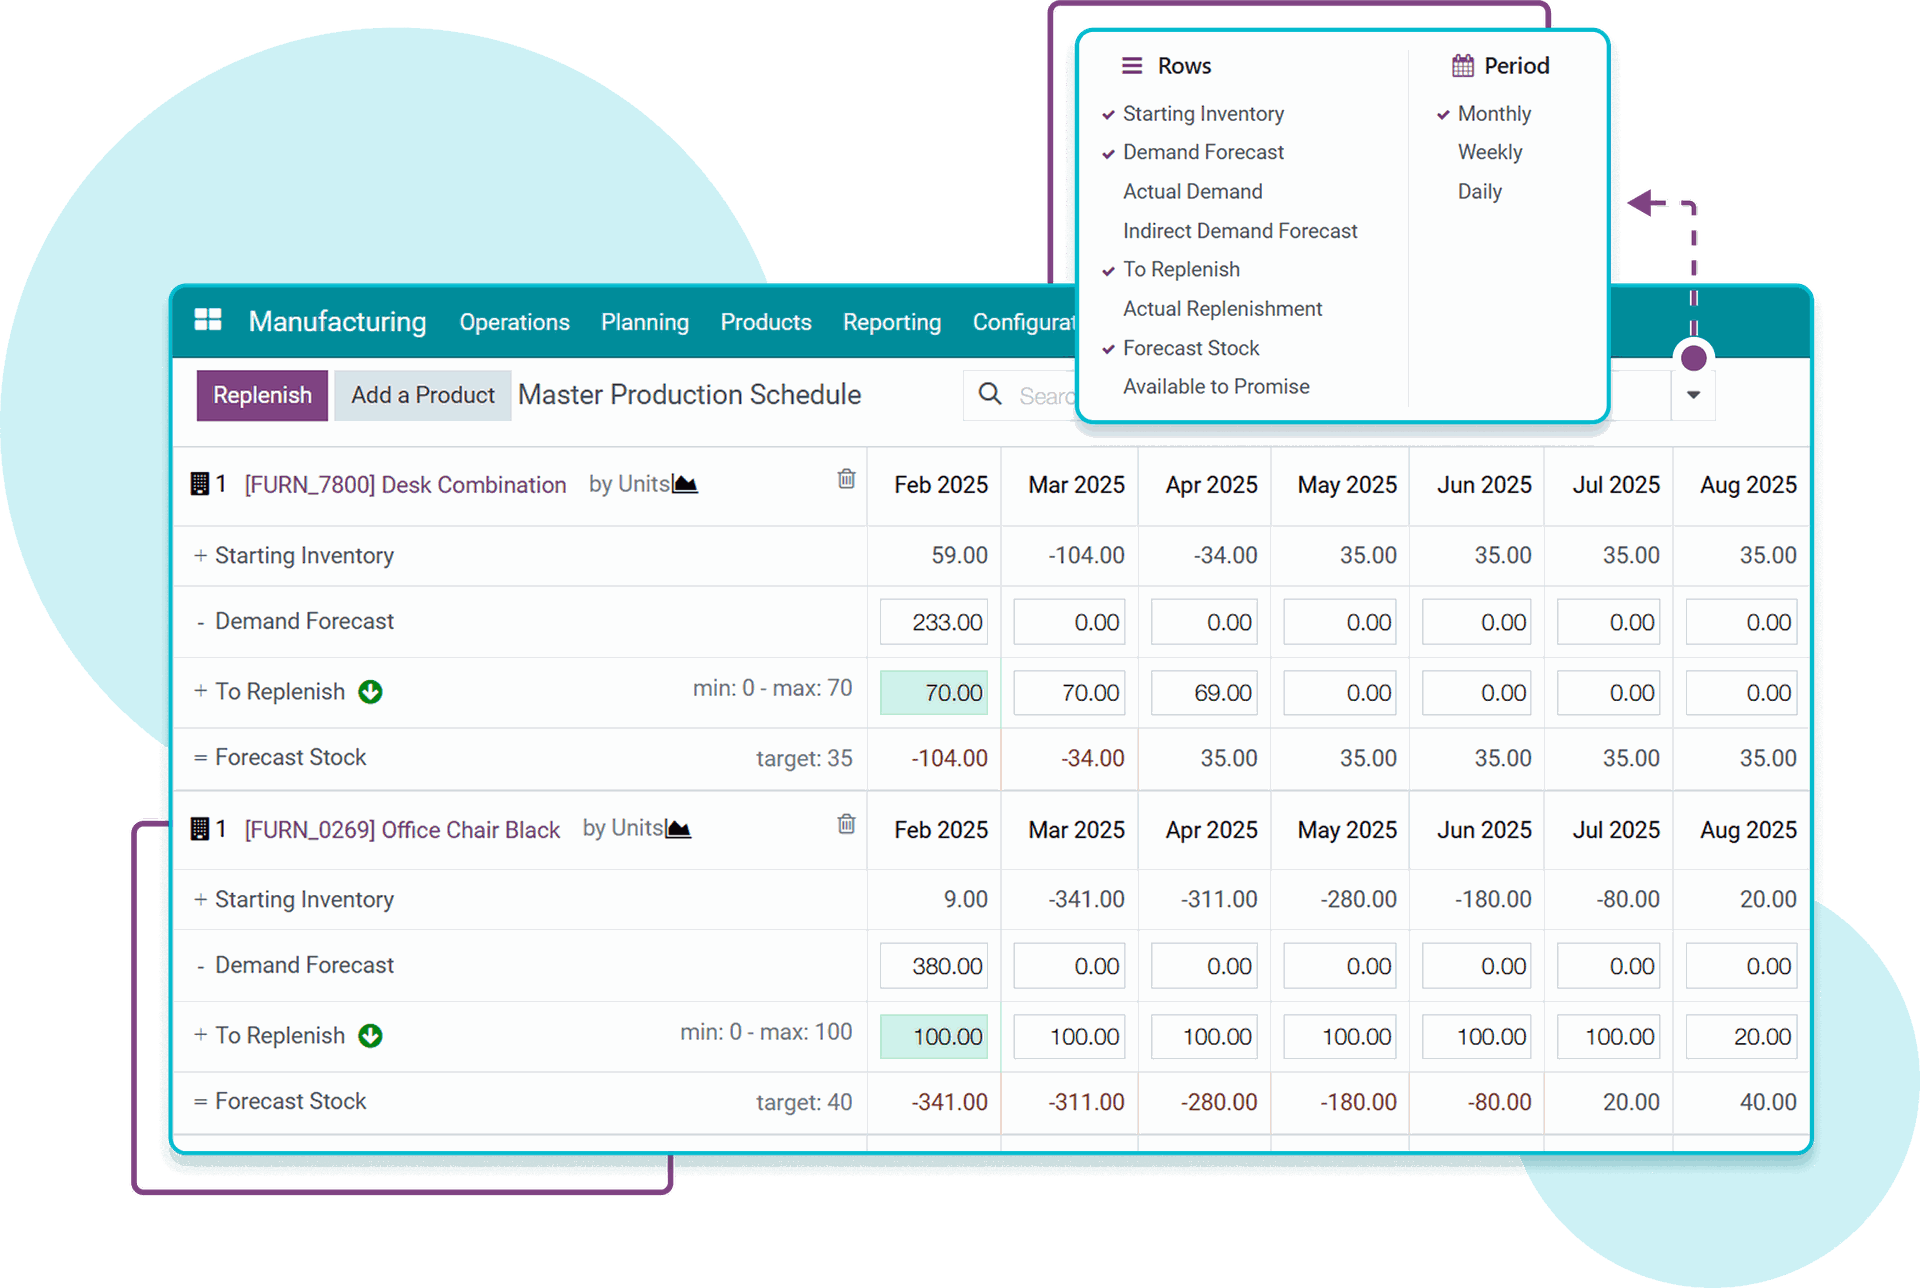
A Master Production Schedule shows demand, replenishment and forecast stock by period, so unstable plans become visible.
In Viindoo, each work center shows its load, its lost time and its overall equipment effectiveness (OEE), and each work order compares real duration with expected duration.
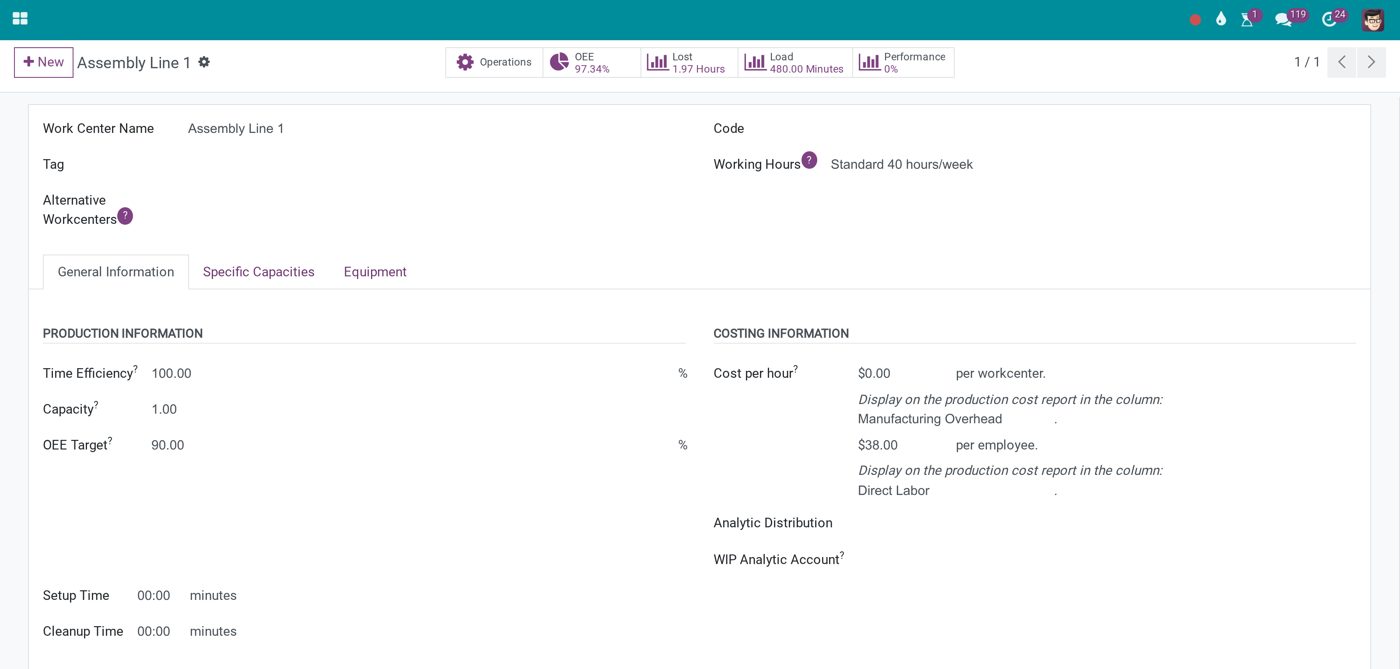
A work center in Viindoo with OEE, lost time, load and performance indicators.
4. Seeing the gap between plan and reality
Kaizen needs a standard to compare against. With a standard, deviations become visible. For example (as an illustration), the material standard is 100 kg but 112 kg are actually used, a deviation of +12%. Or the standard time is 4 hours but the actual time is 6 hours, a deviation of +50%.
These deviations are the signals to start improving. The business can ask: why did material usage increase? Is it loss, design, operator error, rework, or was the original standard wrong? If it only knows the total cost at the end of the month, tracing back is very hard.
In Viindoo, the Manufacturing Standard Consumption Analysis app compares actual material consumption with the BOM standard for each manufacturing order, and work orders compare actual with expected duration.
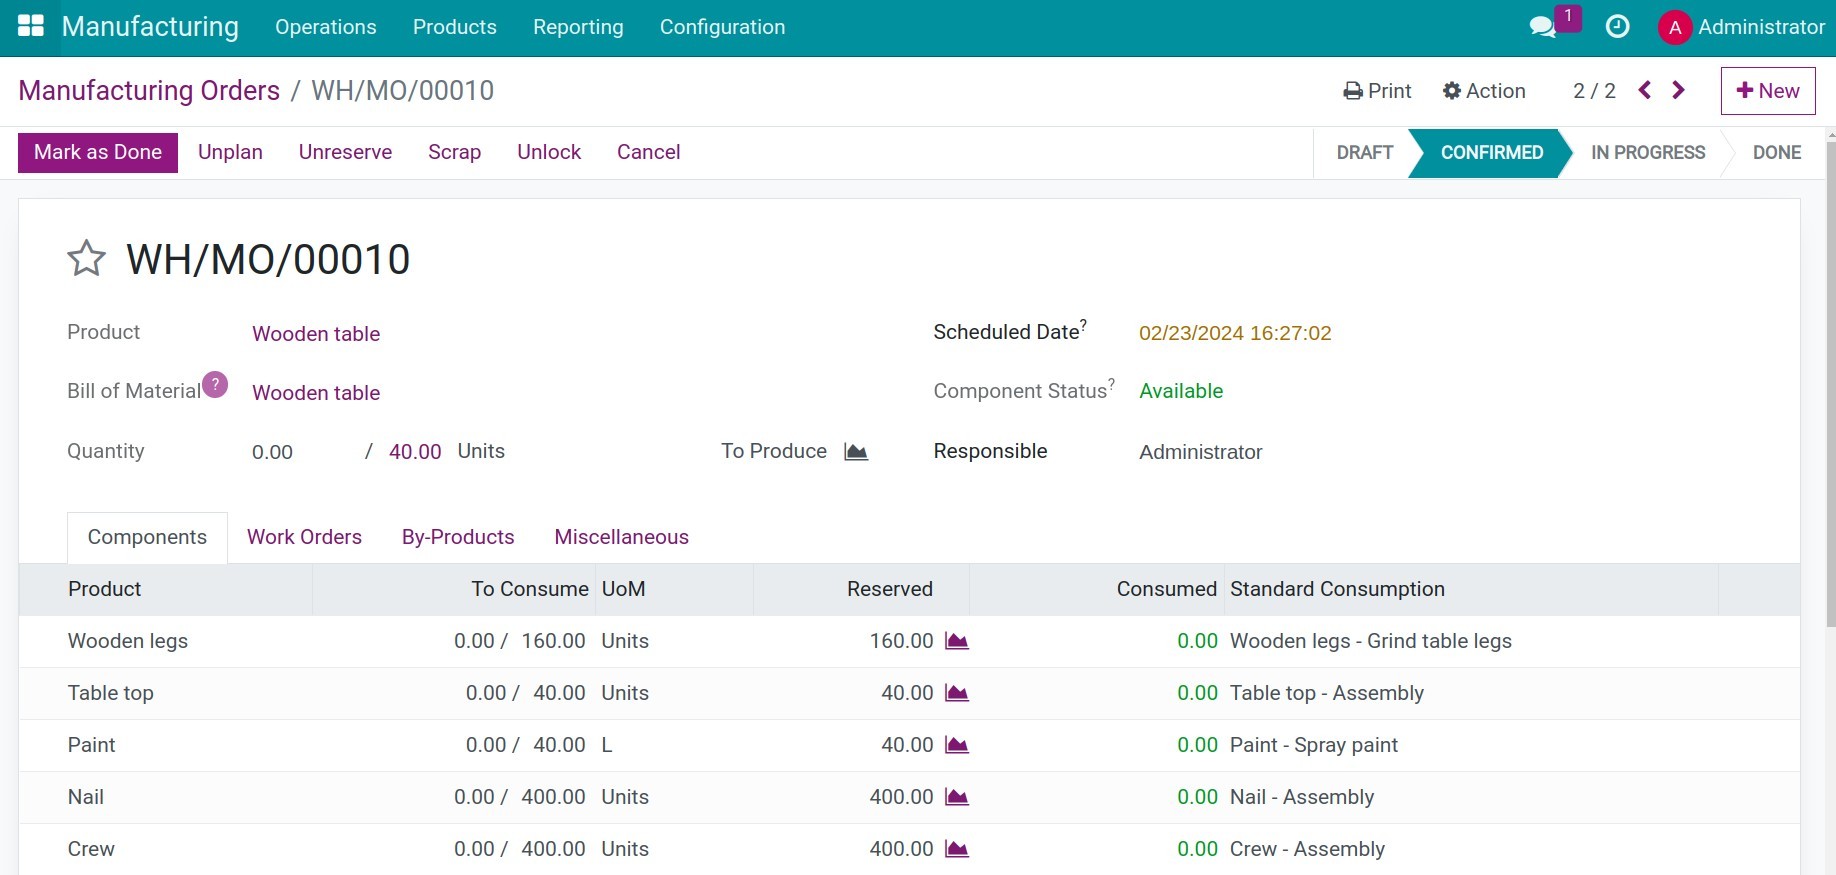
A manufacturing order shows the quantity to consume and consumed, next to the standard consumption of each operation.
5. Seeing defects and rework
One of the biggest forms of waste in manufacturing is defects and rework. If the business does not clearly record where a defect occurs, what type it is, its cause, who handled it and how long the fix took, defects get fixed but never turn into data for improvement.
In Viindoo, the Quality app records each problem as a quality alert with its root cause, responsible team, priority, and corrective and preventive actions, linked to the product and, when used with manufacturing, to the work order. Quality reports can then be grouped by root cause. Scrapped or repaired products are recorded through scrap and repair documents, so the cost of defects can also be traced.
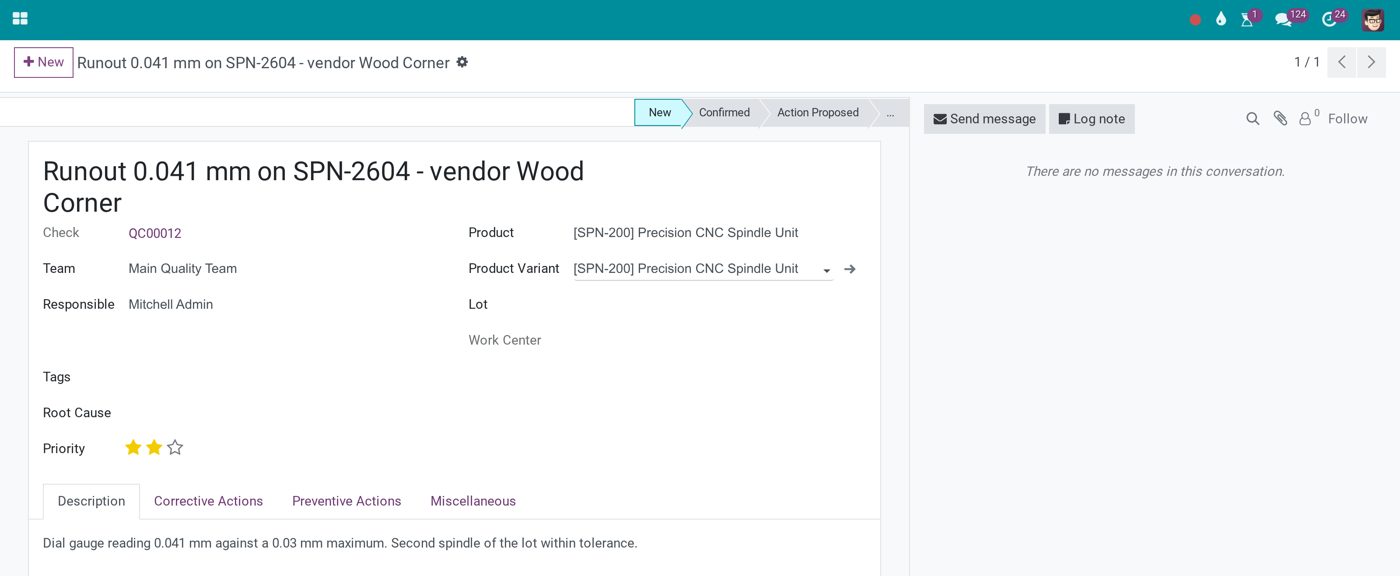
A quality alert records the root cause, priority, and corrective and preventive actions.
From there, the business can analyze which defects occur most, which operations produce them most often, which products have a high scrap or rework rate, and which defects cost the most. This is a key foundation for quality Kaizen.
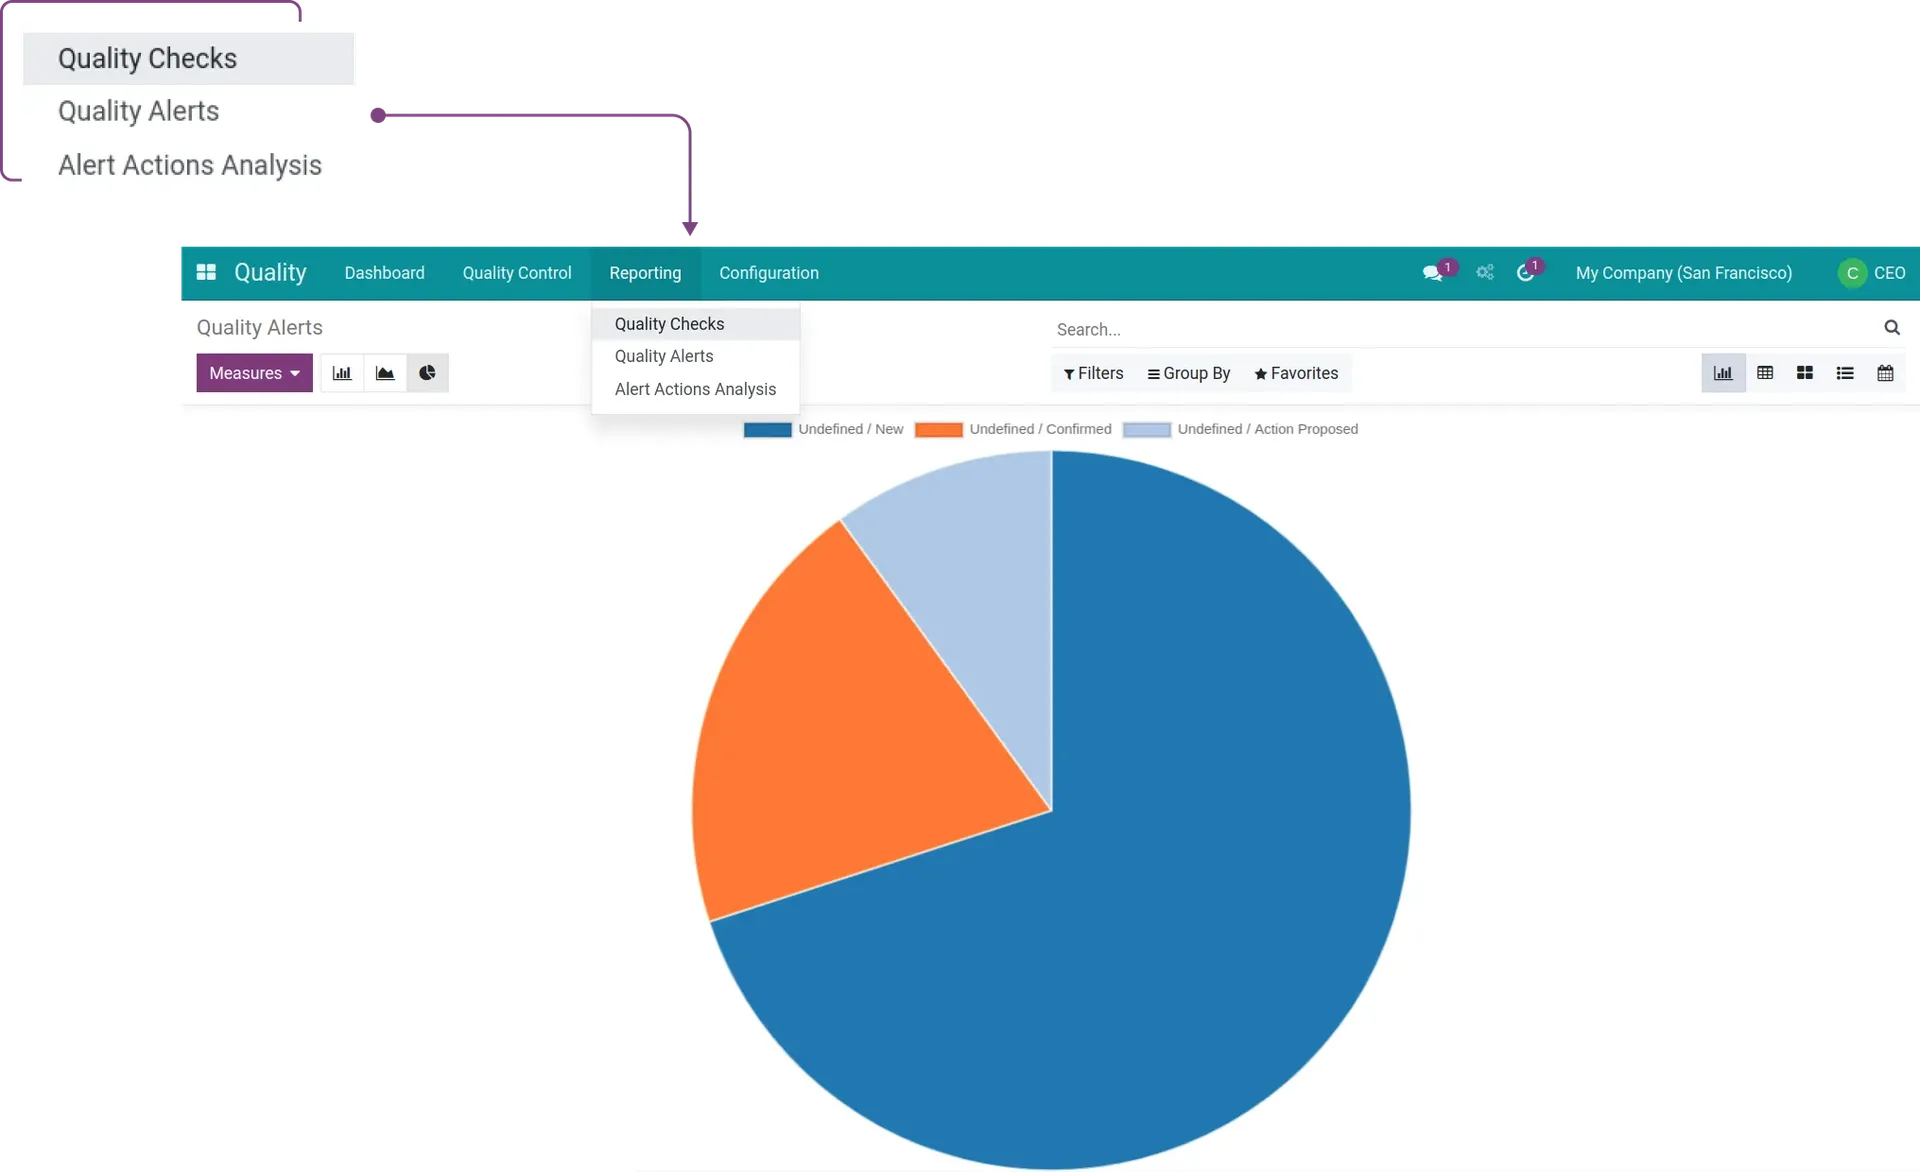
Quality reporting in Viindoo: quality checks, quality alerts and alert action analysis.
6. Seeing work in process and queues
Work in process (WIP) is the amount of unfinished work inside the system. Too much WIP can signal an unbalanced flow, a bottleneck, weak planning, batches that are too large or a downstream operation that cannot keep up. For example, if 300 products always pile up between machining and painting while other positions hold almost nothing, that is a signal. Queue data tells the business where the flow of work is blocked, one of the core principles of Lean and Kaizen.
In Viindoo, work orders carry statuses such as waiting for components, ready and in progress, and can be filtered and grouped by work center to see where work is queuing. A dedicated WIP report by operation is not provided out of the box; it is set up from this data when the business needs it.
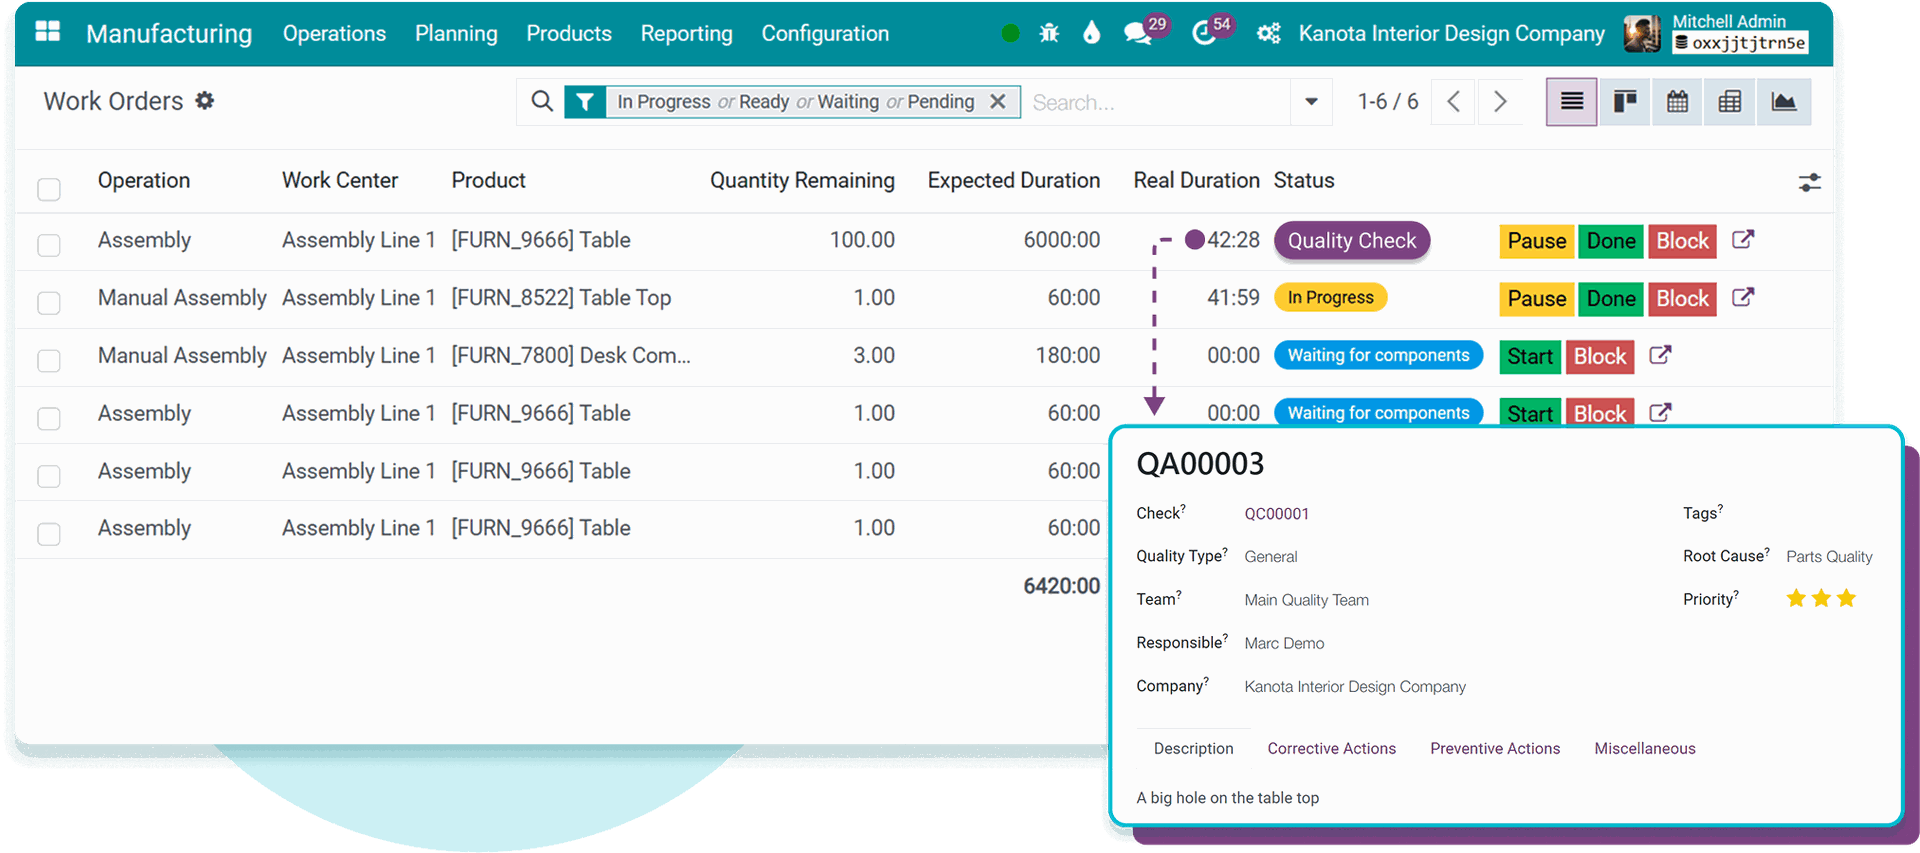
Work orders show which operations are waiting for components, in progress or under quality check.
7. Seeing cost where it occurs
Kaizen is not only about raising productivity. In the end, the business still has to answer:
What financial value does this improvement create?
To answer that, cost data has to be linked to operations. An order may incur materials, machine hours, labor hours, subcontracting, rework and transport costs. When this data is linked to the order and to production, the business can see which orders and products are profitable, which customers generate the most cost and which operations drive up the cost of goods sold. Kaizen then becomes directly connected to margin.
In Viindoo, the Advanced MRP Accounting app analyzes cost for each manufacturing order, including labor and machine cost based on each work center's hourly rate, and sales orders show their margin. Seeing cost by customer or by project requires setting up analytic accounts during implementation.
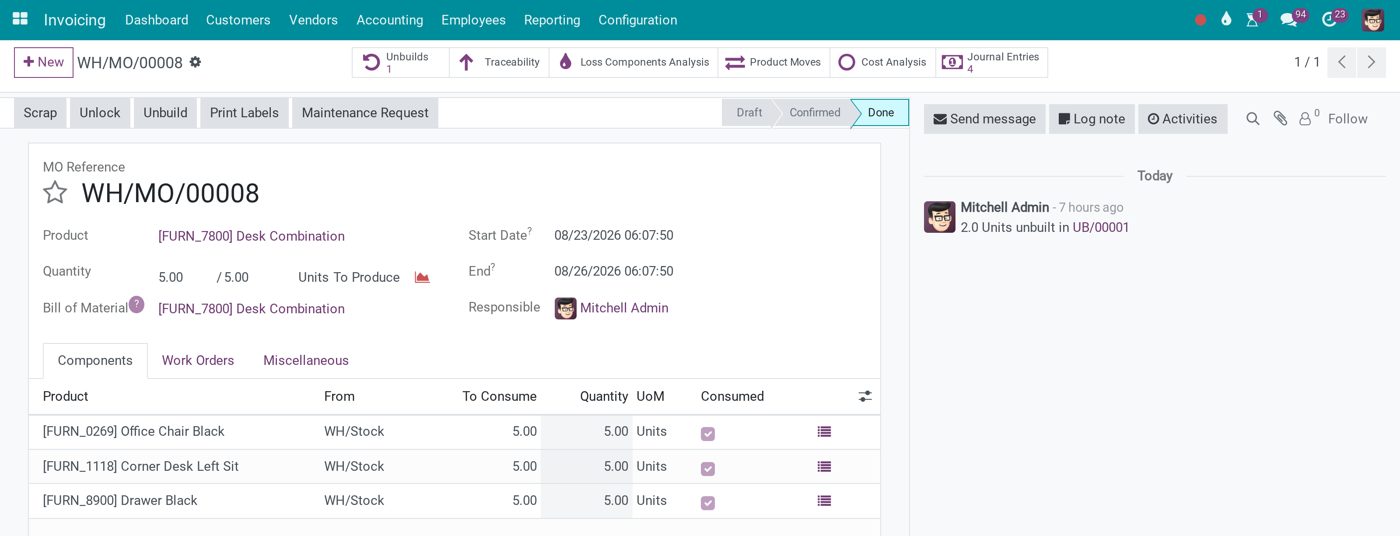
From a finished manufacturing order, Cost Analysis and Journal Entries show what it actually cost.
How does Viindoo help a business see the flow of work?
Viindoo's role here is not simply to provide a dashboard. A dashboard is only the last layer. What matters more is that:
Data must be created continuously throughout operations.
- Sales Order: creates the demand.
- BOM: defines the product structure and material requirements.
- Purchase and Inventory: record how material needs are met.
- Manufacturing: records the execution of production.
- Quality: records inspection results.
- Delivery: records the completion of the order.
- Accounting: reflects revenue and cost.
When these operations run on one platform, every event becomes a piece of data in the whole flow. That is the difference between digitalizing each department and digitalizing the flow of the business.
A dashboard does not mean good data
This is easy to misunderstand. A good-looking dashboard does not mean the business can manage with data. If the source data is incomplete, entered too late, inconsistent, disconnected or does not reflect reality, reports will not make Kaizen effective. The principle has to be:
To see correctly at the end of the flow, record correctly at the start.
For example, if the business wants to know the actual cost per order but the initial BOM is too rough, accurate analysis later becomes very hard. That is why, in ERP implementation, some seemingly small data points have a big effect on management later on.
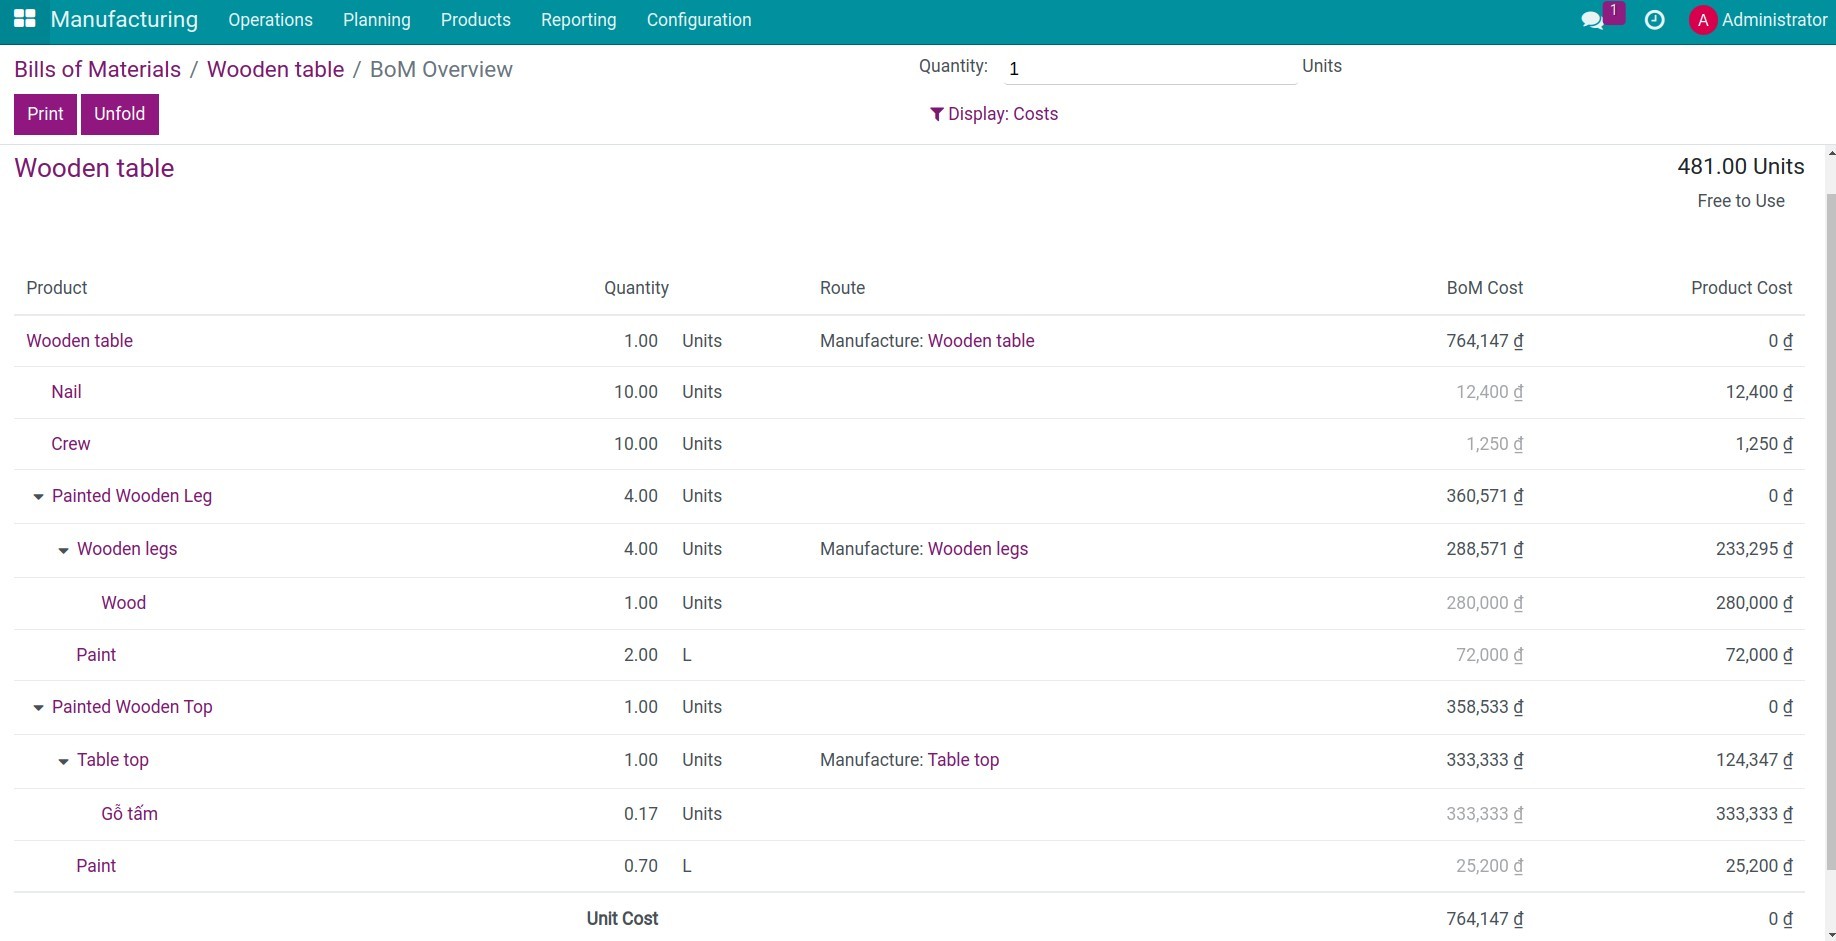
A detailed multi-level BOM is the baseline for comparing actual cost after production.
Is collecting more data always better?
No. Digitalization should not turn into a giant record-keeping project. Data should only be collected when it helps the business operate, control, measure or decide. If recording the start and end time of an operation helps measure cycle time and bottlenecks, that data is valuable. But if users are asked to fill in ten more fields that nobody uses, data entry itself becomes waste.
This is where Kaizen and digitalization start to look contradictory, and it will be the topic of the next articles in this series.
A simple test: does your digitalization support Kaizen?
- Does the system help you see the flow of work? If you do not know where the work is, improvement is hard.
- Does it help you see deviations? Without comparing plan and reality, problems are hard to identify.
- Does it help you trace causes? If you only know the final result and cannot trace the history, Kaizen rarely hits the right point.
If a system answers these three questions, it has started to become a platform for continuous improvement.
From seeing results to seeing the flow of work
This is the most important shift digitalization can bring to Kaizen. The business no longer sees only that an order is late, but where it is late; not only that costs are rising, but at which operation; not only that productivity is low, but where the time is being lost.
Digitalization turns activities into data. Data makes the flow of work visible. Seeing it lets Kaizen solve the right problem.
That is also how Viindoo approaches digital transformation: not only digitalizing individual operations, but connecting them into one continuous stream of management data so that the business can see, measure and improve.
Frequently asked questions
How does digitalization help Kaizen?
Digitalization records operational events as data, so the business can observe operations, waiting times, deviations, defects and bottlenecks, and identify exactly where to improve.
Is a dashboard the most important thing for Kaizen?
No. A dashboard is only where data is displayed. What matters more is that source data is recorded correctly and linked across operations.
Which data matters most for Kaizen?
It depends on the business, but usually work status, start and end times, output, defects, material consumption, WIP, cost and the gap between plan and reality.
How does Viindoo help a business see the flow of work?
Viindoo connects sales, BOM, purchasing, inventory, manufacturing, quality, delivery and accounting on one platform, so data forms a continuous stream from start to finish. Standard screens show order links, manufacturing progress, work center OEE, standard versus actual consumption and quality alerts; cross-stage analyses such as lead time by stage are set up as reports during implementation.
Do we need to digitalize everything from the start?
Not necessarily. Prioritize the data points needed to see the flow and the main deviations first, then add detail only when management and improvement really need it.
Next in the series: Does Kaizen need ERP?
A business can do Kaizen without ERP. But as operations grow, data scatters and processes multiply, ERP starts to play a different role: not just management software, but a platform that keeps a stream of data flowing for continuous improvement. In the next article, we will look at when ERP truly becomes the foundation for continuous improvement.
Related articles
- Kaizen and Digitalization: How They Connect in Business Improvement
- What is Kaizen? What is Kaizen method benefit?
- A Guide to Implementing Kaizen in Manufacturing with Viindoo
- Production Planning: The Linkage Foundation in Strategic Enterprise Management
- ERP, WMS, MES, IoT: Where Should Businesses Begin?