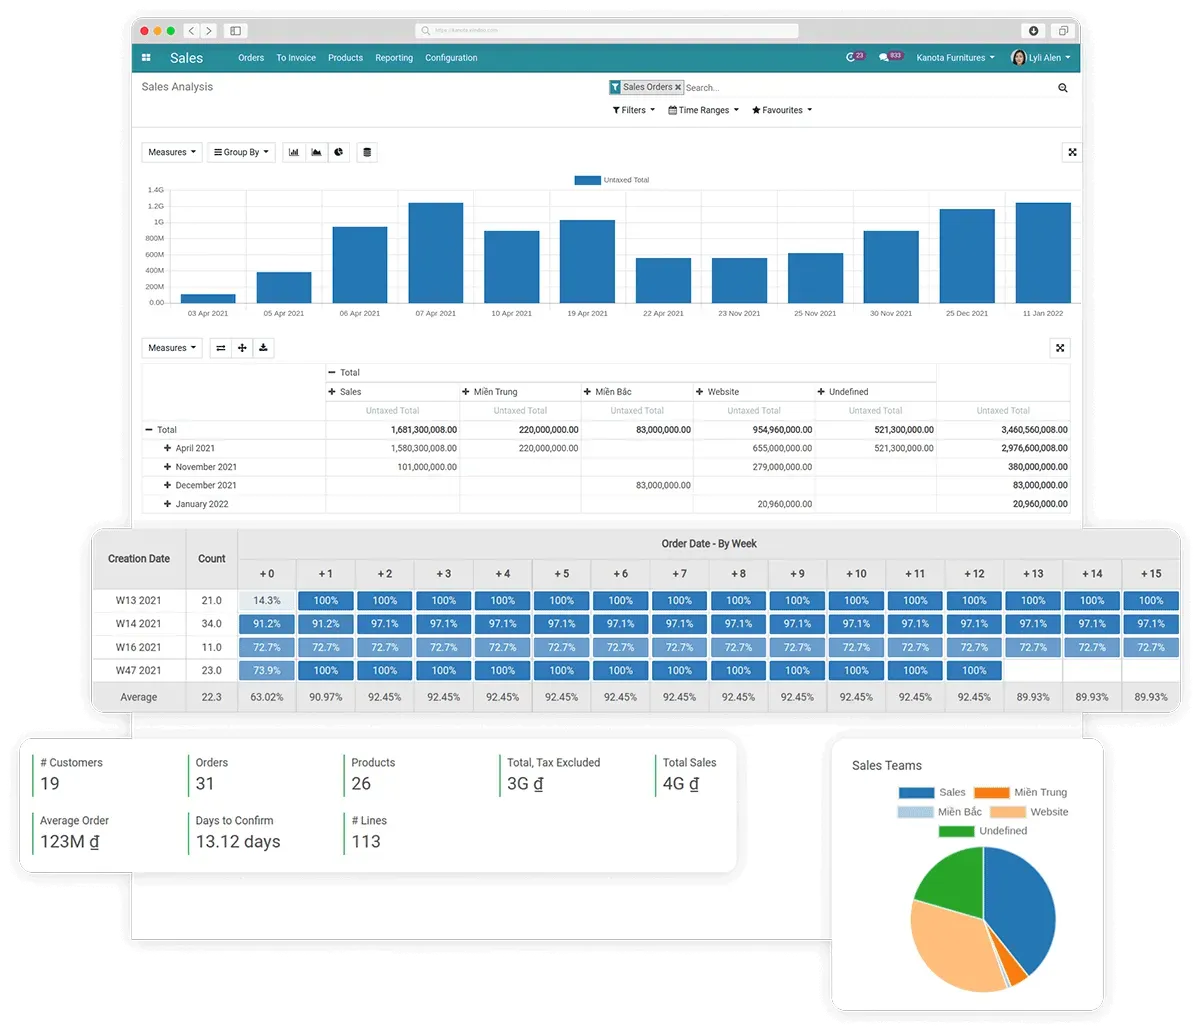
Struggling to understand your sales team's performance? Optimize your sales process with Sales Performance Analysis and improve your bottom line. This comprehensive guide will explore key sales metrics and performance indicators that can drive success in any sales organization. You will also be provided with a practical, visual sample of a sales performance analysis tool - the Viindoo Sales Management Software.
What is Sales Performance Analysis?
The sales performance analysis involves the measurement and evaluation of a sales team's effectiveness. It provides insights into areas of improvement and helps managers make data-driven decisions to optimize their sales process. By tracking and analyzing sales metrics, businesses can identify trends, evaluate performance, and adjust strategies accordingly.
Key Sales Performance Analysis Metrics to Track
Here are some essential metrics to track:
Sales Revenue
Sales revenue, also known as sales or revenue, refers to the total amount of money generated by a business through the sale of its products or services during a specific period. Sales revenue is calculated by multiplying the number of products or services sold by their respective selling prices. It is the most fundamental metric for measuring sales success and growth.
Sales Conversion Rate
The sales conversion rate is the percentage of leads that convert into paying customers. Tracking this metric helps businesses understand how effective their sales process is and where leads may be getting lost in the funnel.
Customer Acquisition Cost (CAC)
Customer acquisition cost is the total cost of acquiring a new customer. This includes marketing and sales expenses such as salaries, advertising, and technology tools. Tracking CAC helps businesses understand the ROI of their marketing and sales efforts.
Average Sale Price (ASP)
The average sale price is the average amount of money a customer spends on a product or service. Tracking ASP helps businesses identify their most profitable products and services and optimize pricing strategies.
Sales Cycle Length
Sales cycle length is the amount of time it takes for a lead to become a paying customer. Tracking this metric helps businesses identify bottlenecks in their sales process and improve conversion rates.
Sales Performance Analysis Metrics to Measure
In addition to tracking the above key indicators, there are several performance metrics that businesses should measure to understand their sales team's effectiveness. Here are some critical performance metrics to consider:
Win Rate
The win rate is the percentage of deals won out of total opportunities. Tracking this metric helps businesses identify areas for improvement in their sales process and optimize strategies.
Sales Activity Metrics
Sales activity metrics include metrics such as the number of calls made, meetings scheduled, and emails sent. These metrics help businesses understand how active their sales team is and how effectively they are using their time.
Customer Lifetime Value (CLV)
Customer lifetime value is the total amount of money a customer will spend on your business over their lifetime. Tracking this metric helps businesses understand the long-term ROI of acquiring and retaining customers.
Sales Productivity
Sales productivity is the ratio of revenue generated to time spent selling. This metric helps businesses understand how efficiently their sales team is generating revenue.
Steps to build Sales Analytics
Building an effective sales analytics framework involves several key steps. Here are the general steps to follow:
- Determine objectives: Determining objectives in sales analytics involves understanding the specific goals and outcomes you want to achieve through the analysis of sales data:
- Identify key areas of focus
- Align with business goals
- Set specific and measurable goals
- Consider timeframes
- Prioritize goals
- Assess data availability and feasibility
- Engage stakeholders
- Set realistic and attainable goals
- Review and adjust
- Collect data: Next, gather data related to sales from various sources such as customer relationship management (CRM) systems, sales transactions, or customer data. Ensure that the data collected is comprehensive, accurate, and consistent. Collecting data for sales analysis involves the following steps:
- Identify data sources: Determine relevant data sources such as sales records, CRM systems, customer data, and other information sources.
- Define the data to collect: Specify the specific variables or information needed for analysis, such as sales revenue, customer demographics, or product performance.
- Implement data collection methods: Set up systems or processes to capture the required data, whether through automated tracking tools, online forms, or manual recording.
- Ensure data accuracy and completeness: Establish protocols to ensure the accuracy and completeness of the collected data, including validation checks and regular data quality audits.
- Leverage technology: Utilize automation and technology tools like CRM systems or analytics software to streamline data collection and integration processes.
- Encourage data input and feedback: Foster a data-driven culture by emphasizing the importance of data input and encouraging feedback from sales teams.
- Ensure data privacy and compliance: Adhere to data privacy regulations and protect customer information by implementing appropriate security measures.
- Regularly monitor and update data: Continuously review and update data collection processes to maintain accuracy and relevance, considering system upgrades or changing business needs.
- Data preprocessing: Prior to analyzing the data, preprocess it to clean, normalize, and prepare it for analysis. This includes removing invalid data, filling in missing values, and transforming the data into the appropriate format.
- Apply analytical methods: Utilize analytical methods such as data mining, regression analysis, cluster analysis, or forecasting to extract valuable insights from the sales data. Apply suitable data analysis tools and techniques to generate detailed analyses and identify patterns within the data. Here's a shorter version:
- Define objectives
- Gather relevant data
- Analyze the data
- Apply predictive modeling
- Segment and cluster analysis
- Make data-driven decisions
- Monitor and evaluate
- Communicate findings
- Visualize and report: Visualization of data is a crucial aspect of Sales Analytics to understand and communicate information effectively. Use visualization tools such as charts, graphs, or dashboards to represent the data and analysis results. Create comprehensive and detailed reports summarizing the analyses and findings.
- Derive actions and improvements: Finally, based on the analysis results, derive actionable insights and propose specific actions to improve sales performance. Use the insights from Sales Analytics to adjust sales strategies, optimize processes, or create effective marketing campaigns.
Sales Performance Analysis in Viindoo

Viindoo Sales Revenue Report by Order Date

Viindoo Sales Revenue Report by Order Date and Sales Person

Viindoo Sales Analysis Report in Pivot View with flexible Analysis Metrics

Viindoo Sales Analysis Dashboard
>>>> Read More: 6 detailed Excel daily and monthly sales report templates
Customer Acquisition Cost (CAC)
When using Viindoo software for lead management, sales staff can generate tickets or tasks linked to the respective lead, facilitating related actions. As the sales team logs their work hours, the software automatically calculates associated costs, empowering you to maintain control over order-related expenses.
Viindoo Sales Activity Metrics
Viindoo provides a visualized activity view to help businesses track their sales activities such as Email, Call, Meeting, Order Upsell, Reminder, To-do list, Recall Productions, Upload documents, etc. with highlights for late/on-time/future activities.
Numerous good software solutions are available that specialize in sales performance analysis, choosing the right tool is very important but also challenging for businesses. The following highlights give you an example of a top sales management software that can help you manage sale performance based on real-time and visualized analysis.

Viindoo Sales Management Software
Viindoo Sales Management Software is among the Top 10 Best Sales Management Software for High-Performing Sales Teams. What sets Viindoo Sales apart from many other standalone sales tools is its integration with thousands of other applications, such as CRM, E-commerce, Inventory, and Purchase, within the all-in-one Viindoo Enterprise Management Software. This will enable a faster, more timely, and more comprehensive analysis and evaluation of sales performance.
Sales Analysis Reports
Viindoo Sales Analysis Reports provide many Sales Performance Metrics such as sales revenue, average sales order value, days to confirm the order, etc.
Sales Conversion and Lead Conversion Analysis
Viindoo provides the Sankey Chart report to help businesses track their conversion rate from Quotations to Sales Orders and from Potential Leads to Won Opportunities.

Viindoo Sankey Chart - Tracking Sales Conversion Rate

Viindoo Sankey Chart - Tracking Lead Conversion Rate
See more: Increase sales performance
Q&As
What is a Sankey diagram?
A Sankey diagram is a type of flow diagram that visualizes the flow of resources, quantities, or values between multiple entities or categories. It is used to represent complex relationships and interactions within a system. Sankey diagrams are characterized by their interconnected flow lines that show the distribution and transformation of inputs into outputs.
In a Sankey diagram:
Flow Lines: These are the main feature of the diagram, showing the movement of a quantity (such as energy, materials, or money) from one category to another. The width of the flow lines represents the quantity being transferred.
Nodes: Nodes are the entities or categories that the flows connect. These can represent processes, states, or compartments within a system.
Labels: Each node and flow line is labeled to indicate what it represents, whether it's a specific process, input, output, or transition.
Sankey diagrams are commonly used in various fields, including economics, engineering, environmental science, and data visualization, to illustrate the distribution of resources, energy, costs, or any other measurable quantities. They provide a clear and intuitive way to understand complex systems and identify patterns, bottlenecks, and areas for improvement.
For example, in sales performance analysis, a Sankey diagram could show the transition of leads from various stages of the sales funnel to the final conversion as paying customers, illustrating where leads drop off or move through the process most efficiently.
Does Viindoo Sales Management Software provide Customer Lifetime Value (CLV) metric?
Not really, but you can check the total sale revenue of a customer using the customizable pivot report:

How much does Viindoo Sales Management Software cost?
Viindoo Sales is free forever for first application with unlimited users. Checkout here: https://viindoo.com/pricing
Is Viindoo Sales Management Software easy to use?
Yes, Viindoo Sales is designed to be user-friendly and easy to use. We offer training and support to help users become familiar with the software and its features.
Can Viindoo Sales Management Software integrate with other software systems
Yes, our Viindoo Sales offer integration with other software systems, ensures that all of your business operations are seamlessly connected and optimized for efficiency. You can contact our sales team to clear your requirement and receive a suitable quotation.
Sales performance analysis is crucial to understanding your sales team's effectiveness and optimizing your sales process. By tracking key sales metrics and performance indicators, businesses can identify areas for improvement and make data-driven decisions to drive success. By implementing the tips and best practices outlined in this guide, you can improve your sales team's performance and drive growth for your business.
>>>> See More:

Sales Management Solution - Boost Your Sales
FREE FOREVER
Easily increase sales with Viindoo Sales Management Solution

