Quality Dashboard
by Viindoo
| Lines of Code | 448 |
| Technical name | viin_spreadsheet_dashboard_quality |
| License | OPL-1 |
| Website | https://viindoo.com/apps/modules/19.0/viin_spreadsheet_dashboard_quality |
| Required Apps | Discuss (mail) |
| Included Dependencies | Quality |

See where quality stands and where it is lost, on one page every week
For quality managers and operations leads who run the Quality app
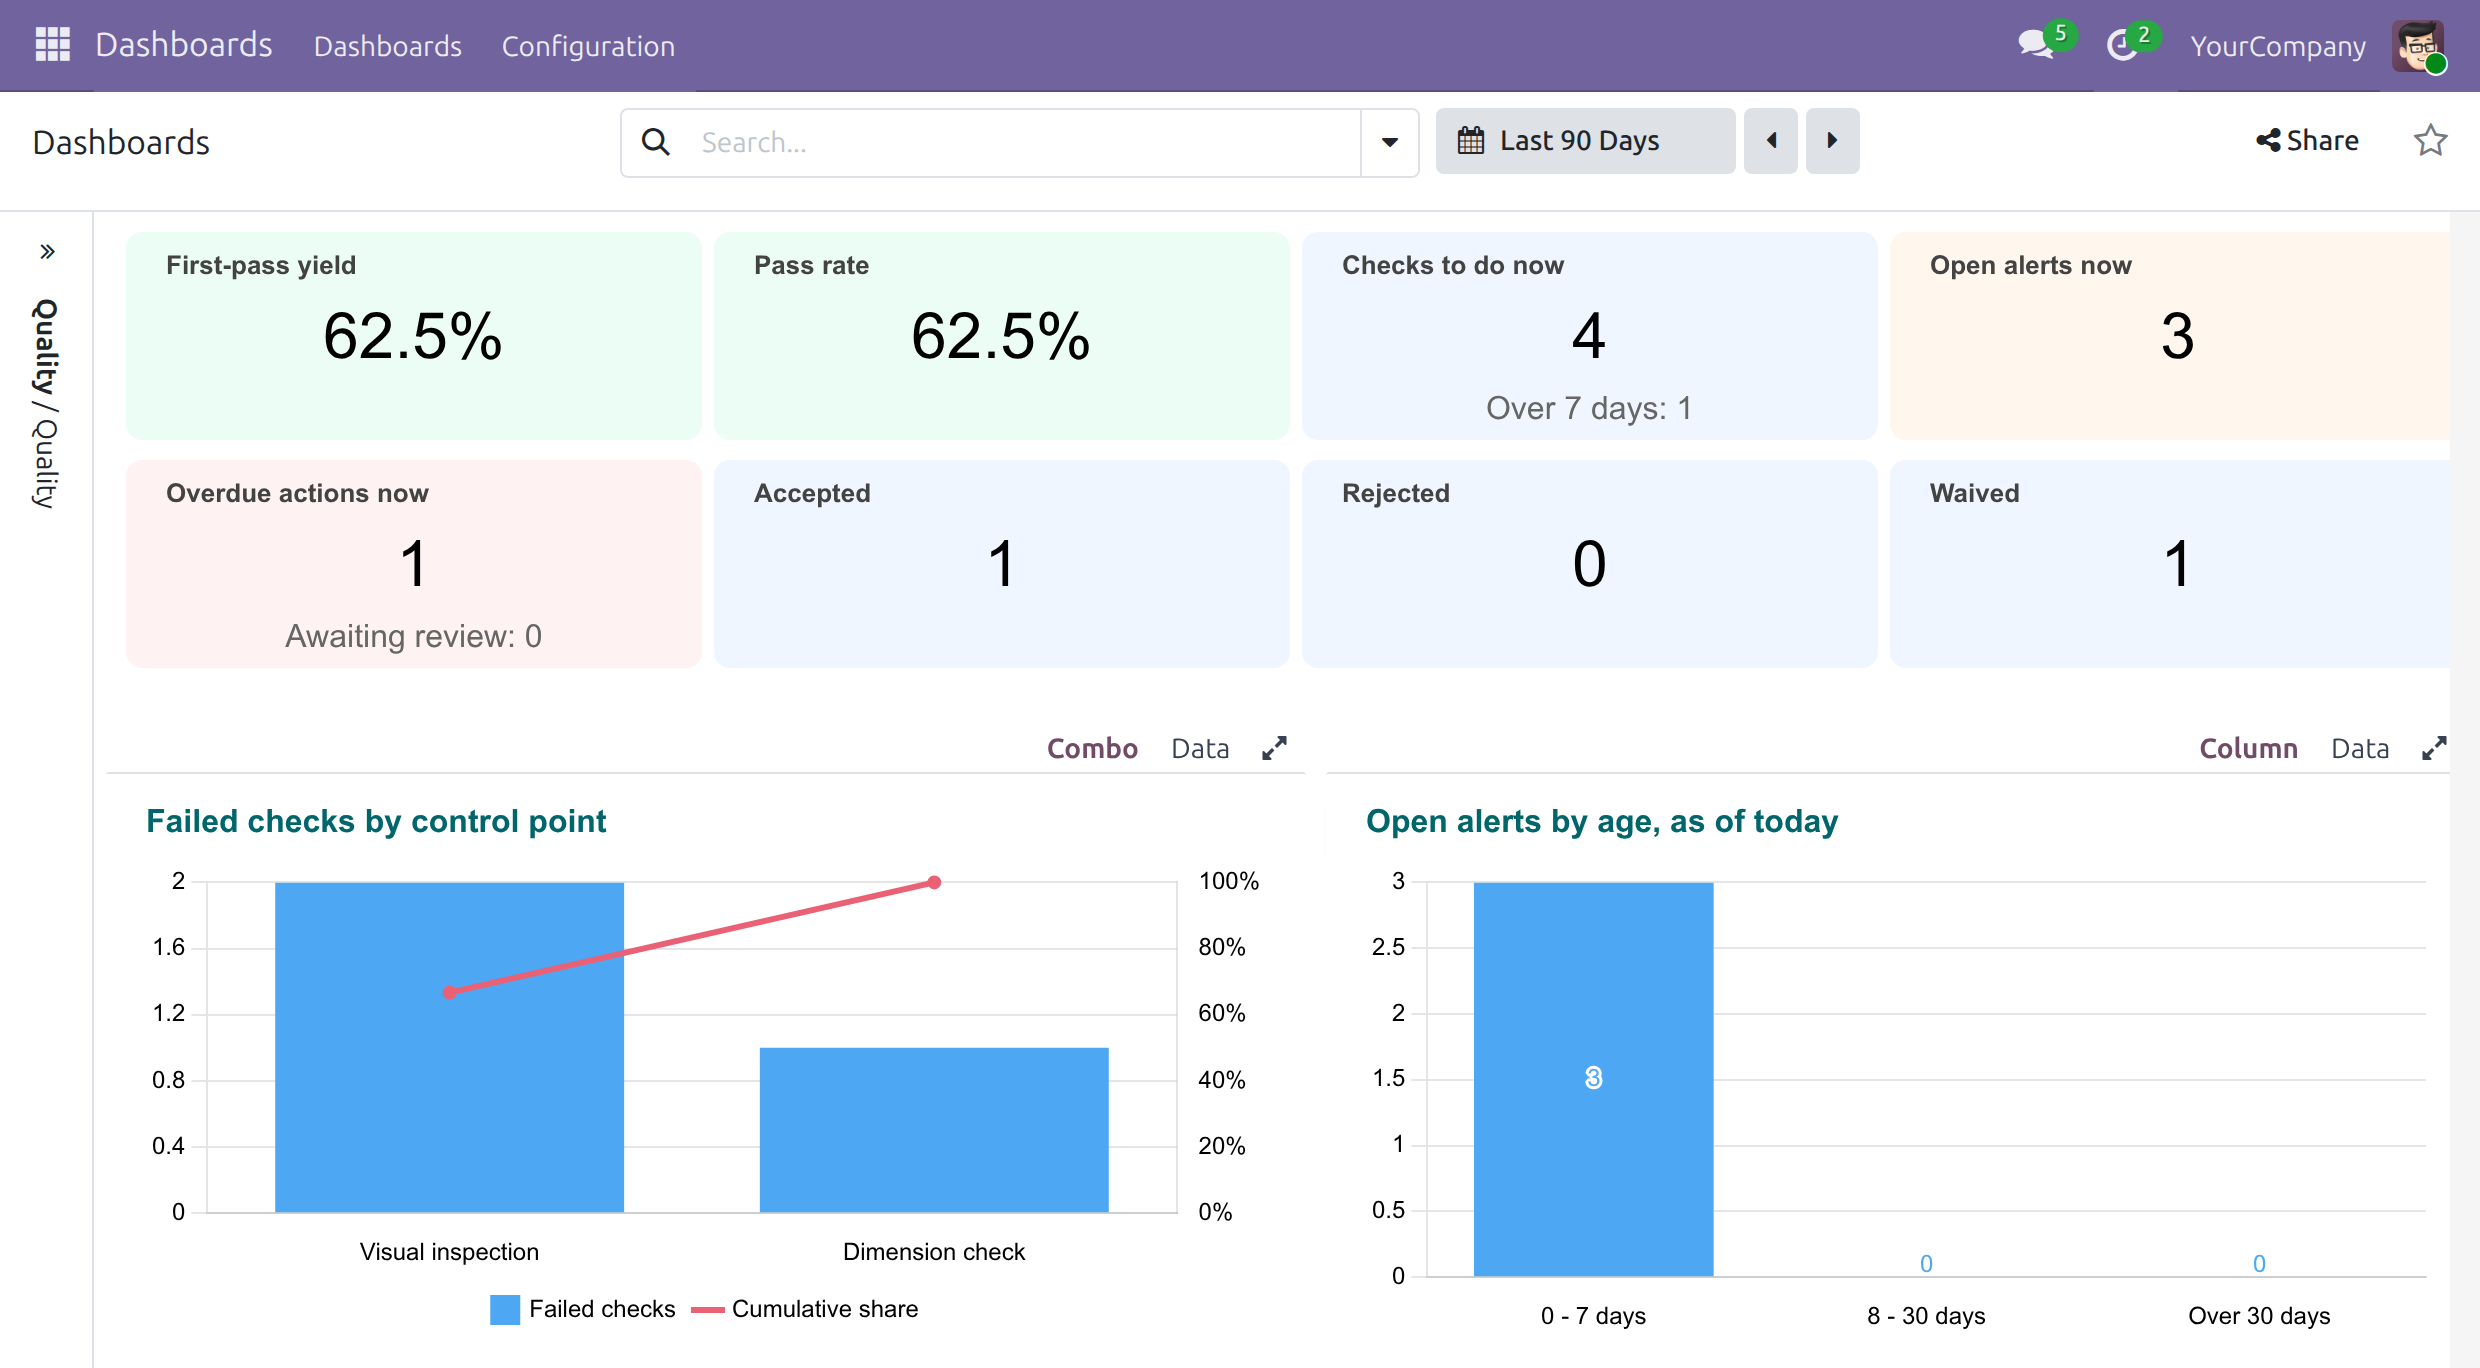
Quality dashboard: first-pass yield, failures by control point, open alerts by age, overdue actions.
Odoo Community Edition · Viindoo Cloud · License OPL-1 · English, Vietnamese
Extends Quality: its checks, alerts and corrective and preventive actions become the figures of the dashboard.
What changes for your team
The weekly review starts from figures, not from exports
Before each review, checks and alerts are exported to a spreadsheet, and each person computes the rates differently.
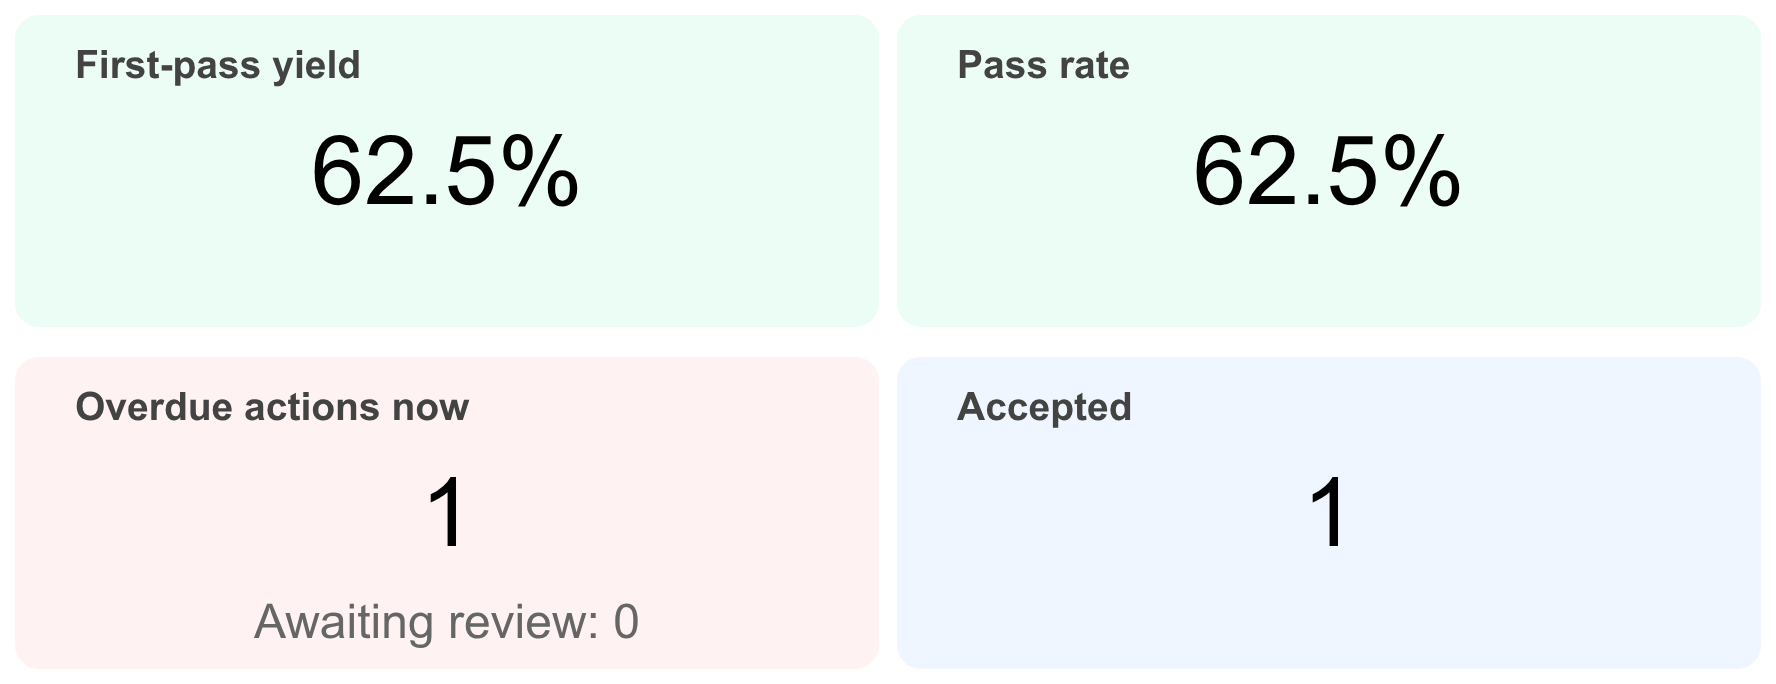
→ First-pass yield and pass rate come from the totals of the period, beside the work still waiting and the decisions taken.
See which control points lose the quality
Failures are known one by one, with no view of which inspection accounts for most of them.
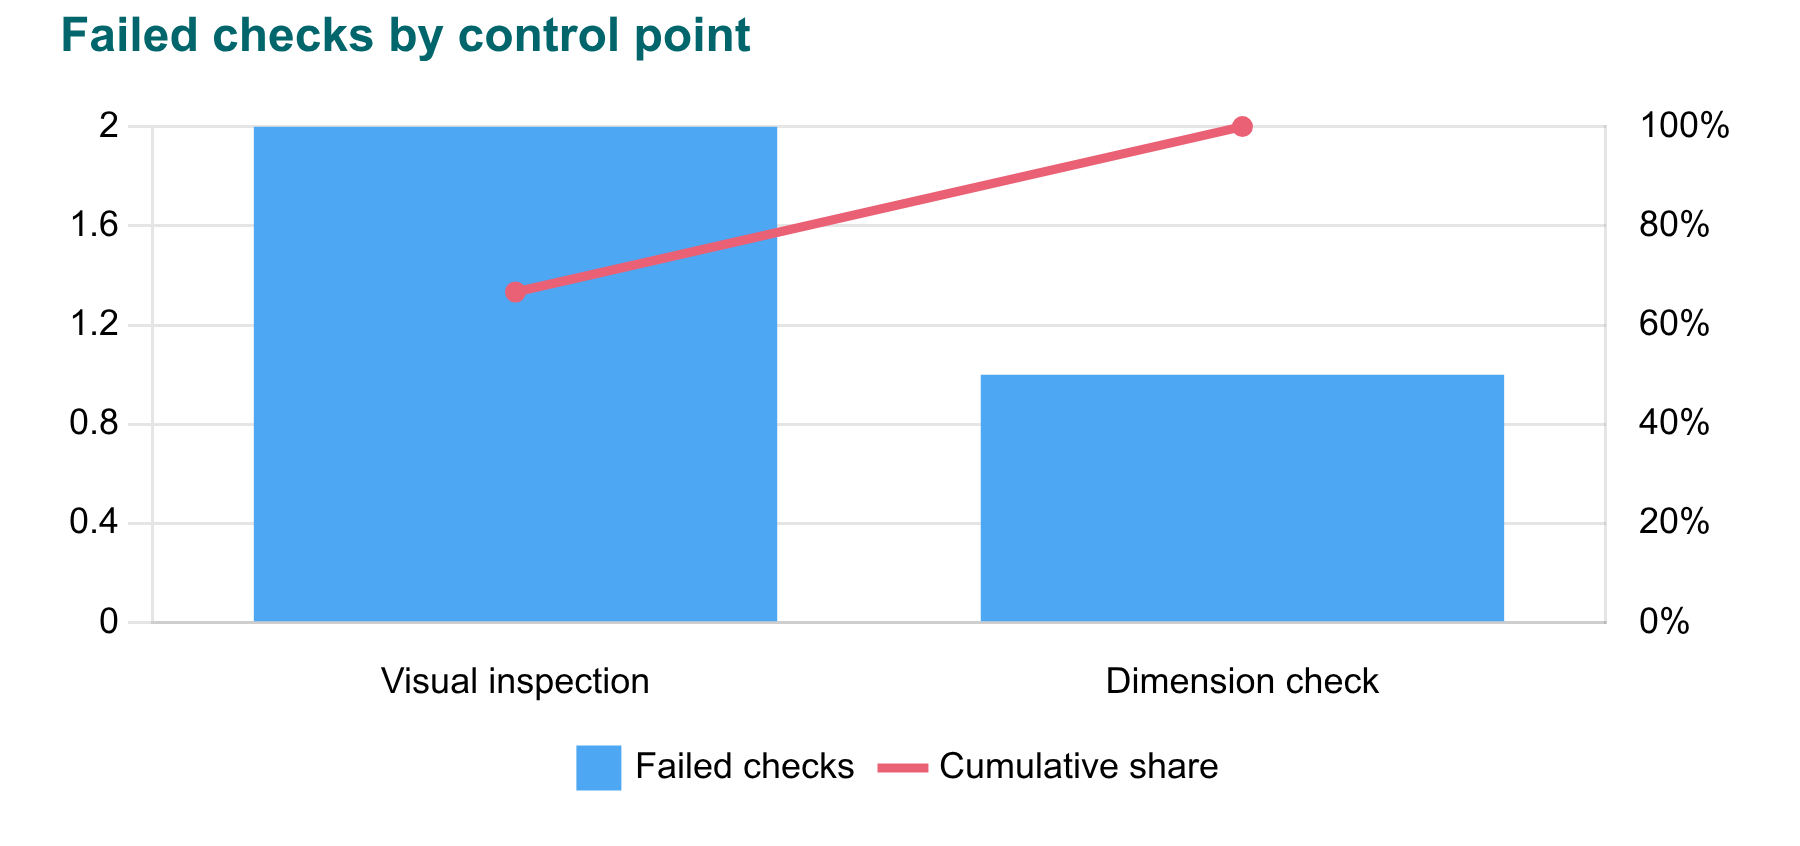
→ Failed checks are ranked by control point with their cumulative share: the first bars show where to act first.
Each team reads its own figures
One company-wide number hides which team or which company holds the problem.
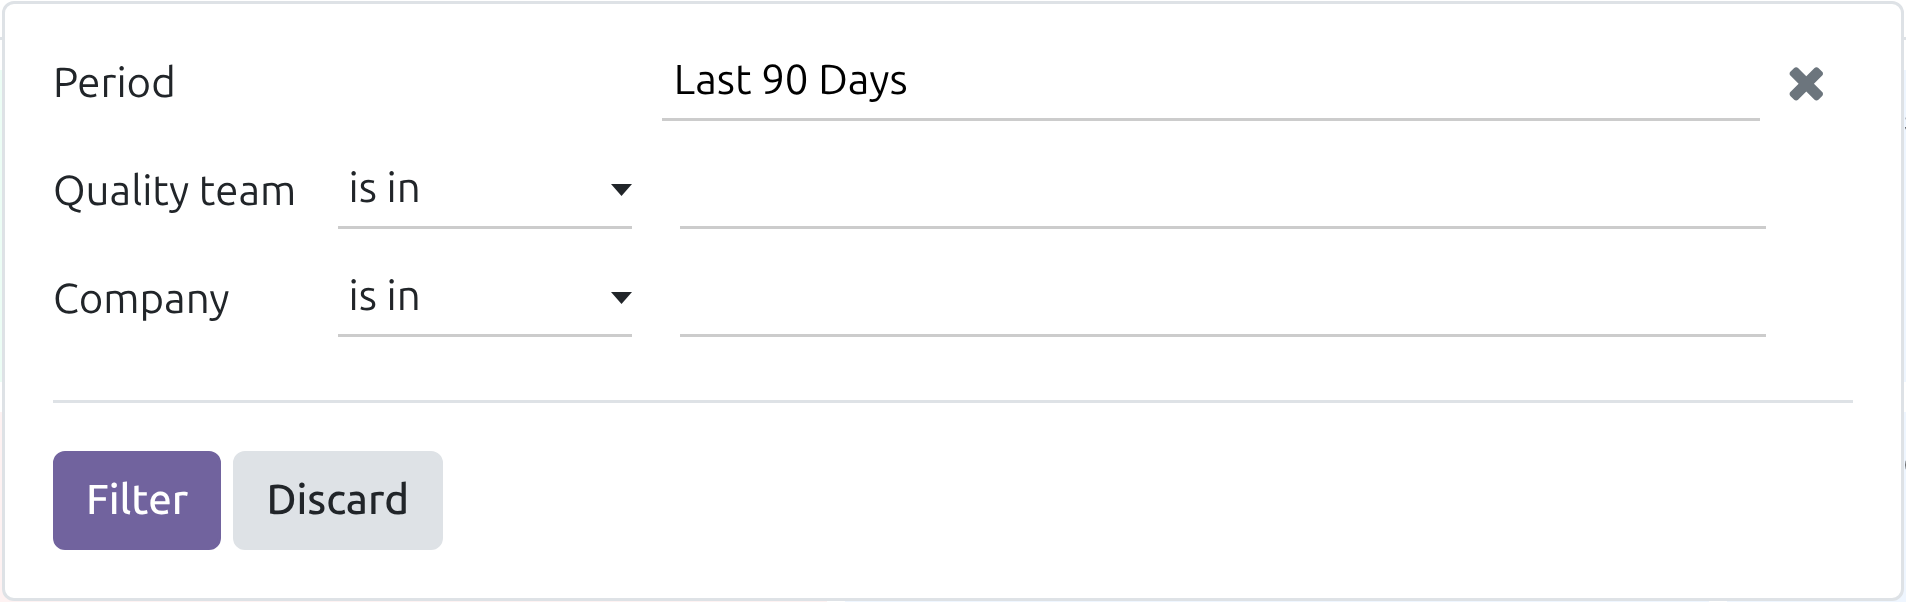
→ Filters narrow the figures to a period, a quality team or a company, while the follow-up figures keep showing the situation of today.
What you see as a manager
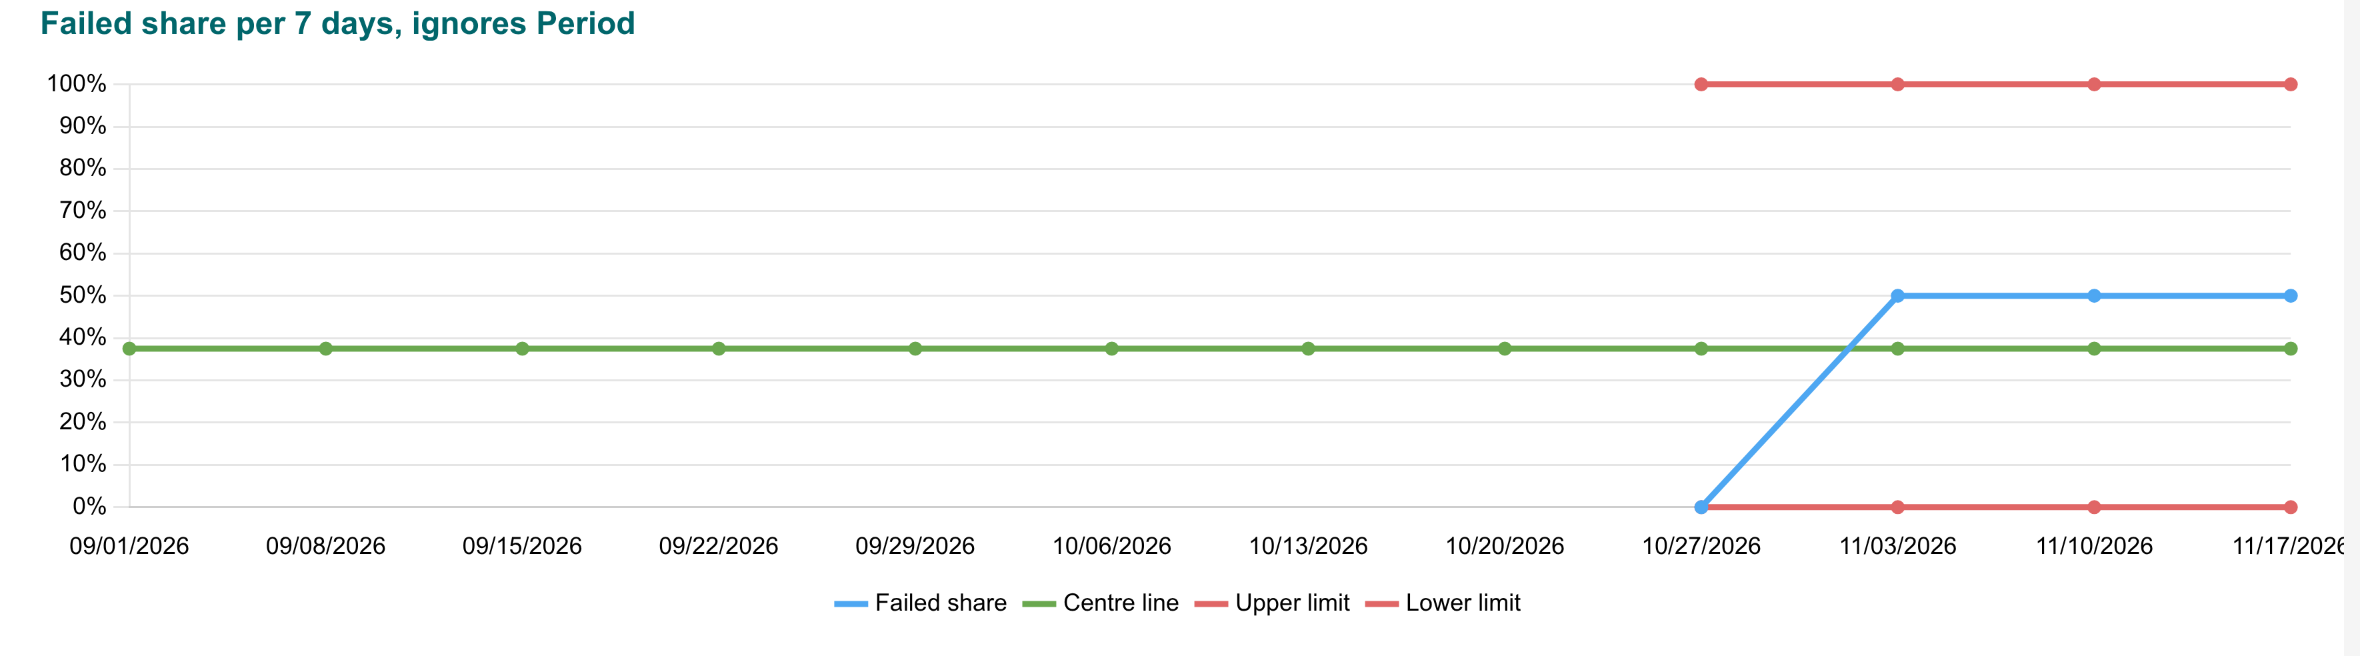
Is the failure rate stable, or does a week signal a special cause?
The share of failed first inspections in each of the last 12 periods of 7 days.
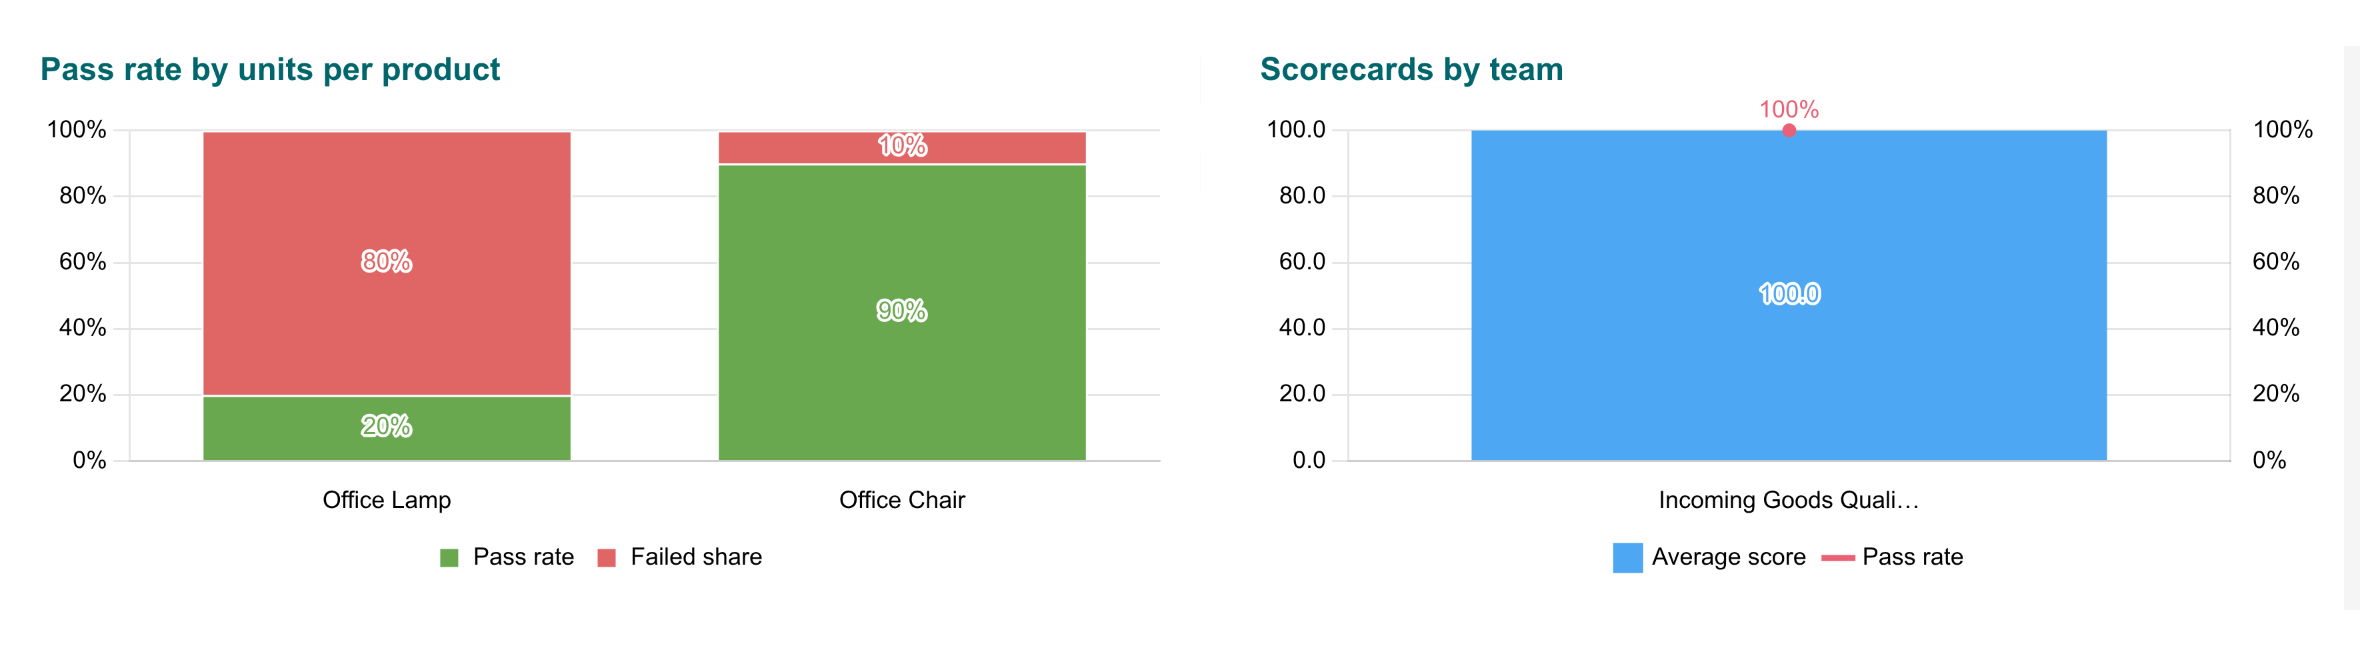
Which products lose units, and how do the teams score?
The summed passed and failed quantities of each product, and the scorecard checks of each quality team, in the period.
Features
Rates you can trust
- ✓ First-pass yield and pass rate from totals, never averaged
- ✓ Pass rate by units per product, from summed quantities
- ✓ Decisions of the period: accepted with concession, rejected, waived
Where quality is lost
- ✓ Failed checks by control point with the cumulative share
- ✓ Control chart of failed first inspections over 12 periods of 7 days
- ✓ Control limits that show a period with a special cause
Follow-up of today
- ✓ Checks still to do, with those waiting over 7 days
- ✓ Open alerts in three age bands
- ✓ Overdue actions and finished actions awaiting their effectiveness review
Services and teams
- ✓ Average score and pass rate of scorecard checks per team
- ✓ Filters on period, quality team and company
Built for daily use
- ✓ Shown only to users with a Quality access right
- ✓ Each user's figures count only the records they can read
- ✓ Counts the companies selected in the company switcher
- ✓ Nothing to enter: it reads the checks, alerts and actions already recorded
Ready on day one
A ready-made dashboard
Installed by itself once Quality and Dashboards are installed; it opens on the last 90 days with nothing to configure.
What you set up first
Give each reader the Quality: User or Administrator access right.
Before you decide
Who sees our quality figures?
Only users with the Quality: User or Administrator access right. Each user counts only the records they can read, so two users can see different figures.
Can we change the charts?
No. The dashboard is a ready-made page: you read it, filter it and open each chart as a table.
Why do the control limits sit at 0% and 100%?
The limits of each period depend on its number of first inspections: with few inspections they widen to 0% and 100%; a period without any inspection has no point.
Does it run on Odoo Enterprise?
No. It is supported on Odoo Community Edition and Viindoo Cloud.
What does it take to install and run?
It needs the Quality app and the Dashboards app, and no extra Python package or server program. It only reads data already in your database.
Try it, then ask us
The Documentation tab above shows how to open the dashboard, read each figure and narrow it.
Pre-sales & partnership
viindoo.com/contactusTechnical support
viindoo.com/ticketQuality Dashboard
This guide is for the quality users who follow quality week by week, and for the administrator who installs the dashboard and gives people access to it.
Note
Extends Quality - see its documentation: Quality.
Overview
The Quality dashboard puts the quality of goods and services on one page of the Dashboards app: how many inspections pass at the first attempt, where the failures come from, how old the open alerts are, which corrective and preventive actions are late, and whether the failure rate is stable. It reads the quality checks, alerts and actions of the companies you work in; there is nothing to enter.
The dashboard is installed together with the Quality app and the Dashboards app, and has no configuration of its own.
| Role | What they do | Access right to assign |
|---|---|---|
| Administrator | Installs the apps and gives people the access right. | Administration: Settings |
| Quality User | Opens the dashboard and reads the figures; narrows them by period, quality team or company. A Quality Administrator has the same access. | Quality: User |
An inspector or any other employee without a Quality access right does not see the dashboard.
Setup (for the Administrator)
Install the dashboard
- Open Apps.
- Search for Quality and click Install on the Quality app.
- Make sure the Dashboards app is installed too. The Quality dashboard is installed as soon as both are present.
Give people their access right
- Open Settings ‣ Users & Companies ‣ Users and open the user.
- On the Access Rights tab, in the Quality line, choose User or Administrator.
- Click Save.
The user finds Quality in the left panel of Dashboards.
Quality User: follow quality on the dashboard
Open the dashboard
- Open Dashboards.
- In the left panel, click Quality.
The dashboard opens on the last 90 days.
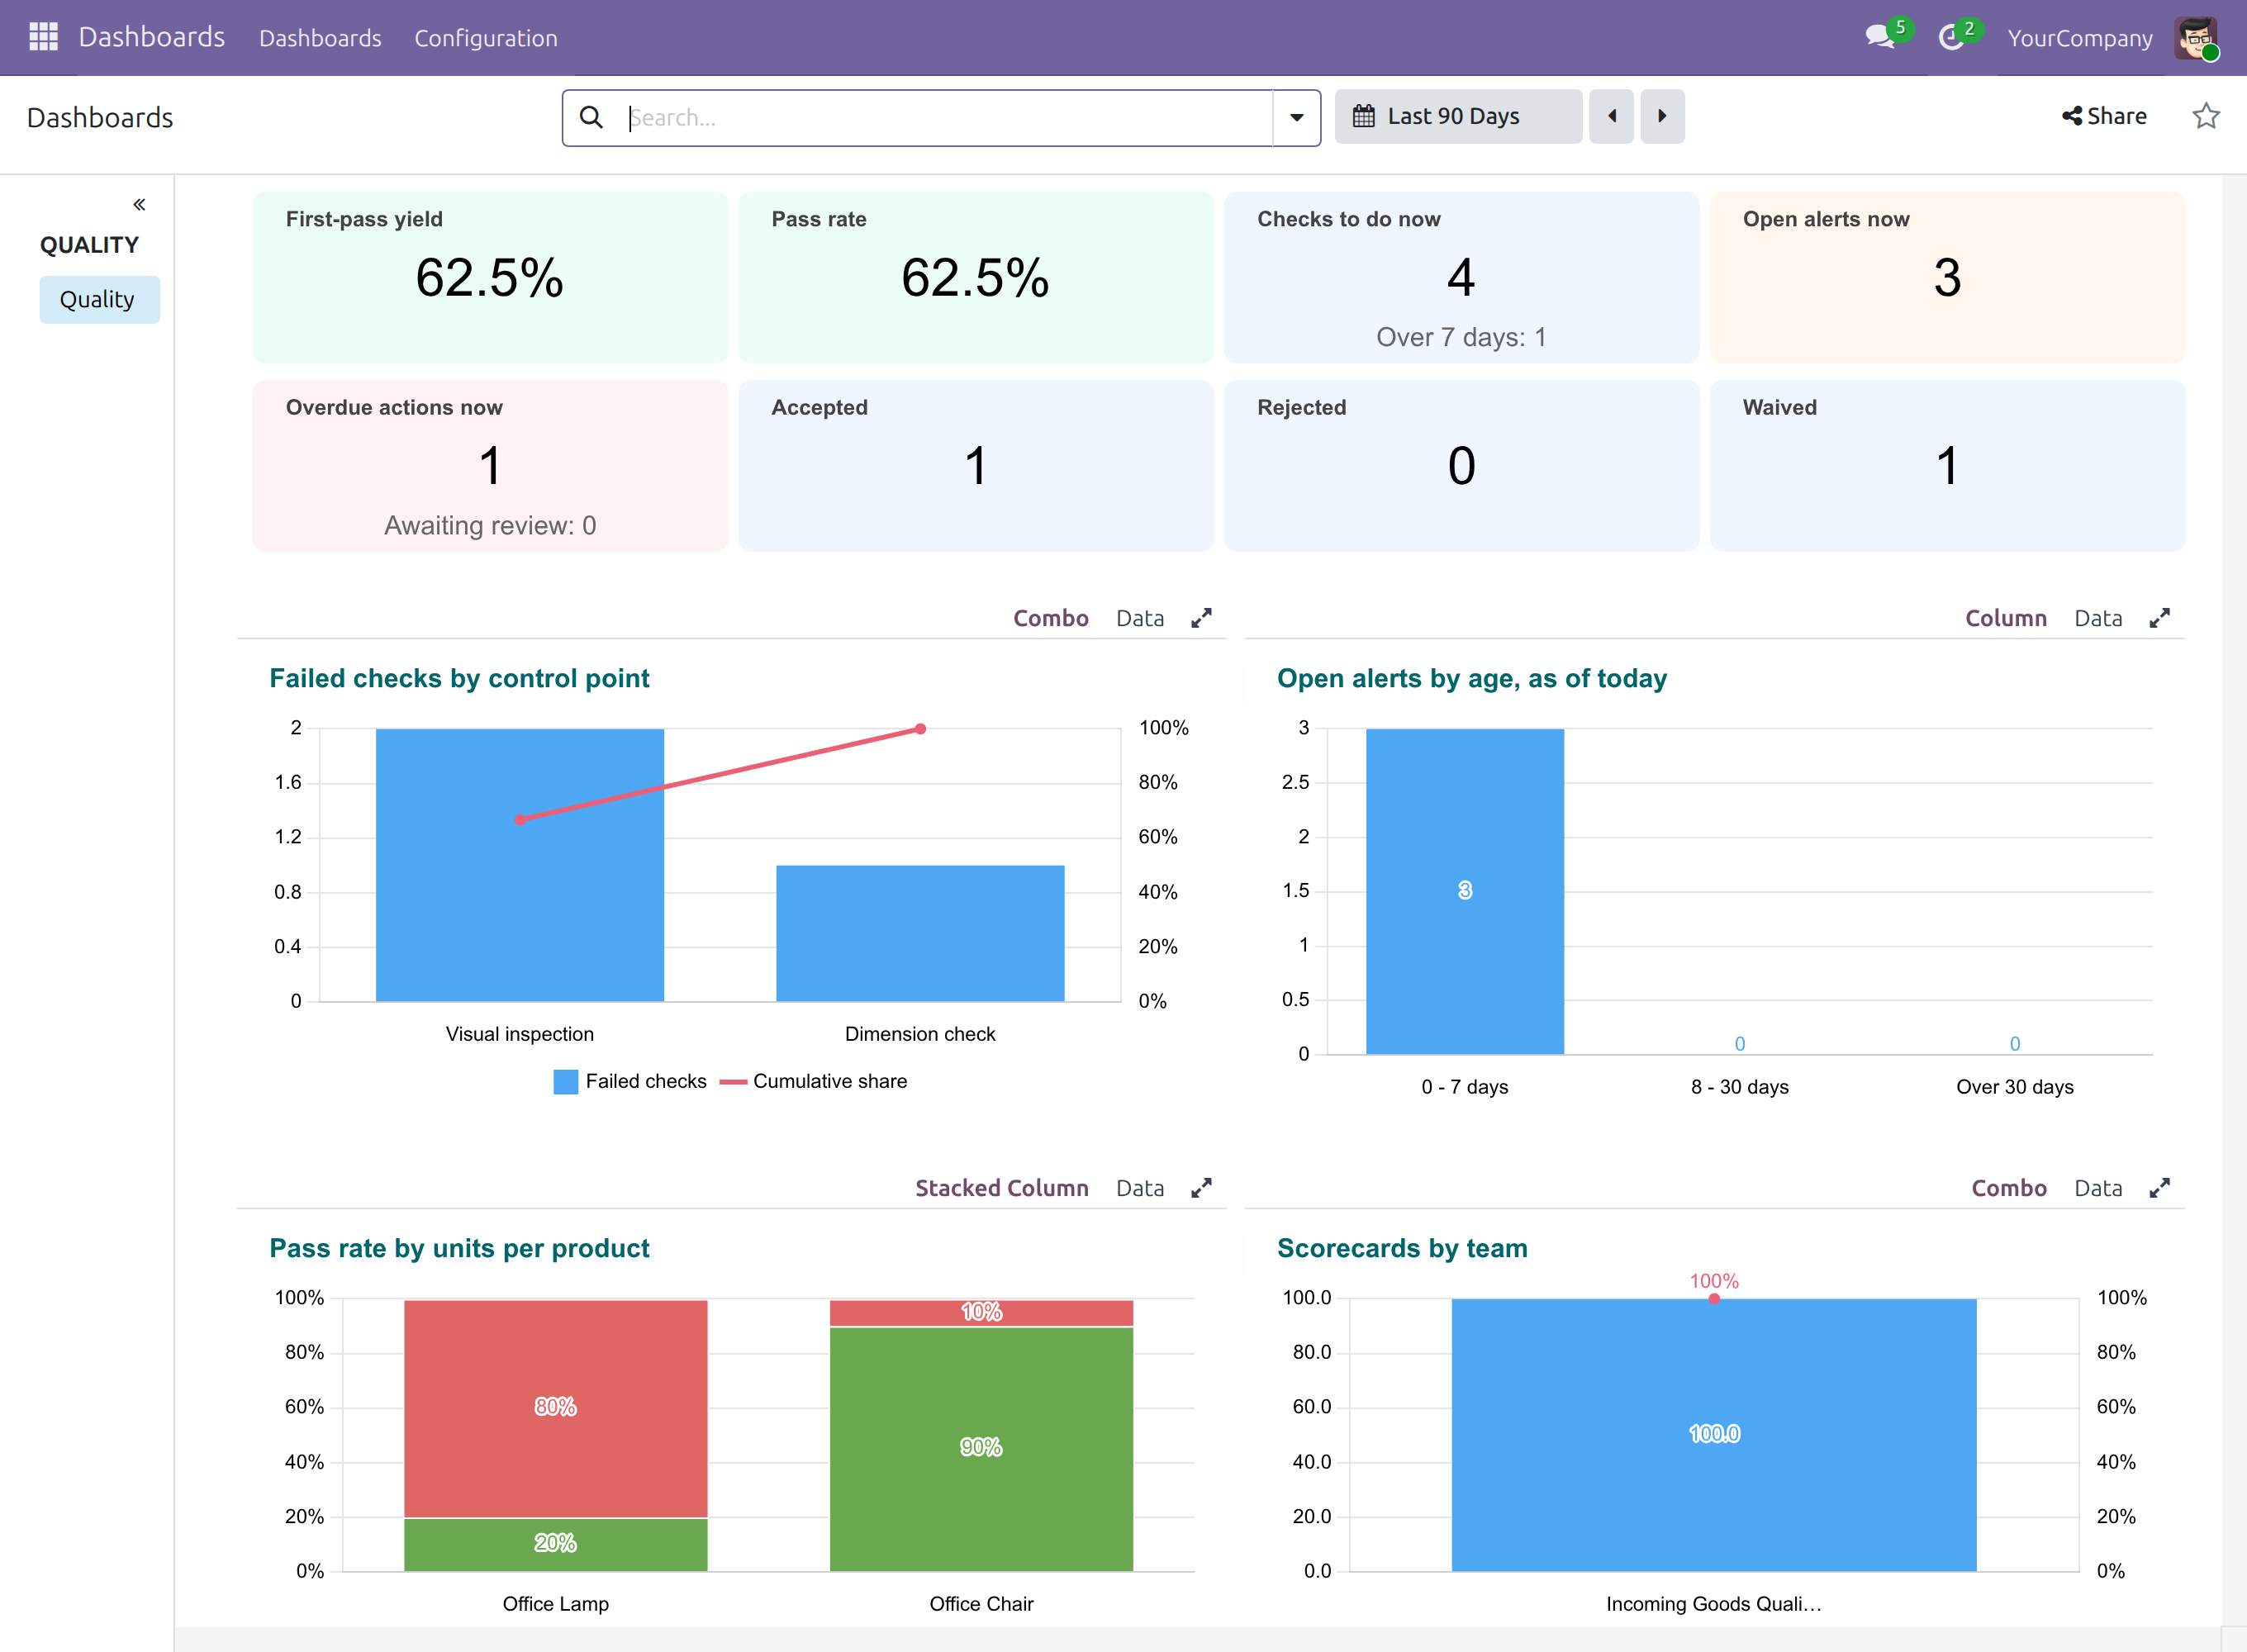
Read the tiles
The top of the page holds eight tiles.
| Tile | What it shows |
|---|---|
| First-pass yield | The share of the checks of the period whose first result was Pass. |
| Pass rate | The share of the checks of the period that currently hold the result Pass. It is higher than the first-pass yield when a failed check was reopened and then passed. |
| Checks to do now | The checks still waiting for a result, with the number of them older than 7 days. |
| Open alerts now | The quality alerts whose stage is not a closing one. |
| Overdue actions now | The corrective and preventive actions past their deadline, with the number of finished actions still awaiting their effectiveness review. |
| Accepted, Rejected, Waived | The decisions of the period: failed checks accepted with conditions, failed checks rejected, and checks waived. |
Rates are computed from totals, never as an average of percentages. A check that was reopened and is waiting for a new result belongs to no period until it is judged again.
Read the charts
Under the tiles, five charts answer where quality is lost. Each has a Data switch that shows the figures as a table, and a button that enlarges it.
| Chart | What it shows |
|---|---|
| Failed checks by control point | Failed checks per control point, largest first, with the cumulative share as a line (a Pareto chart): the first control points explain most of the failures. |
| Open alerts by age, as of today | Open alerts aged 0 - 7 days, 8 - 30 days and over 30 days, counted from their creation. |
| Pass rate by units per product | For each product, the passed and failed share of the units, from the summed quantities of its checks: a product with a check of 18 passed and 2 failed and another of 2 passed and 8 failed is at 20 of 30 units, not at the mean of 90% and 20%. |
| Scorecards by team | For each quality team, the average score of its scorecard checks and its pass rate. |
| Failed share per 7 days, ignores Period | A control chart of the share of failed first inspections over the last 12 periods of 7 days, the last one ending today. It shows the centre line, the upper and lower control limits of each period, and a period outside the limits signals a special cause. A period without any inspection has no point; waived checks are not counted. |
Narrow the figures
- Click the arrow at the right of the search bar to open the filters.
- Choose the Period, a Quality team or a Company.
- Click Filter.
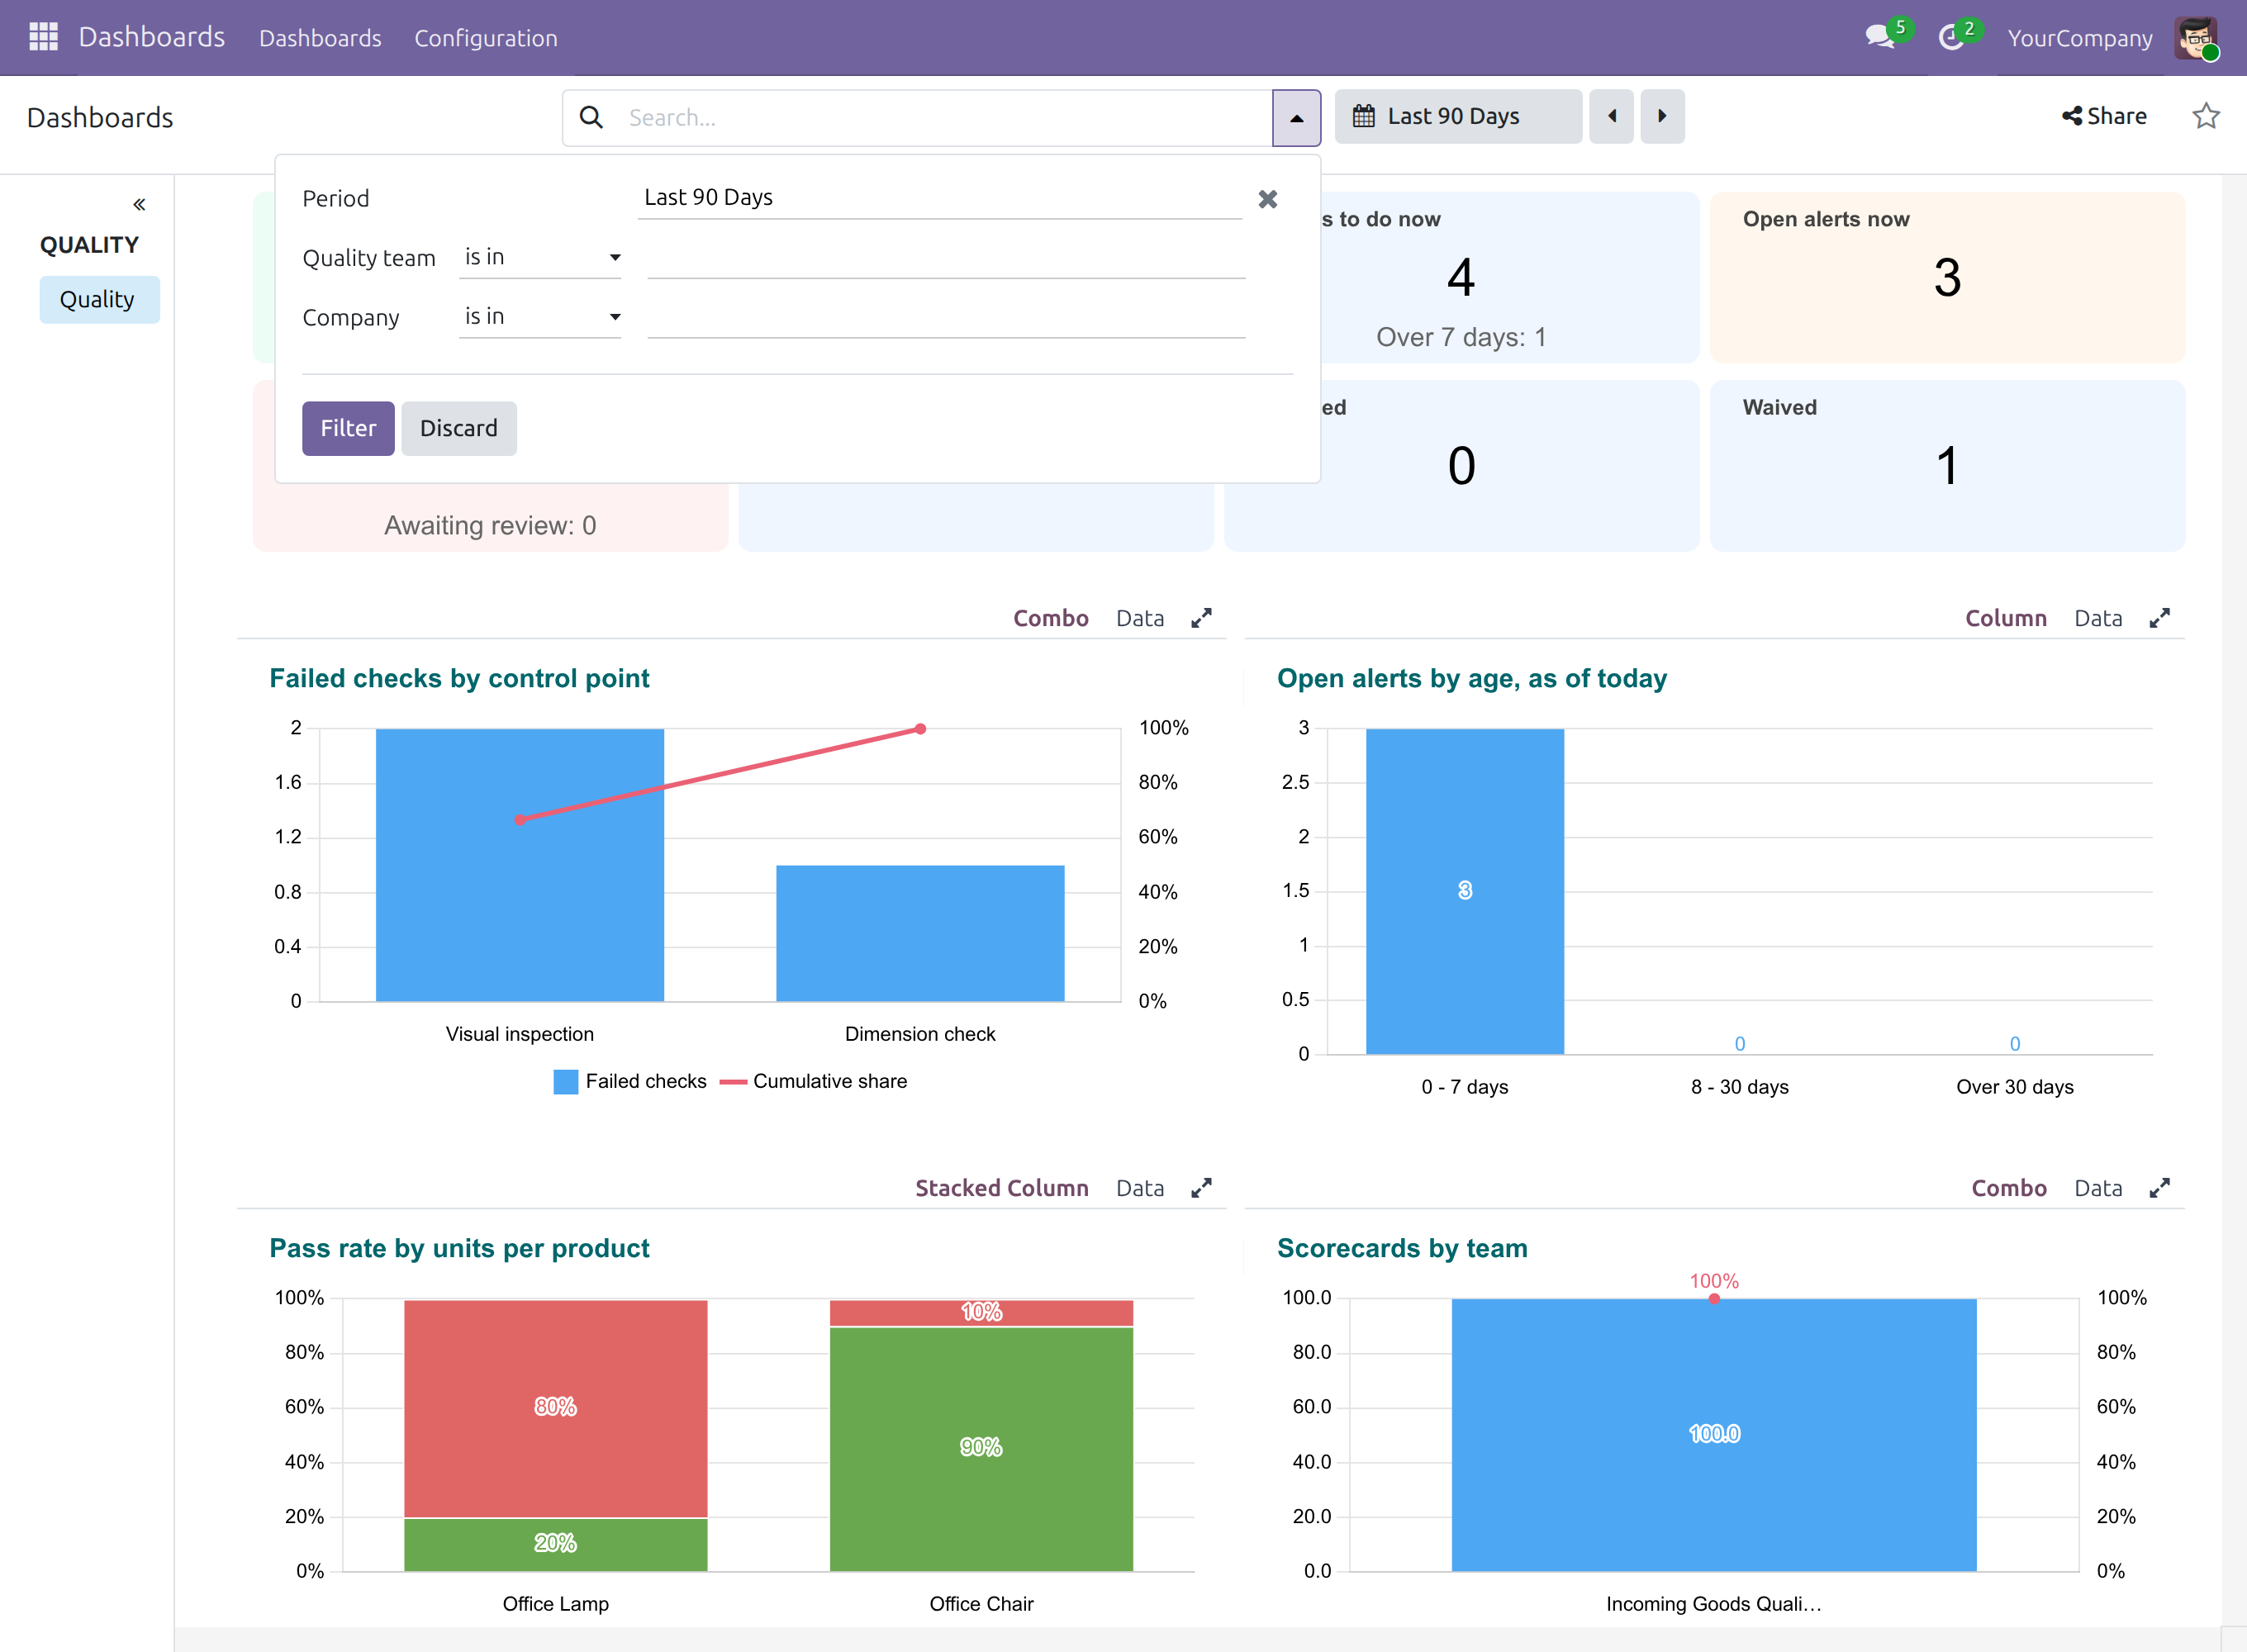
The quality team and company filters apply to every figure. The period applies to the rates, the decisions, the failed checks by control point, the pass rate by units and the scorecards. The tiles Checks to do now, Open alerts now and Overdue actions now, the chart of open alerts by age and the control chart always show the situation of today and ignore the period.
Limits
- A check is counted only for people who can read its source document: two Quality Users can see different figures.
- The spreadsheet area stays light when the interface uses a dark colour scheme.
- A long label under a chart, such as a long team name, can be cut by the chart.
- With few inspections per period the control limits of the control chart sit at 0% and 100%.
Troubleshooting
- The dashboard is not in the left panel of Dashboards
- The user has no Quality access right. Give the user Quality: User or Administrator.
- A tile shows no figure
- No check has a result in the period. Widen the Period.
- A figure is lower than the number of records you know
- The dashboard counts the companies selected in the company switcher, and only the records you can read.
FAQ
- Can I change the charts?
- The dashboard is a ready-made page: you read it and filter it.
- Which period is used by default?
- The last 90 days.
This software and associated files (the "Software") may only be used (executed, modified, executed after modifications) if you have purchased a valid license from the authors, typically via Odoo Apps, or if you have received a written agreement from the authors of the Software (see the COPYRIGHT file).
You may develop Odoo modules that use the Software as a library (typically by depending on it, importing it and using its resources), but without copying any source code or material from the Software. You may distribute those modules under the license of your choice, provided that this license is compatible with the terms of the Odoo Proprietary License (For example: LGPL, MIT, or proprietary licenses similar to this one).
It is forbidden to publish, distribute, sublicense, or sell copies of the Software or modified copies of the Software.
The above copyright notice and this permission notice must be included in all copies or substantial portions of the Software.
THE SOFTWARE IS PROVIDED "AS IS", WITHOUT WARRANTY OF ANY KIND, EXPRESS OR IMPLIED, INCLUDING BUT NOT LIMITED TO THE WARRANTIES OF MERCHANTABILITY, FITNESS FOR A PARTICULAR PURPOSE AND NONINFRINGEMENT. IN NO EVENT SHALL THE AUTHORS OR COPYRIGHT HOLDERS BE LIABLE FOR ANY CLAIM, DAMAGES OR OTHER LIABILITY, WHETHER IN AN ACTION OF CONTRACT, TORT OR OTHERWISE, ARISING FROM, OUT OF OR IN CONNECTION WITH THE SOFTWARE OR THE USE OR OTHER DEALINGS IN THE SOFTWARE.