Helpdesk Dashboard
by Viindoo
| Lines of Code | 327 |
| Technical name | viin_spreadsheet_dashboard_helpdesk |
| License | OPL-1 |
| Website | https://viindoo.com/apps/modules/19.0/viin_spreadsheet_dashboard_helpdesk?force_show=1 |
| Read description for | v 17.0 v 18.0 |
| Required Apps | Discuss (mail) |
| Included Dependencies | Helpdesk Viindoo Base |

Read how your support desk is doing, next to sales and finance
For support managers and team leaders who report on their desk
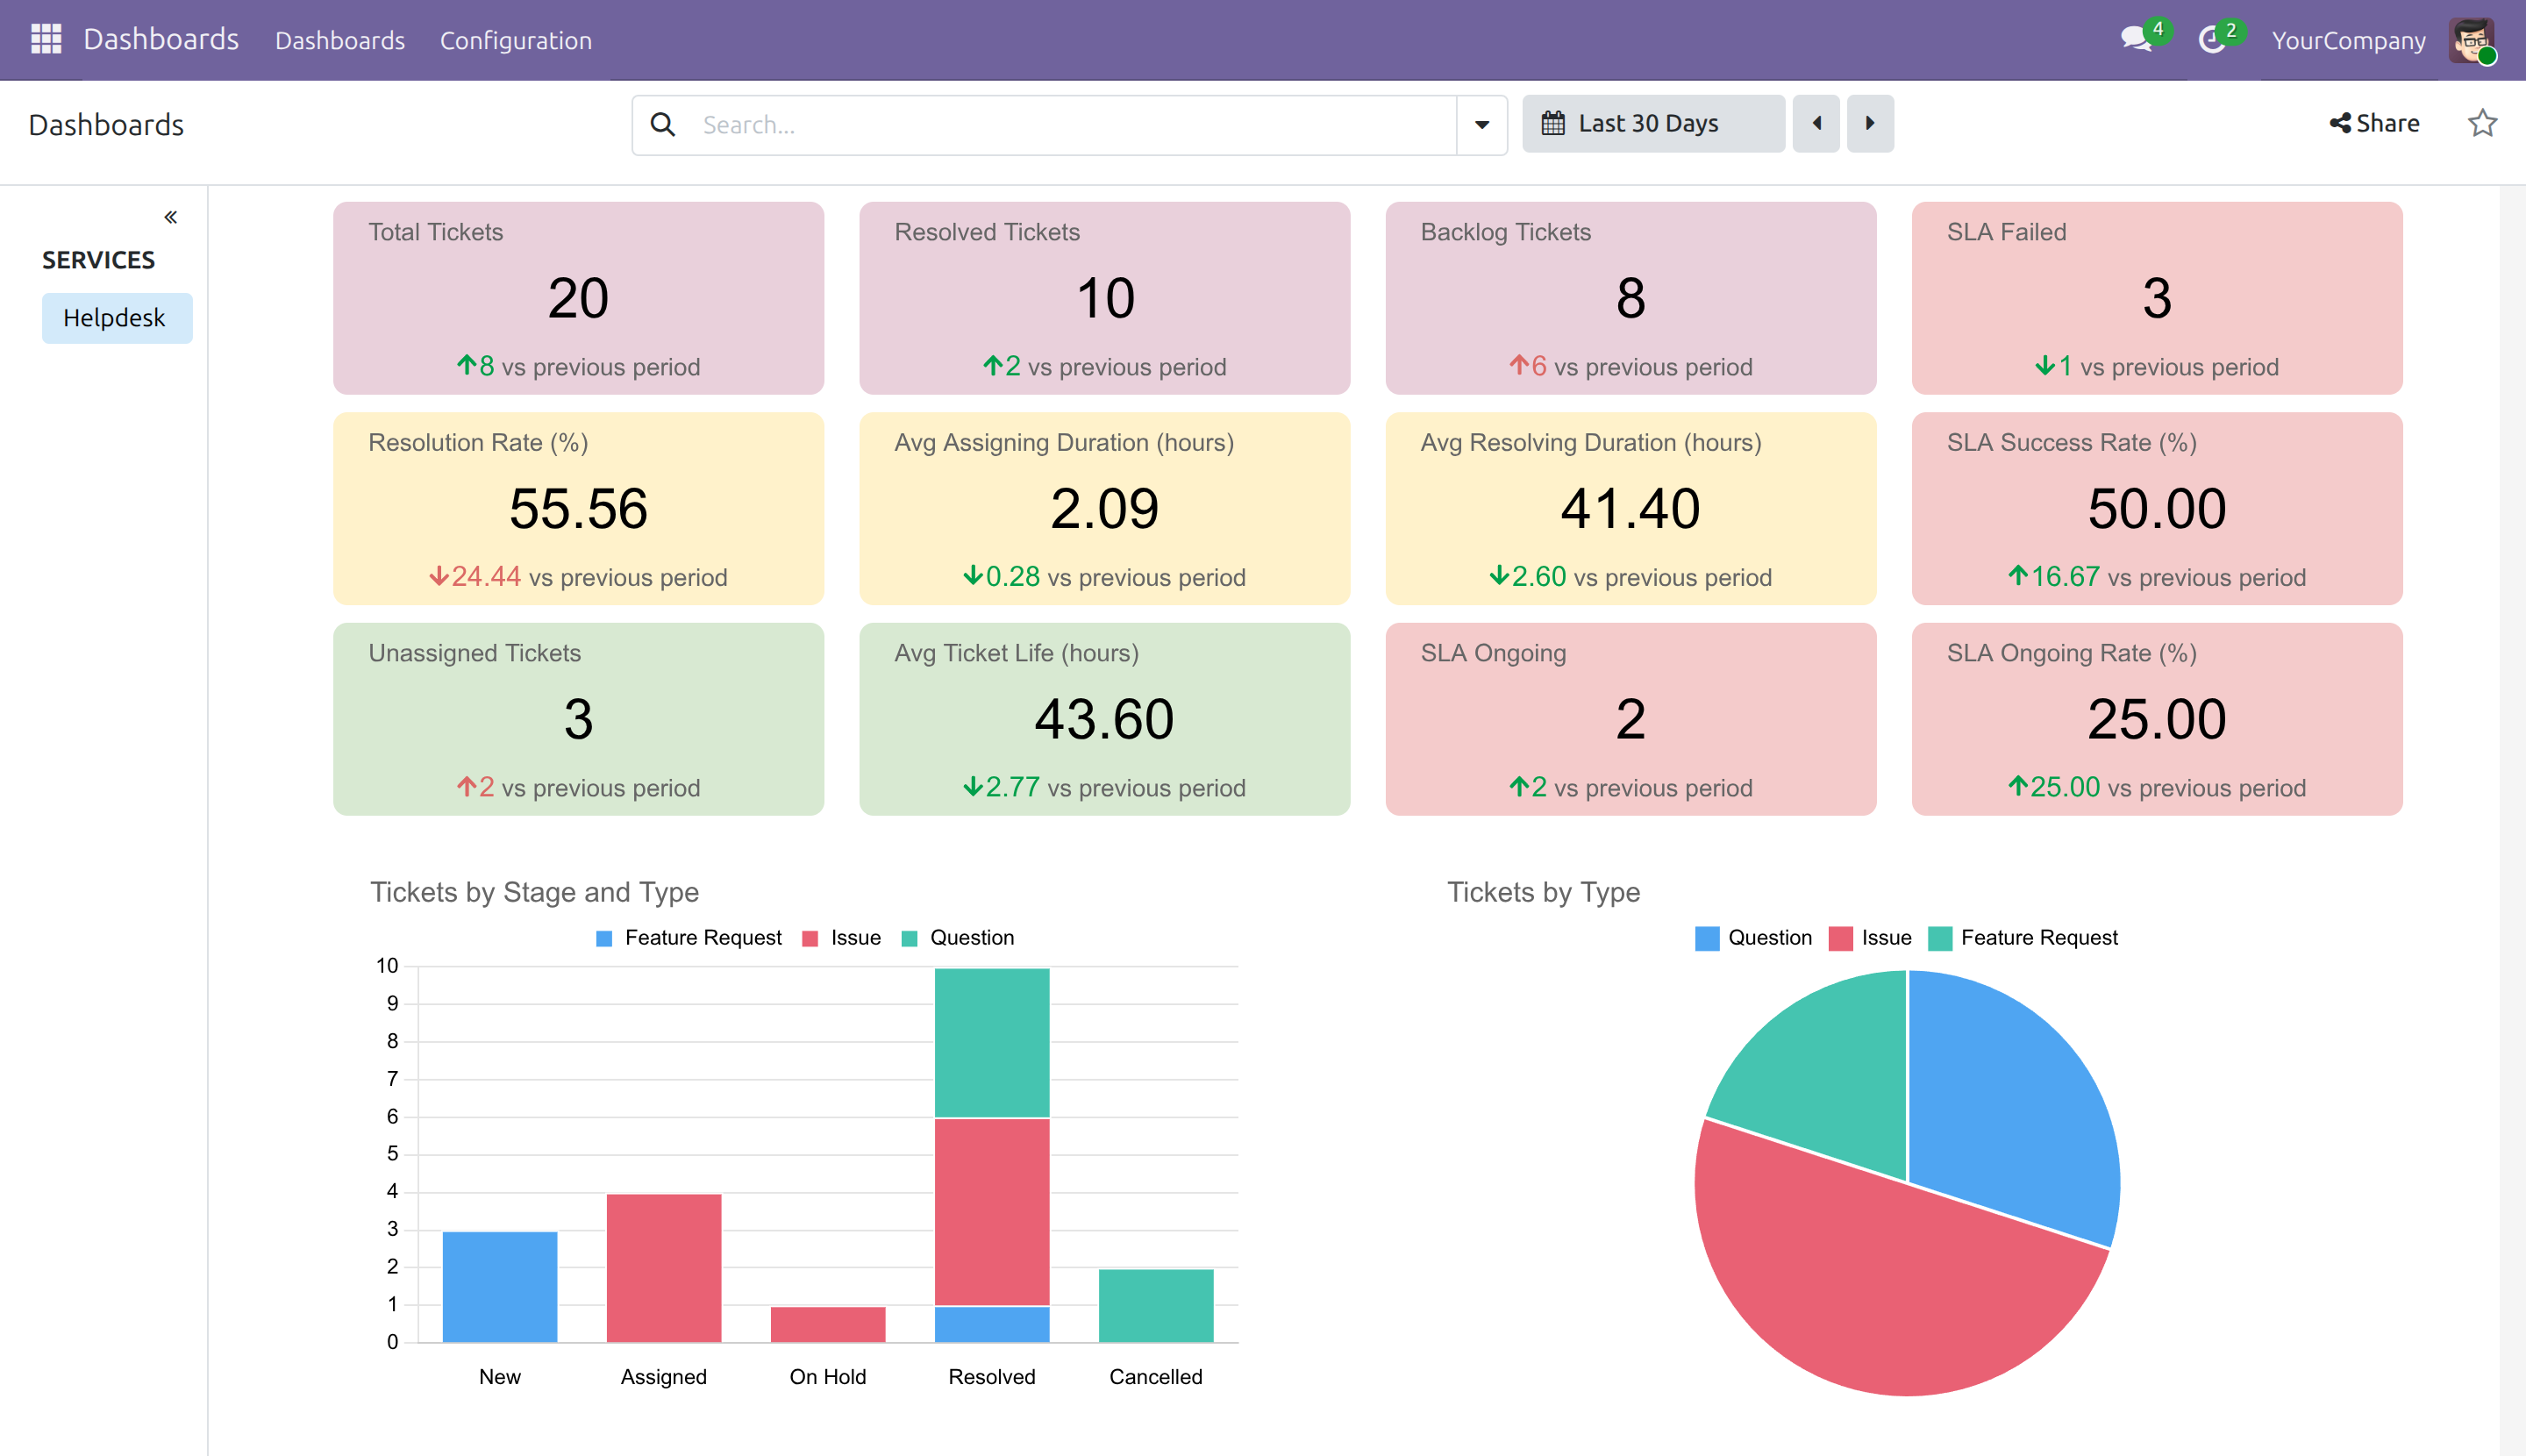
Add Helpdesk statistics to the Dashboard to visualize its data.
Odoo 19.0 · Community · Enterprise · OPL-1
Extends Helpdesk: its tickets and SLA deadlines feed the dashboard.
What changes for your team
Support figures sit where the company already reads its numbers
Before each review, someone counts tickets, resolutions and missed deadlines by hand and pastes them into a slide.
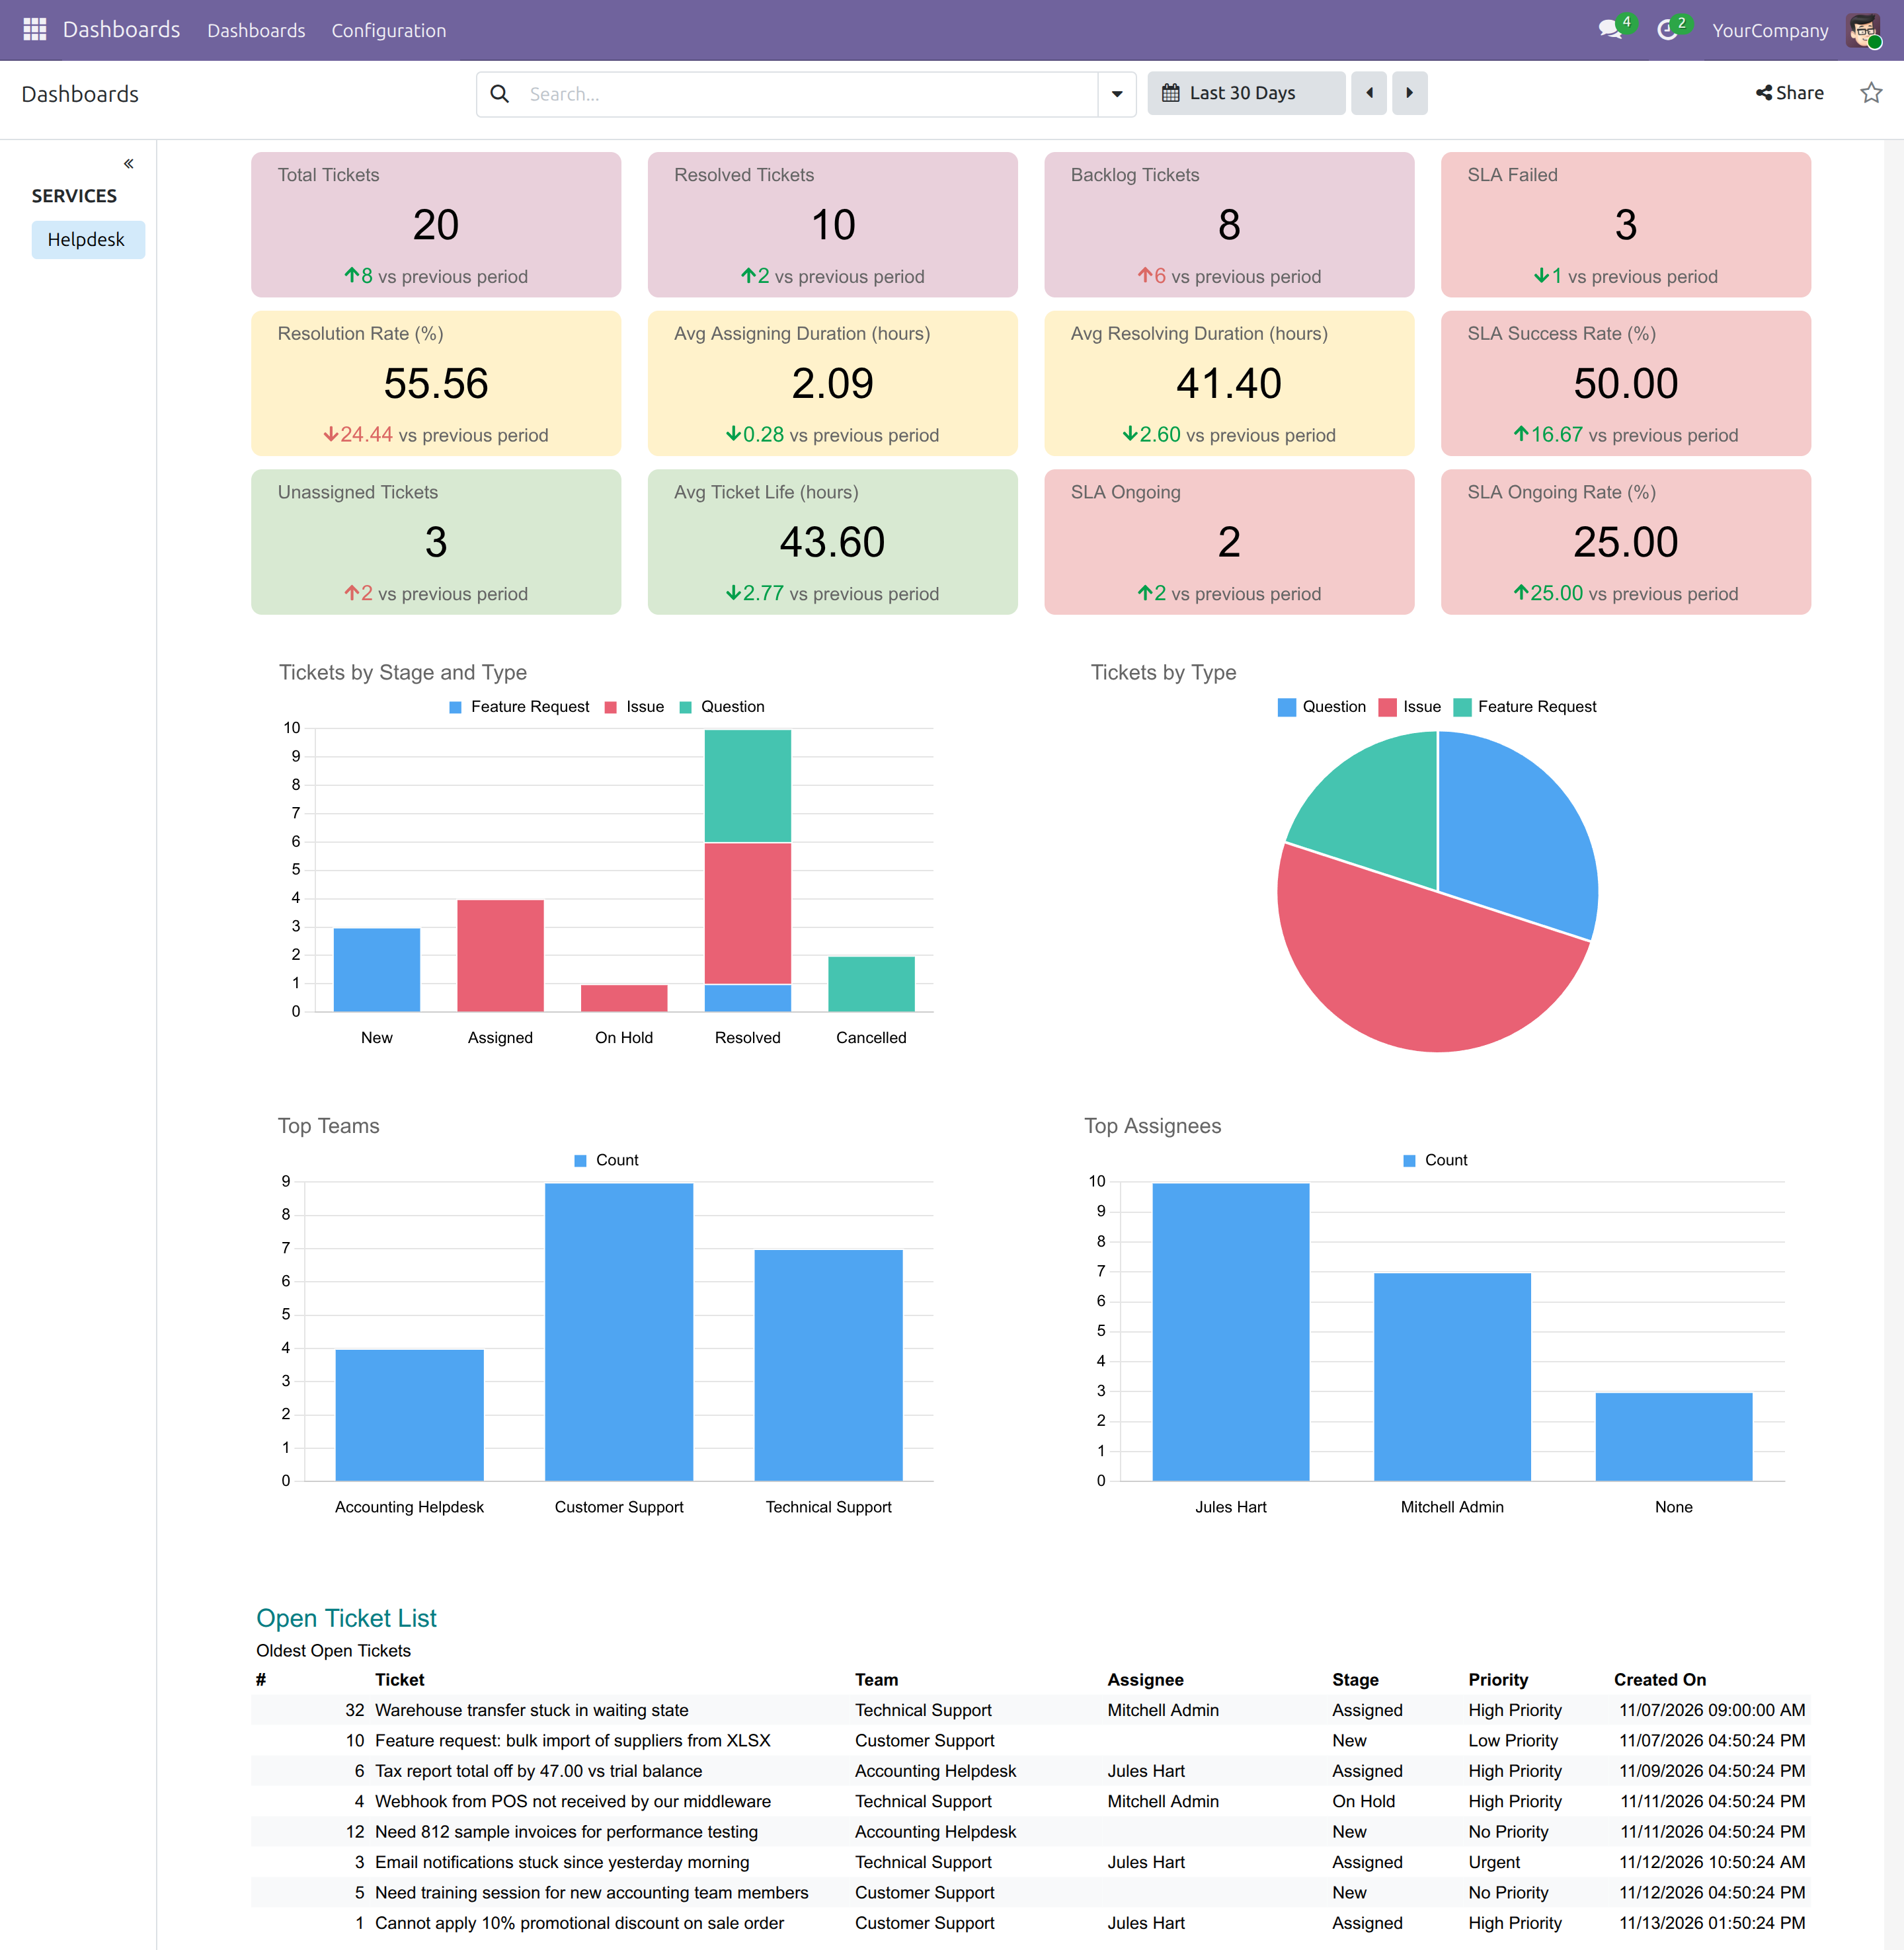
→ The Dashboards application gets a Helpdesk dashboard under Services: ticket counts, resolution rate, average assigning and resolving times, SLA results, charts by stage, type, team and assignee. Each card shows the change against the previous period of the same length; a duration with no ticket to average stays blank rather than reading zero.
Each team leader reads their own team
Team figures are cut out of a shared export, and nobody is sure which tickets were counted.
→ Filter by team, assignee or stage, and the cards, charts and ticket list follow; the SLA cards follow the period and the team. Each person counts only the tickets they may see in Helpdesk.

The backlog has names on it
A backlog figure says how many tickets wait, not which ones have waited longest.
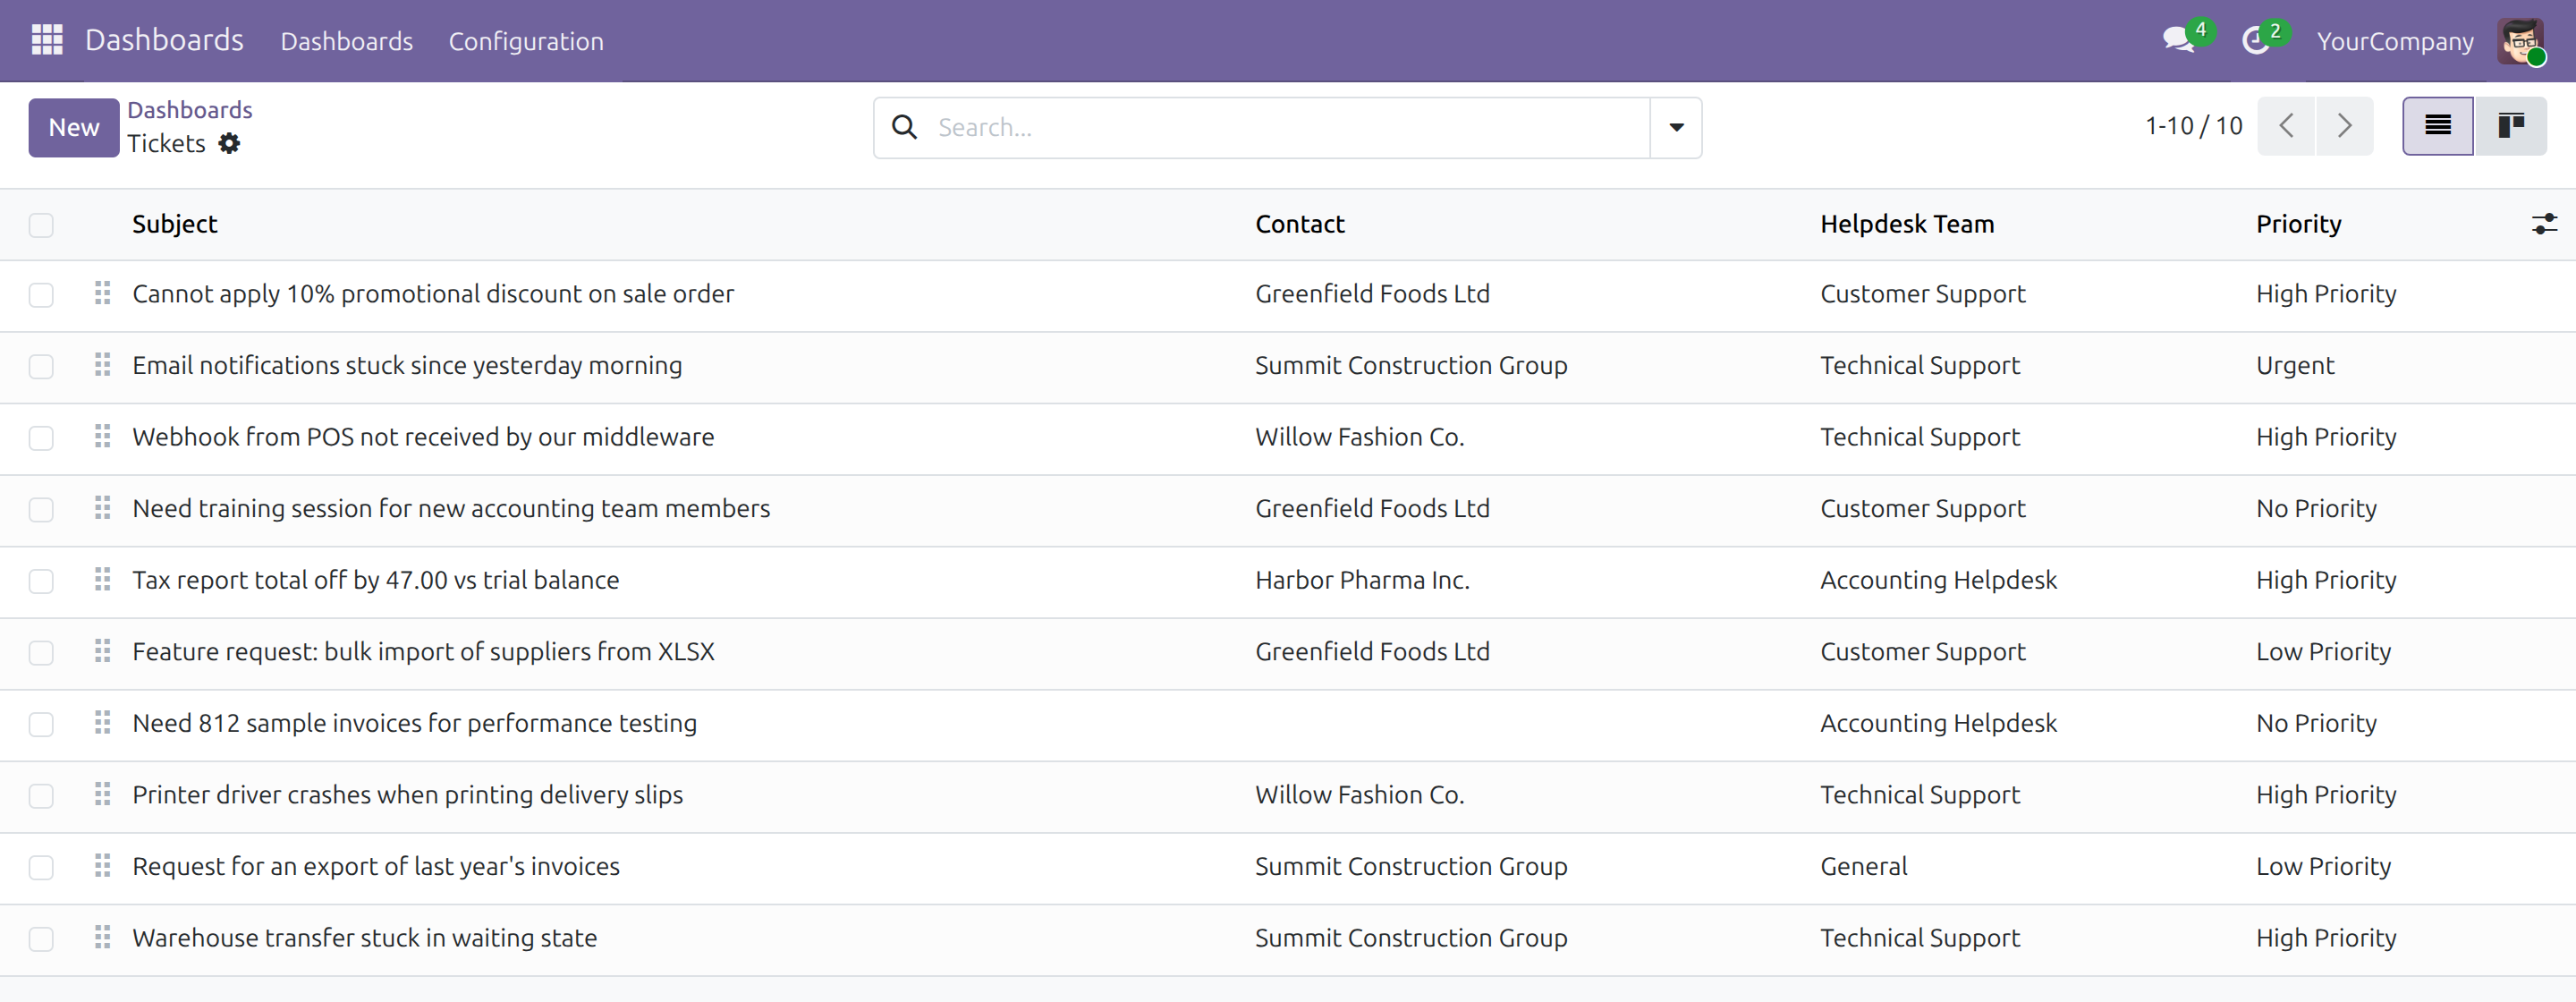
→ The dashboard lists the oldest open tickets of the period with their team, assignee, stage and priority. Its title opens the ticket list of every open ticket, ready to work on.
Ready on day one
The dashboard, built
Cards, charts and the open-ticket list ship ready, with the date, team, assignee and stage filters. It opens on the last 7 days.
Installs by itself
When Helpdesk and the Dashboards application are both in the database, the dashboard is installed with them.
What you set up first
Check which Helpdesk stages are folded and which are cancelled stages: the figures read Open, Done and Cancelled from them. The SLA cards need SLA policies in Helpdesk.
What is included
One Helpdesk dashboard in the Dashboards application, open to every internal user, built on the tickets and SLA deadlines of Helpdesk. It reports only: teams, stages and SLA policies are managed in Helpdesk.
Before you decide
Who sees which figures?
Every internal user opens the dashboard, and the figures count the tickets that person may see in Helpdesk: administrators the whole desk, team leaders their teams, agents their own tickets and the ones they follow.
How are resolved tickets, backlog and resolution rate counted?
A ticket belongs to the period it was created in. Resolved counts Done tickets, Backlog counts Open tickets, and the resolution rate divides Done tickets by the tickets that are not Cancelled. Rates show two decimals.
How are the SLA figures counted?
A deadline that has passed without being reached counts as failed; the success rate is deadlines met out of deadlines met or failed. The SLA cards follow the period and the team filter, not the assignee or stage filters, and read 0 when no SLA policy applies.
Does it change Helpdesk or send data elsewhere?
No. It reads the tickets and SLA deadlines already in your database and adds no step to the work of the desk.
Which languages does it ship?
English and Vietnamese.
Try it, then ask us
The Documentation tab explains every card for the helpdesk manager, the team leader and the support agent; Live Preview opens a demo database.
Pre-sales & partnership
viindoo.com/contactusTechnical support
viindoo.com/ticketTechnical requirements
- Odoo version: 19.0
- Editions: Community, Enterprise
- Required modules: Helpdesk, Spreadsheet dashboard
- License: OPL-1
- Languages: English, Vietnamese
Helpdesk Dashboard
Note
This guide is for helpdesk managers who make the dashboard available and follow the whole helpdesk, and for team leaders and support agents who follow their own tickets.
Note
Extends Helpdesk - see its documentation: Helpdesk.
Overview
Support performance is often discussed from figures that somebody assembled by hand. Helpdesk Dashboard adds a Helpdesk dashboard to the same Dashboards application that holds the sales, invoicing and inventory dashboards. One screen shows how many tickets came in, how many are done, how fast they were assigned and resolved, how the service level agreements (SLA) are met, and which open tickets have waited longest. Every figure is compared with the previous period of the same length.
The dashboard only reports. Stages, SLA policies and teams stay in Helpdesk.
The dashboard uses the statuses of Helpdesk. A ticket is Open while its stage is not folded. It is Done when its stage is folded and not a cancelled stage (by default Resolved), and Cancelled when its stage is a cancelled stage. Closed means Done or Cancelled.
| Role | What they do | Access right to assign |
|---|---|---|
| Helpdesk manager | Makes the dashboard available to the team and follows the figures of the whole helpdesk. | Administrator, in the Helpdesk field of the user |
| Team leader | Follows the figures of the teams they lead. | User, in the Helpdesk field of the user, and named as the Leader of the team |
| Support agent | Follows the tickets assigned to them or created by them. | User, in the Helpdesk field of the user |
Setup (for the Helpdesk manager)
Install the dashboard
The dashboard installs together with Helpdesk when the Dashboards application is also installed. If it is not there yet:
- Go to Apps.
- Search for Helpdesk Dashboard.
- Press Install.
Choose which stages are done and cancelled
The figures follow the stages. Go to Helpdesk ‣ Configuration ‣ Stages and, for each stage, tick Folded when tickets in it are closed, and Cancelled Stage when they are closed without being resolved (the option is offered on a folded stage). A folded stage that is not a cancelled stage makes its tickets Done.
Choose who follows the figures
Every internal user can open Dashboards, Services, Helpdesk. What the figures count depends on the user's access right in Helpdesk:
- Administrator: every ticket of the company.
- User who is the Leader of a team: every ticket of that team, plus the tickets assigned to or created by the user.
- User: the tickets assigned to the user, created by the user, followed by the user, and the tickets of the teams the user follows when the team is visible to employees.
To give a person an access right, go to Settings ‣ Users & Companies ‣ Users, open the user and set the Helpdesk field.
Helpdesk manager: follow the whole helpdesk
Open the dashboard and choose a period
- Go to Dashboards.
- In the left column, under Services, select Helpdesk.
- Press the period button (it shows Last 7 Days at first) and choose Last 30 Days, or any other period.
The figures, the charts and the ticket list follow the period. A ticket belongs to the period in which it was created.
Read the scorecards
Each card shows the figure for the period and, under it, the difference from the previous period of the same length. The arrow tells whether the figure went up or down, and its colour tells whether that is better. On the cards where a lower figure is better (Backlog Tickets, Unassigned Tickets, SLA Failed and the three average durations) a fall is green and a rise is red; on the other cards a rise is green and a fall is red. The percentages and their differences show two decimals.
| Card | What it shows |
|---|---|
| Total Tickets | Tickets created in the period, whatever their status. |
| Resolved Tickets | Tickets of the period that are Done. |
| Backlog Tickets | Tickets of the period that are Open. |
| Unassigned Tickets | Tickets of the period that have no assignee, whatever their status. |
| Resolution Rate (%) | Done tickets divided by the tickets that are not Cancelled (total minus Cancelled), as a percentage. It is 0.00 when the period has no ticket to count. |
| Avg Assigning Duration (hours) | Average time from creation to assignment, over the tickets of the period that have been assigned. |
| Avg Resolving Duration (hours) | Average time from assignment to closing, over the Done tickets of the period. |
| Avg Ticket Life (hours) | Average time from creation to closing, over the Done tickets of the period. |
| SLA Failed | SLA deadlines missed on the tickets of the period, including deadlines that have passed on a ticket that has not reached them. |
| SLA Success Rate (%) | SLA deadlines met, out of the deadlines met or missed. |
| SLA Ongoing | SLA deadlines still running. |
| SLA Ongoing Rate (%) | Running deadlines out of all SLA deadlines of the period. |
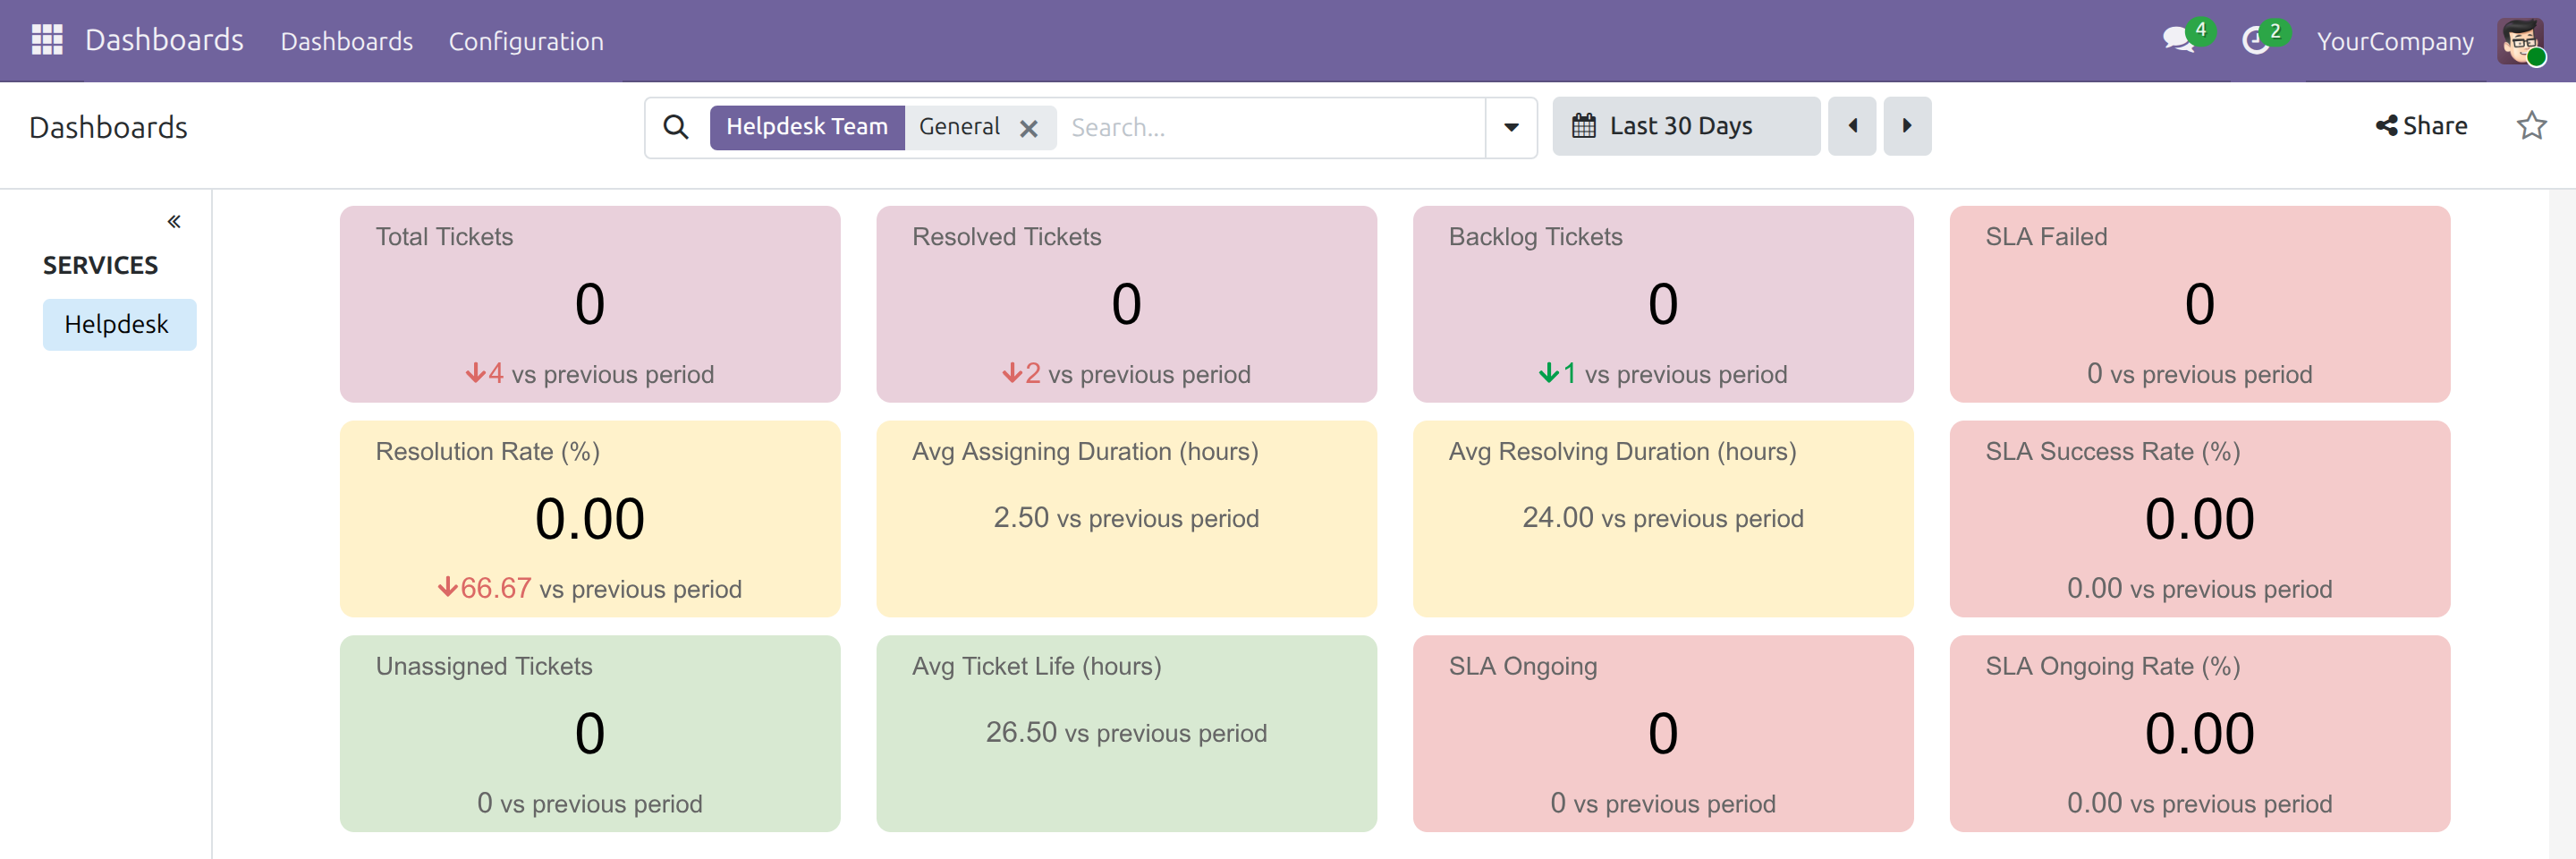
A count card reads 0 when there is nothing to count. A duration card has nothing to average when the period has no ticket it applies to: it shows no figure and no arrow, and its second line gives only the average of the previous period (see A period without tickets).
Read the charts and the ticket list
Below the cards:
- Tickets by Stage and Type: tickets in each stage, split by ticket type.
- Tickets by Type: the share of each ticket type.
- Top Teams: tickets per team.
- Top Assignees: tickets per assignee; None counts the tickets nobody has taken yet.
- Open Ticket List: the oldest Open tickets of the period, with their team, assignee, stage, priority and creation date. It never lists a Done or Cancelled ticket, so it holds the same tickets as Backlog Tickets (up to 15 rows).
Open the tickets behind the list
Select the Open Ticket List title. The Open tickets open in a ticket list, with a Dashboards link in the breadcrumb to come back. The list holds every Open ticket you may see, with no search filter: it does not use the period or the filters of the dashboard, so it can hold more tickets than the dashboard's own list.
Team leader and support agent: follow your own tickets
Narrow the dashboard to a team, an assignee or a stage
- Open Dashboards, Services, Helpdesk.
- Press the arrow at the right end of the search box to open the filter panel.
- In Helpdesk Team, Assignee or Stage, type a name and pick it. You can pick several values in one filter.
- Press Filter.
The filter appears as a facet in the search box. The cards, the charts and the ticket list count only the matching tickets, except the four SLA cards: they follow the period and the Helpdesk Team filter, and ignore Assignee and Stage. Remove the facet to go back to all the tickets you may see.
A period without tickets
When the period (or the filter) holds no ticket, every count shows 0 and the arrows compare it with the previous period. A duration card has no ticket to average, so it shows no figure and no arrow; it shows only the previous period's average, for example "2.50 vs previous period". The previous period still has its tickets, so the percentages show their fall.
Troubleshooting
- The Helpdesk dashboard is not under Services.
- Helpdesk or the Dashboards application is not installed in the database, or the dashboard is not installed yet. See Install the dashboard.
- All count cards show 0.
- No ticket of the period matches the filters, or the user cannot see any ticket. Choose a longer period, remove the filters, and check the user's access right in Helpdesk.
- A duration card shows no figure.
- The period has no ticket the average applies to: no assigned ticket for the assigning duration, no Done ticket for the resolving duration and the ticket life. Choose a longer period.
- The SLA cards show 0, although a filter leaves no ticket.
- They ignore the Assignee and Stage filters. They show 0 when no SLA policy applies to the tickets of the period and the team.
- A colleague sees other figures.
- The figures count the tickets each person may see in Helpdesk. See Choose who follows the figures.
- A ticket is in the Open Ticket List but I expected it to be closed.
- A ticket is Open until its stage is folded. Check the Folded and Cancelled Stage options of its stage under Helpdesk ‣ Configuration ‣ Stages.
FAQ
- Which period is shown first?
- The last 7 days. The period button changes it for the current visit.
- Which tickets are in the average durations?
- The assigning duration is averaged over the tickets of the period that have been assigned, Open, Done or Cancelled. The resolving duration and the ticket life are averaged over the Done tickets only; a Cancelled ticket has neither.
- Are Cancelled tickets in the Resolution Rate?
- No. The rate is Done tickets divided by the tickets that are not Cancelled.
- Can I share the dashboard or add figures to it?
- The Share button and the star belong to every dashboard of the Dashboards application. The dashboard is a spreadsheet, so its figures can be traced and extended with the application's own tools.
This software and associated files (the "Software") may only be used (executed, modified, executed after modifications) if you have purchased a valid license from the authors, typically via Odoo Apps, or if you have received a written agreement from the authors of the Software (see the COPYRIGHT file).
You may develop Odoo modules that use the Software as a library (typically by depending on it, importing it and using its resources), but without copying any source code or material from the Software. You may distribute those modules under the license of your choice, provided that this license is compatible with the terms of the Odoo Proprietary License (For example: LGPL, MIT, or proprietary licenses similar to this one).
It is forbidden to publish, distribute, sublicense, or sell copies of the Software or modified copies of the Software.
The above copyright notice and this permission notice must be included in all copies or substantial portions of the Software.
THE SOFTWARE IS PROVIDED "AS IS", WITHOUT WARRANTY OF ANY KIND, EXPRESS OR IMPLIED, INCLUDING BUT NOT LIMITED TO THE WARRANTIES OF MERCHANTABILITY, FITNESS FOR A PARTICULAR PURPOSE AND NONINFRINGEMENT. IN NO EVENT SHALL THE AUTHORS OR COPYRIGHT HOLDERS BE LIABLE FOR ANY CLAIM, DAMAGES OR OTHER LIABILITY, WHETHER IN AN ACTION OF CONTRACT, TORT OR OTHERWISE, ARISING FROM, OUT OF OR IN CONNECTION WITH THE SOFTWARE OR THE USE OR OTHER DEALINGS IN THE SOFTWARE.