The right metrics for business owners are few: a handful of numbers, each compared with a target, each tied to a decision. The hard part is not knowing which numbers matter. It is finding the time to look at them when every signature, approval and question still lands on your desk.
This article is the first in the Viindoo by role series. It covers two things a business owner needs together: the set of numbers that runs the company, and the way to let routine work run on rules so you have time for those numbers. Watch the two-minute video first, then read the details below.

Video: Less daily firefighting, more time for strategy (2 minutes).

Video: Less daily firefighting, more time for strategy (2 minutes).
Why the owner becomes the bottleneck
In a small or mid-sized company, the owner sets the strategy and runs daily operations at the same time. Sales waits for a price decision, the factory waits for a go-ahead, accounting waits for a signature, and every report starts with someone asking for numbers. Each request is small. Together they fill the week.
You keep two jobs: setting the direction and handling the exceptions. Everything else should run on rules you set once.
This is the idea behind management by exception: the owner sees what is off target, not everything that happens. It only works if two things are in place: a short list of numbers with clear targets, and a system that routes routine work without you.
15 metrics for business owners, and the decision behind each
Three rules make a short list of metrics for business owners useful: look at few numbers; always compare each one with a benchmark (plan, same period last year, or a safety threshold); and only dig deeper when a number is off. The table groups the metrics into results, cash, customers, operations and people.
| Metric | How to read it | What you decide | How often |
|---|---|---|---|
| Revenue against plan and last year | On track or not; growth from existing or new customers | Adjust sales targets, shift resources | Monthly |
| Gross margin: total, by product, by customer | Revenue up but margin down means cheaper selling or higher costs | Pricing, supplier negotiation, product mix | Monthly |
| Net profit and break-even point | How far from break-even; are fixed costs growing | Cut or keep costs, invest more | Monthly |
| Cash on hand and cash flow | Profit on paper can still mean no cash | Working capital loans, delay spending | Weekly |
| Receivables, overdue part, days sales outstanding (DSO) | Which customers hold your cash, and for how long | Collections, credit limits, payment terms | Weekly |
| Inventory value and slow-moving stock | How much cash sits in the warehouse | Buy less, clear stock, reset stock levels | Monthly |
| Payables and days payable outstanding (DPO) | Paying faster or slower than you collect | Balance the timing of cash in and out | Monthly |
| Share of the top 5 customers | Depending on a few customers is a risk | Find new customers, protect key accounts | Quarterly |
| Open pipeline and win rate | Is revenue for the next 1-3 months secure | Push sales, prepare capacity | Monthly |
| Repeat customers and complaints | The health of customer relationships | Fix the root cause of churn | Quarterly |
| On-time delivery and late orders | Reputation; late because of materials, machines or people | Remove bottlenecks, reallocate resources | Weekly |
| Factory load against capacity | Can you take more orders | Overtime, new machines, reschedule | Weekly |
| Defect rate and rework cost | How much is lost by doing things wrong | Improve processes, change suppliers | Monthly |
| Labor cost against revenue | Is productivity keeping up with growth | Hire more or raise productivity | Monthly |
| Turnover in key positions | Risk of losing people and know-how | Retention, train successors | Quarterly |
Not every one of these metrics for business owners needs a screen of its own. What matters is that each metric has an owner, a benchmark and a review rhythm. Companies that set yearly goals often turn the most important of these numbers into OKRs and cascade them to departments.
Four layers that free the owner
Knowing the metrics for business owners is half of the job. The other half is making room to use them. On Viindoo, that room comes from four layers, each built on features you configure once.
The company runs on rules
Only big decisions reach you
Know without asking
Time to set direction
1. The company runs on rules
When a product is set up to be made to order, confirming a sales order creates the manufacturing order and the material demand right away. Nobody walks into your office to ask for a go-ahead.
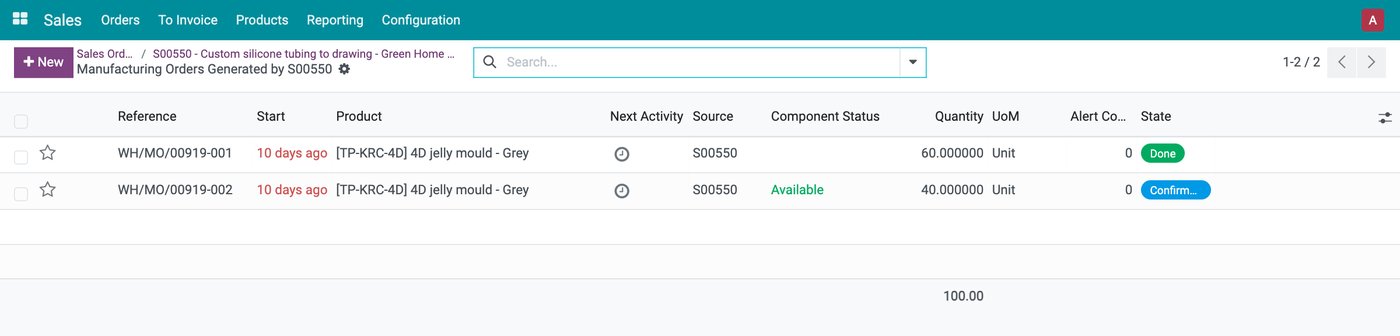
Manufacturing orders generated from the sales order (sample data).
Production requests and stock requests go through OmniApproval, where each request type has its own approvers, such as the head of the department. Leave requests follow the approval flow of the Time Off app. Equipment with a preventive maintenance cycle gets its maintenance requests generated on schedule, and every sales opportunity carries a planned next activity.
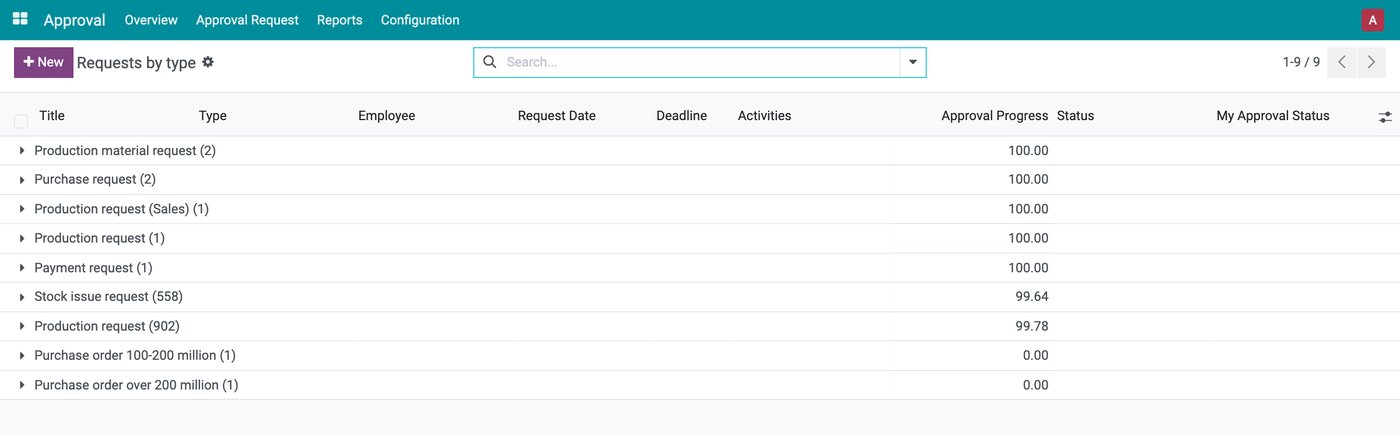
Each request type has its own approval flow; most never reach the owner.
2. Only big decisions reach you
The company decides which requests need approval, from what amount, who approves and in how many levels, and can change these rules at any time. In the example below (sample data), purchases under 100 million dong stay in the department, purchases up to 200 million go to the chief accountant, and only larger ones reach the director after the chief accountant.
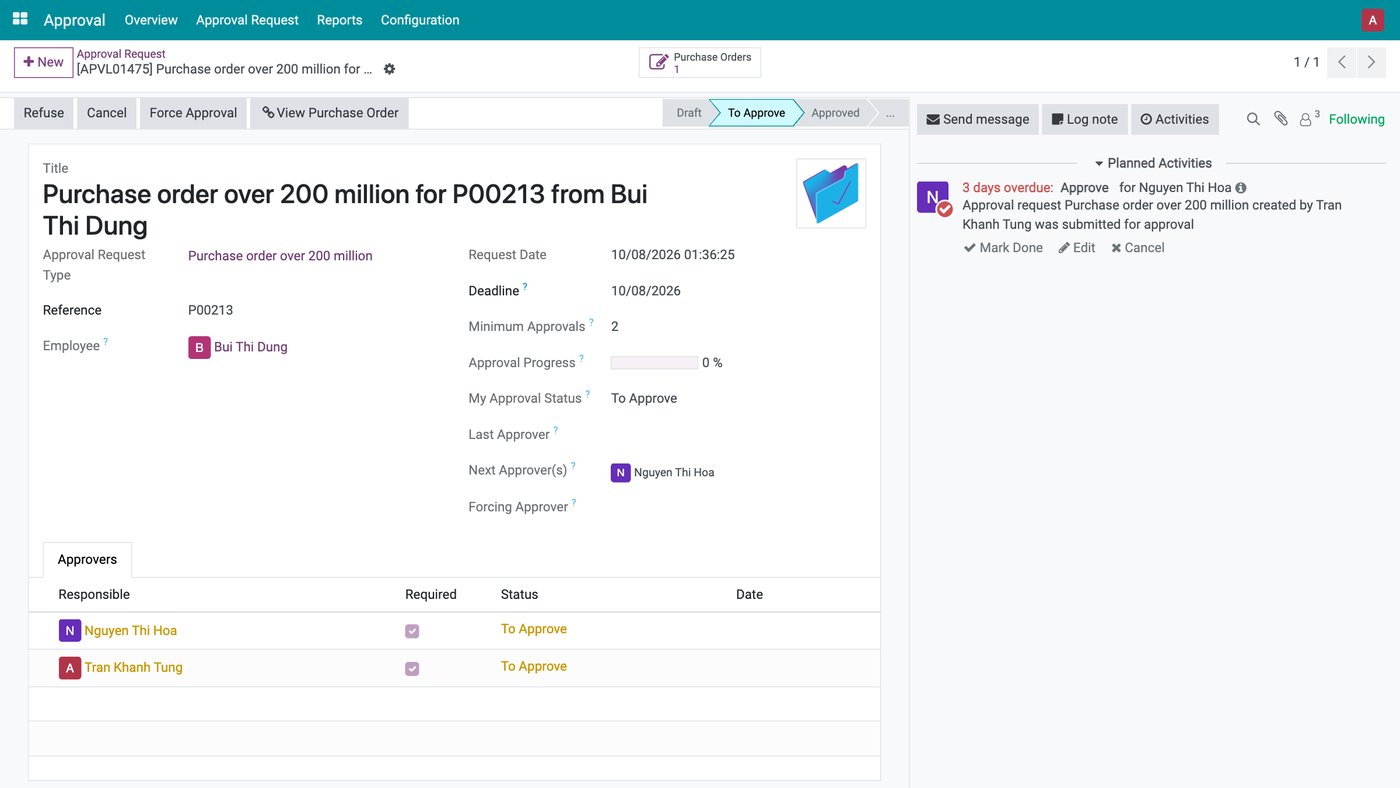
A large purchase order waiting for two approvers (sample data).
You can also sign purchase orders and contracts away from the office, in the browser on your phone or with a SIM-based digital signature.
3. Know without asking
The numbers come to you. A periodic email digest summarizes new leads, won opportunities, sales and revenue. The sales dashboard shows revenue with the change against the previous period and a monthly trend.
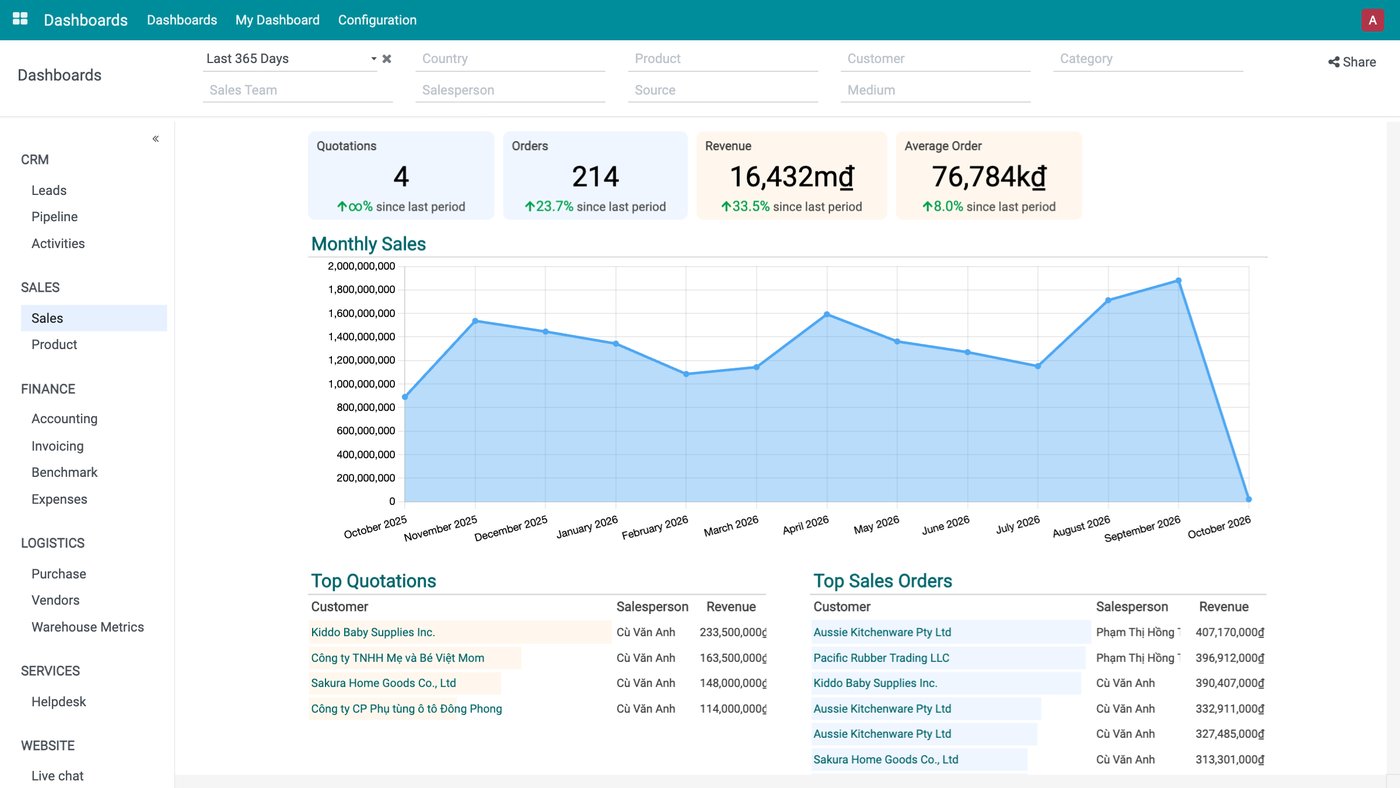
Sales dashboard: revenue and average order, each compared with the previous period (sample data).
The finance dashboard puts gross margin, net profit, cash in and out, days sales outstanding and days payable outstanding side by side with last year. The aged receivables report breaks overdue amounts down by customer, and follow-up levels remind customers in stages. When you need something fast, you can ask the AI assistant by voice; it answers only with data you are allowed to see.
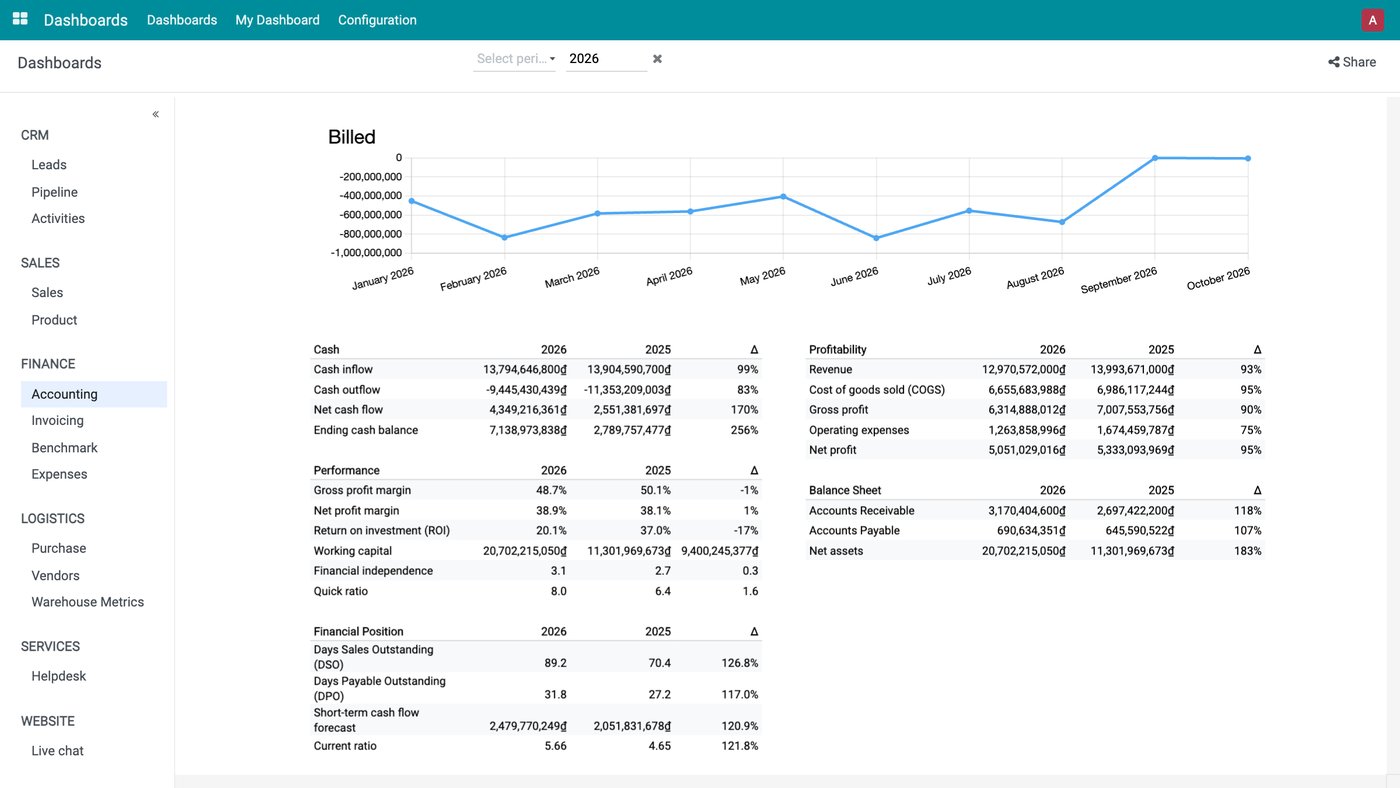
Finance dashboard: this year against last year (sample data).
4. Time to set direction
With that time freed up, you work on the big questions. In the OKR app, company goals cascade to departments and employees, and progress is rolled up from weighted key results. In the example, the US and Australia market goal is on track while the gross margin goal is lagging, so you know who to sit down with.
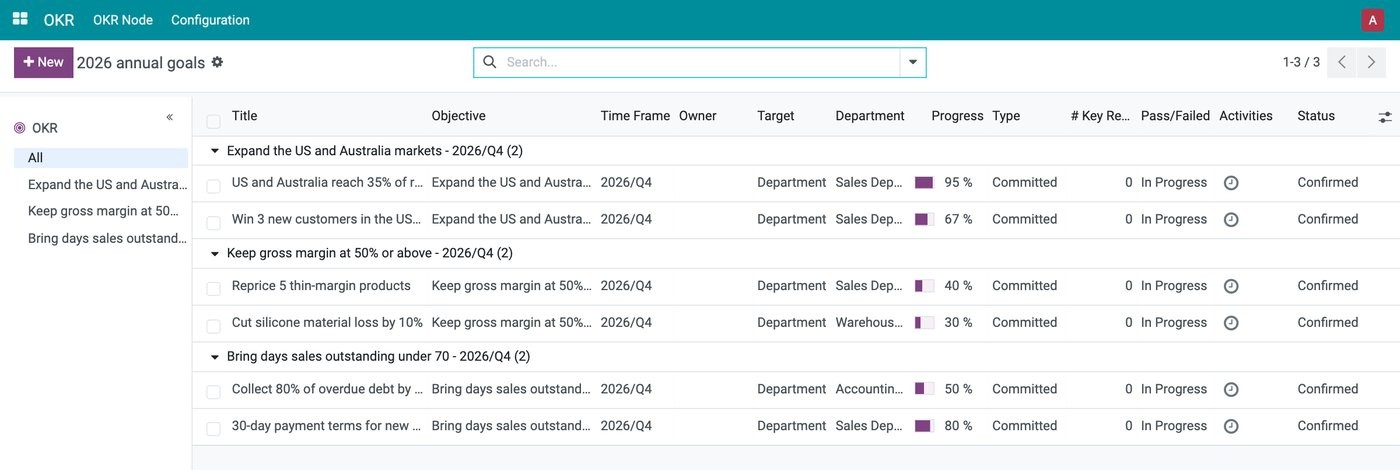
Annual goals by department, with progress for each (sample data).
Then look at the company through the numbers that set direction: revenue by market over several quarters, gross profit by product. In the example, revenue is shifting from Japan and Korea to the US and Australia, and one best seller has thin margins. That is when you decide which markets to back and which products to keep or change.
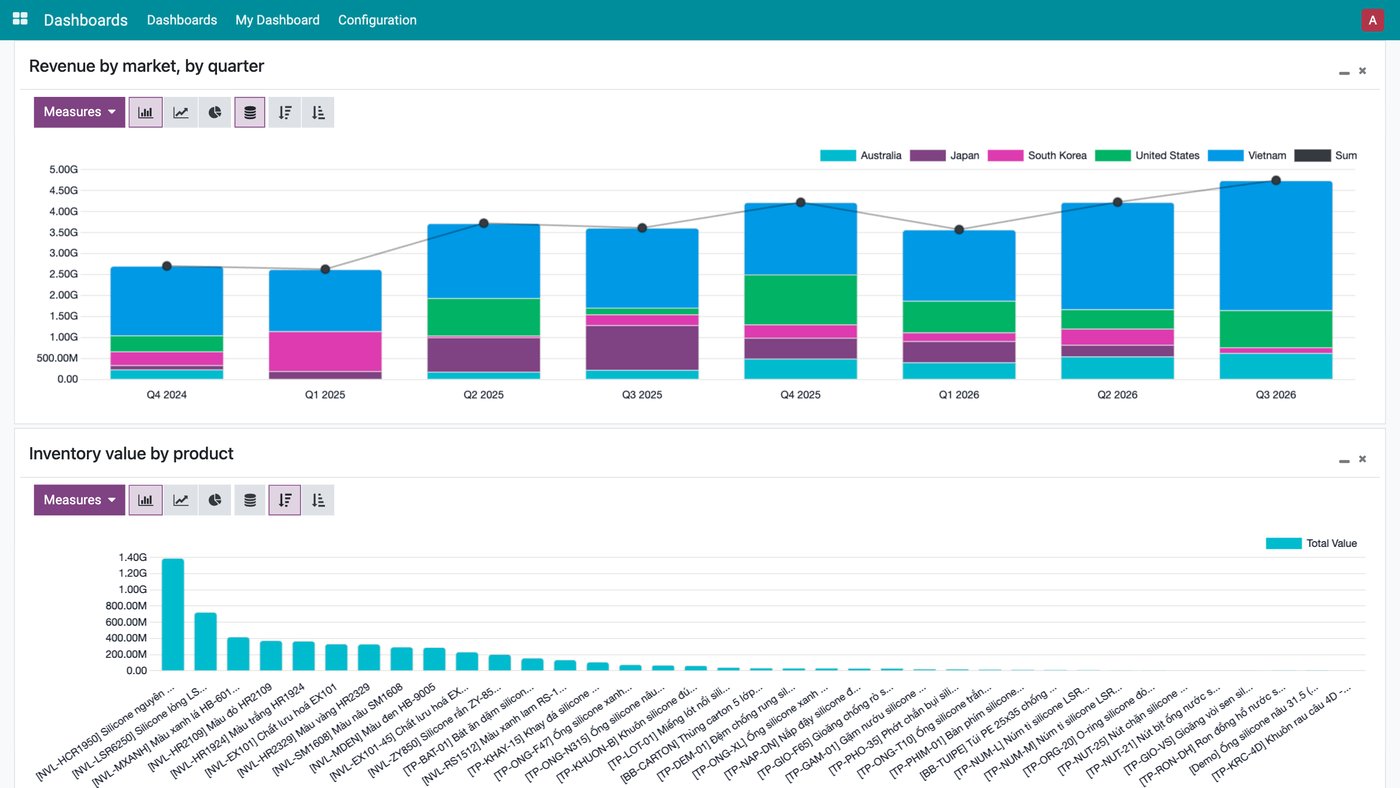
Revenue by market by quarter, pinned to the owner's own dashboard (sample data).
What is ready-made, and what you combine
Being honest about this saves time during implementation. On Viindoo, the 15 metrics for business owners above fall into three groups:
Ready on dashboards
Revenue against the previous period, gross margin, net profit, cash flow, receivables and DSO, payables and DPO, open pipeline and win rate, Vietnamese financial statements.
Available, needs combining
Margin by product or customer, top-5 customer share, inventory value, labor cost against revenue, factory load. Pin the chart to your own dashboard or place two numbers side by side.
Not calculated out of the box
Break-even point, weeks of cash, days of inventory, on-time delivery rate to customers, defect rate. Your team calculates these, or they are built as reports during implementation.
The AI assistant, including voice questions, is available on Viindoo 17 and uses an AI provider key that your company registers and manages itself. All data shown in the screenshots is sample data.
Frequently asked questions
A good set of metrics for business owners has around ten to fifteen numbers, reviewed at different rhythms: cash and receivables weekly, results and margins monthly, customer concentration and people quarterly. More numbers usually mean less attention for each one.
The company does. For each request type you define the condition (for example an amount range), the approvers and the number of levels, usually with your implementation consultant. The rules can be changed whenever the organization changes.
Most of the data is already recorded by daily operations. You can analyze it with pivot tables and charts and pin the result to your own dashboard. Metrics that need a formula, such as break-even point, can be built as a report during implementation.
Next in the Viindoo by role series: Sales directors: stop chasing every deal and focus on the market.
Related articles
- More Data Is Not Always Better: Just Enough to Manage
- Difference between OKRs and KPIs? Which Indicator should be used?
- Should Automation Come Before or After Standardization?
- How Can SMEs Measure the ROI of Kaizen and Digitalization Without a Baseline?
- Cost and Efficiency Control in Software Implementation with Viindoo KPI-Based Design