Balance Sheet Analysis: Way to gain the Company's Financial Performance

Balance sheet analysis is a crucial part of financial analysis involving examining a company's balance sheet to gain insights of financial health. Applying Viindoo Enterprise Management Software will support business analysis this report more efficiency. Check it in this below article!

Balance Sheet Analysis: Way to gain the Company's Financial Performance

Balance sheet analysis is a crucial part of financial analysis

What is balance sheet?

A balance sheet is a financial statement that presents a company's assets, liabilities, and shareholders' equity (also called net worth). Along with the income statement and cash flow statement, it forms the foundation of a company's financial reporting.

For shareholders and potential investors, it is crucial to comprehend the structure of the balance sheet, how to interpret it, and the fundamentals of analyzing it. By understanding the information presented on a balance sheet, stakeholders can gain insight into a company's financial health and make informed investment decisions.

Balance Sheet Analysis: Way to gain the Company's Financial Performance

A balance sheet is a financial statement that presents a company's assets, liabilities, and shareholders' equity

Balance sheet examples

Balance Sheet Analysis: Way to gain the Company's Financial Performance

Source: Walmart.

Analyzing a company's balance sheet is a crucial step in evaluating its financial health. One of the most effective techniques for assessing a balance sheet is financial ratio analysis. Financial ratios use formulas to gain insight into a company's financial condition and operational efficiency.

One important ratio for balance sheet analysis is the debt-to-equity (D/E) ratio. This ratio compares a company's total liabilities to its shareholders' equity. Generally speaking, a D/E ratio under 2.0 is favorable as it indicates that the company has less debt and is less leveraged.

One of the balance sheet analysis examples, Walmart's one for FY 2022 showed a D/E ratio of 1.84, indicating that the company had $1.84 of debt for every dollar of equity value. Walmart's large positive shareholders' equity value, over $83.2 billion, suggests that the company has a strong financial position and can meet its obligations.

What Can a Balance Sheet Tell You?

There are several types of financial ratios that use information from a company's balance sheet, as below:

Liquidity (Current Ratio)

Liquidity refers to a company's ability to meet its short-term obligations using its current assets. The Current Ratio is a liquidity measure that compares a company's current assets to its current liabilities.

Current ratio = Assets/Liabilities

To read a balance sheet, locate the current assets and current liabilities sections and extract the corresponding figures. Then, divide the total current assets by the total current liabilities to obtain the current ratio. A current ratio of 1 or higher indicates that a company has sufficient current assets to cover its current liabilities. Conversely, a current ratio below 1 suggests that a company may have difficulty meeting its short-term obligations.

It's important to note that a high current ratio does not necessarily mean a company is financially healthy as excess cash may indicate inefficient use of resources. Likewise, a low current ratio may not always be a negative sign as some industries require lower levels of liquidity.

Debt-to-Equity Ratio

Debt-to-Equity Ratio is a financial ratio that compares a company's total liabilities (debts) to its shareholders' equity. It measures the proportion of debt and equity a company uses to finance its assets.

Debt-to-Equity Ratio = Liabilities/Owner's Equity

To read a balance sheet, find the total liabilities and shareholders' equity sections. Divide the total liabilities by the shareholders' equity to get the Debt-to-Equity Ratio. For example, if a company has $500,000 in liabilities and $1,000,000 in shareholders' equity, the Debt-to-Equity Ratio would be 0.5 ($500,000/$1,000,000).

A high Debt-to-Equity Ratio indicates that a company may be reliant on borrowed funds to finance its operations. This could expose the company to higher interest payments, making it more vulnerable to changes in interest rates. On the other hand, a low Debt-to-Equity Ratio may indicate that a company has a strong financial position with less reliance on debt financing.

Equity Ratio


Equity Ratio is a financial metric that measures the proportion of equity to total assets on a company's balance sheet. It is calculated by dividing the shareholder's equity by the total assets.

Equity Ratio = Shareholder's Equity/Assets

A high equity ratio suggests that a company has a lower level of debt and is less reliant on borrowing funds to finance its operations. On the other hand, a low equity ratio indicates that a company has higher levels of debt and may be more vulnerable to financial risks.

To read a balance sheet for the equity ratio, locate the figures for shareholder's equity and total assets and divide the former by the latter. The resulting ratio will give you an idea of how much of a company's assets are financed through shareholder equity. A higher ratio is generally considered more favorable as it indicates a lower risk of insolvency and greater stability in the long term.

Return on Equity (ROE)

Return on Equity (ROE) is a financial ratio that measures the profitability of a company by comparing its net income to its average shareholder equity. ROE indicates the amount of profit generated for each dollar of shareholder equity invested in the company.

Return on Equity = Net Income/Shareholders' Equity

To read a balance sheet and calculate ROE, you need to identify the company's net income and average shareholder equity from the balance sheet.

Net income can be found under the "Income Statement" section of the balance sheet, while average shareholder equity can be calculated by adding the beginning and ending shareholder equity for a given period and dividing by two.

Once you have these values, you can calculate the ROE by dividing the net income by the average shareholder equity and multiplying by 100 to get a percentage. A higher ROE indicates a more profitable company, while a lower ROE may suggest that the company is not generating as much profit relative to the amount of shareholder equity invested.

Fixed Asset Turnover Ratio

Fixed Asset Turnover Ratio is a financial metric used to measure how efficiently a company uses its fixed assets to generate revenue. It is calculated by dividing the company's net sales by the total value of its fixed assets.

Fixed Asset Turnover Ratio = Net Sales/ Fixed Assets

To read a balance sheet, look for the section working capital turnover ratio is a financial ratio that helps investors and analysts assess the efficiency of a company's working capital management.

To calculate this ratio, divide the net sales by the average working capital of the company. The higher the ratio, the more efficient the company in managing its working capital.

A high ratio indicates that the company is generating a significant amount of revenue with minimal investment in working capital. On the other hand, a low ratio suggests that the company is not efficiently utilizing its working capital to generate sales. that lists the company's fixed assets and their corresponding values. You can then use this information to calculate the Fixed Asset Turnover Ratio and analyze whether the company is effectively using its fixed assets to generate revenue. A high ratio indicates that the company is generating significant revenue from its fixed assets, while a low ratio may suggest that the company needs to improve its asset management strategies.

Working Capital Turnover Ratio

Working Capital Turnover Ratio is a financial ratio that helps investors and analysts assess the efficiency of a company's working capital management.

To calculate this ratio, divide the net sales by the average working capital of the company. The higher the ratio, the more efficient the company in managing its working capital.

Working Capital Turnover Ratio = Net Sales/Working Capital

A high ratio indicates that the company is generating a significant amount of revenue with minimal investment in working capital. On the other hand, a low ratio suggests that the company is not efficiently utilizing its working capital to generate sales.

By examining these financial ratios and comparing them to industry benchmarks and historical trends, investors can gain a more comprehensive understanding of the company's financial position, identify potential risks, and assess its long-term growth prospects. This analysis can also help investors make informed decisions about buying, holding, or selling the company's stock.

Balance Sheet Analysis: Way to gain the Company's Financial Performance

Types of financial ratios: liquidity ratios, solvency ratios, financial strength ratios, activity ratios

Vertical vs. Horizontal Analysis of balance sheet

Vertical and horizontal analysis are two commonly used techniques for analyzing balance sheets.

A vertical analysis balance sheet, also known as a common size analysis balance sheet, involves calculating the proportion of each line item on the balance sheet relative to a base figure, typically the total assets. By expressing each item as a percentage of total assets, vertical analysis allows for easier comparison of financial statements over time and between different companies. Vertical analysis can provide insights into the composition and structure of a company's balance sheet, identifying potential trends and risks.

Horizontal analysis of balance sheet, also known as trend analysis, involves comparing financial statement data over a period of time, typically several years. By looking at the changes in line items on the balance sheet, horizontal analysis can help identify trends and patterns, as well as potential strengths and weaknesses in a company's financial position. For example, a company with a decreasing inventory balance over several years may indicate that the company is becoming more efficient in managing its inventory.

Both techniques have their own strengths and limitations. Vertical analysis provides a snapshot of a company's financial position at a specific point in time, but it does not reveal changes over time. Horizontal analysis allows for the comparison of financial data over time, but it does not provide insights into the composition of the balance sheet.

To get a more complete picture of a company's financial health, it is often useful to use both vertical and horizontal analysis techniques. By using both techniques, investors can gain a more comprehensive understanding of a company's financial position and make more informed investment decisions.

Balance Sheet Analysis: Way to gain the Company's Financial Performance

Vertical and horizontal analysis are two commonly used techniques for analyzing balance sheets

Viindoo Accounting software: Easier and more efficient problem solved

Accounting program software can make the process of analyzing a balance sheet easier and more efficient:

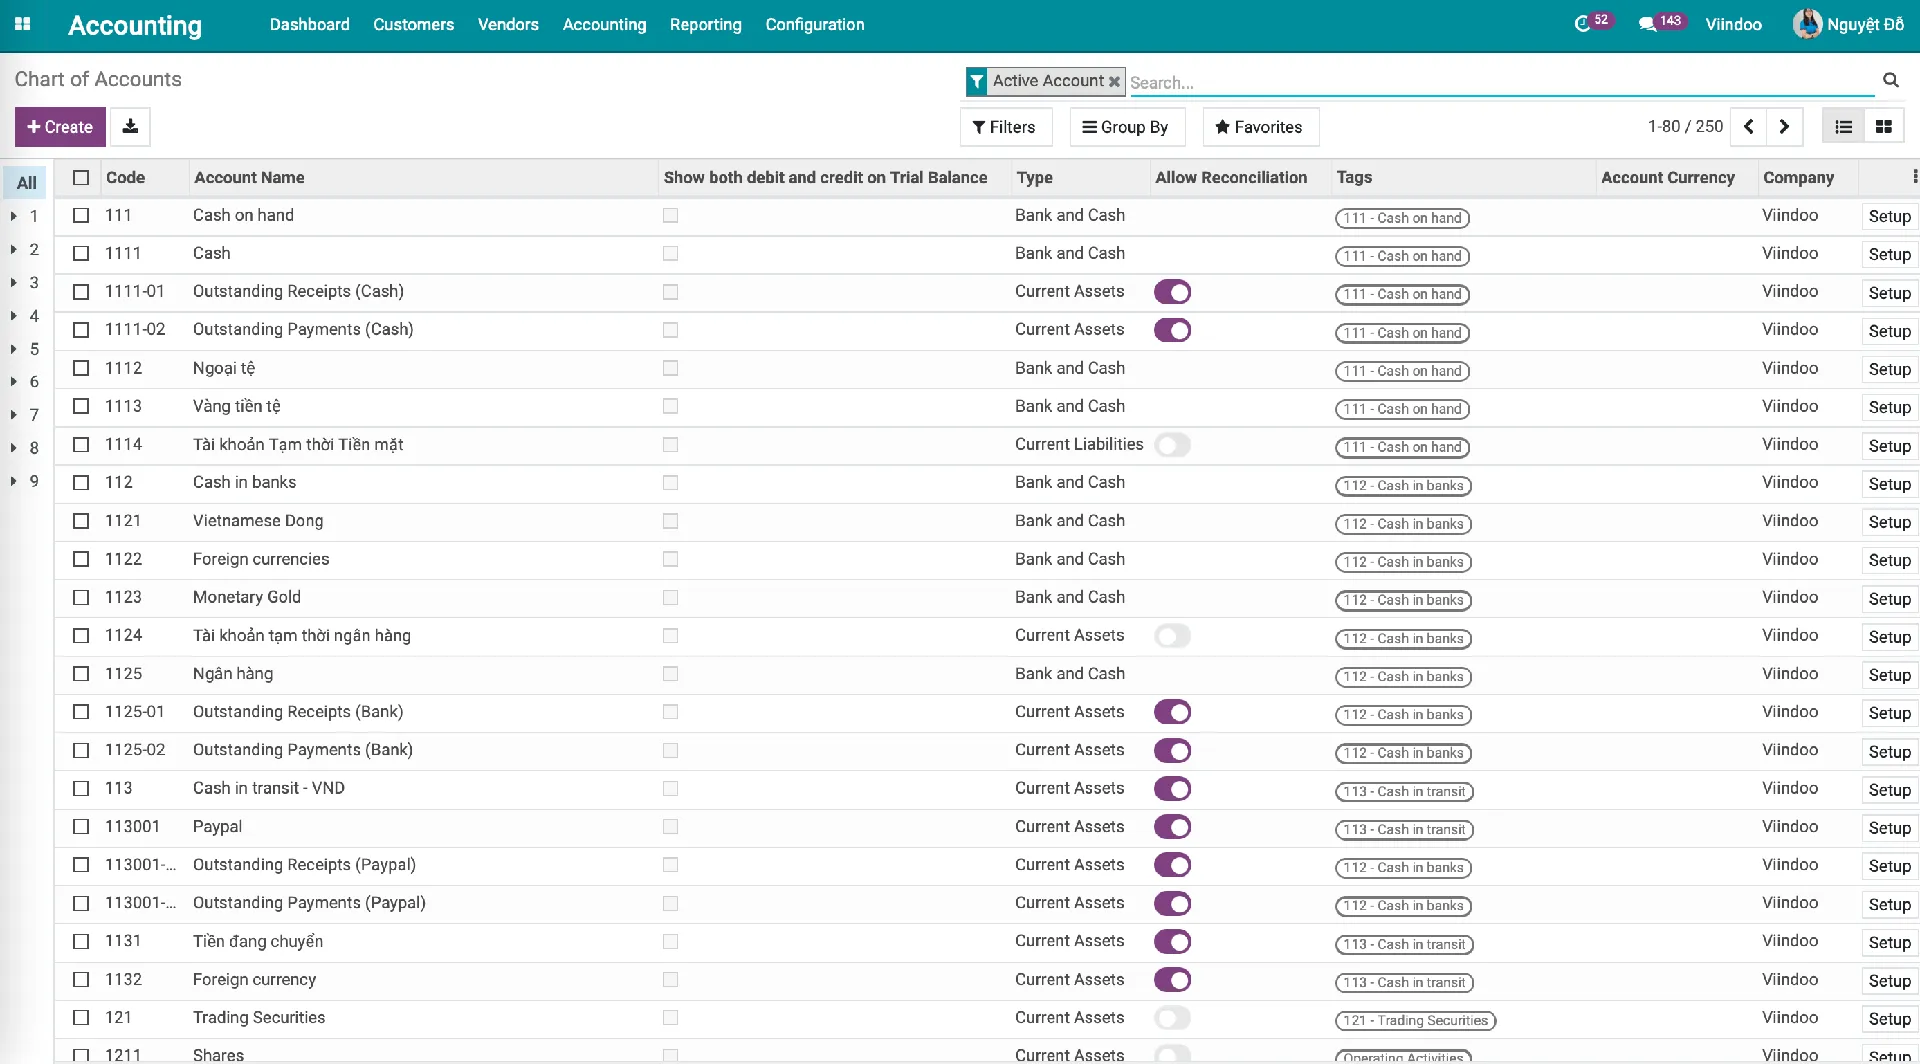
Firstly, accounting software can automate the process of creating a balance sheet, by automatically aggregating all the relevant financial information and presenting it in a standard format. This saves time and reduces the risk of errors that may occur when creating a balance sheet manually.

Secondly, many finance and accounting softwares nowadays also provide various tools and features that can make analyzing the balance sheet easier. For example, some software may provide financial ratios and other key performance indicators (KPIs) that can help in assessing a company's financial health. Additionally, some software may allow for trend analysis, making it easier to compare balance sheets over different periods.

Finally, accounting software facilitates collaboration and data sharing between multiple users, such as accountants, auditors, and business owners. This can make it easier to gather and analyze financial information and ensure that everyone involved in the financial reporting process is on the same page.

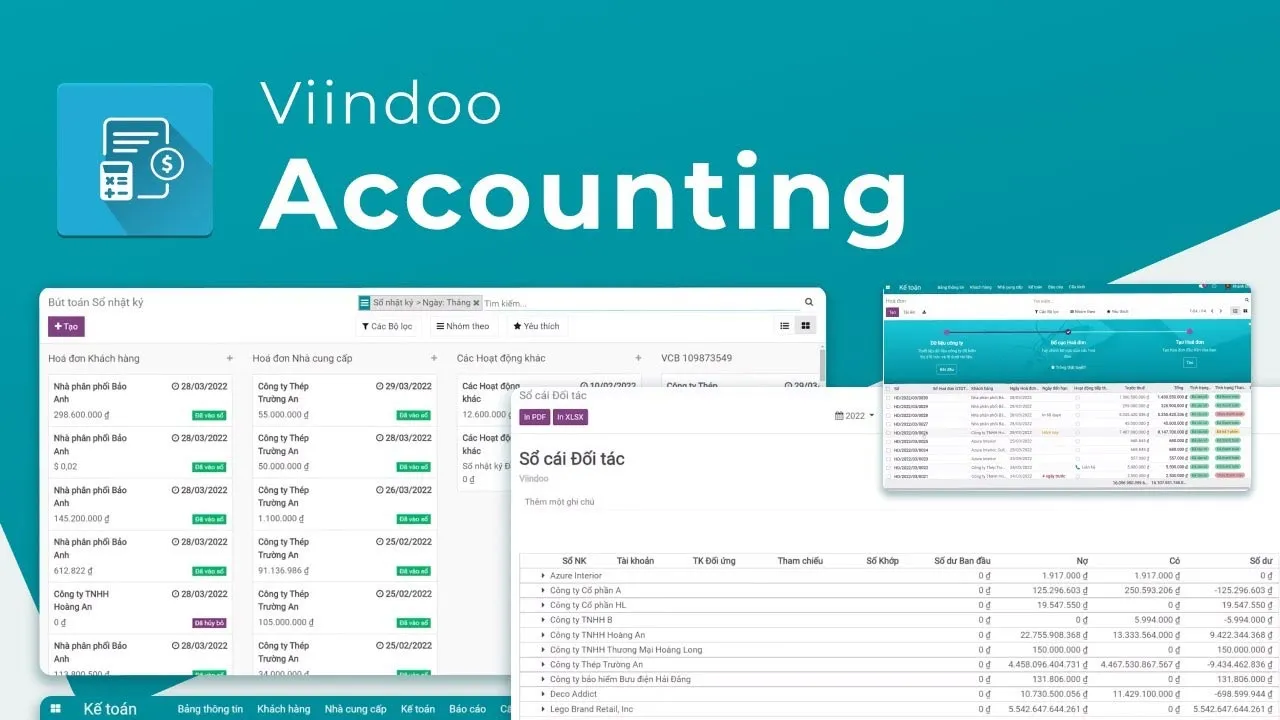
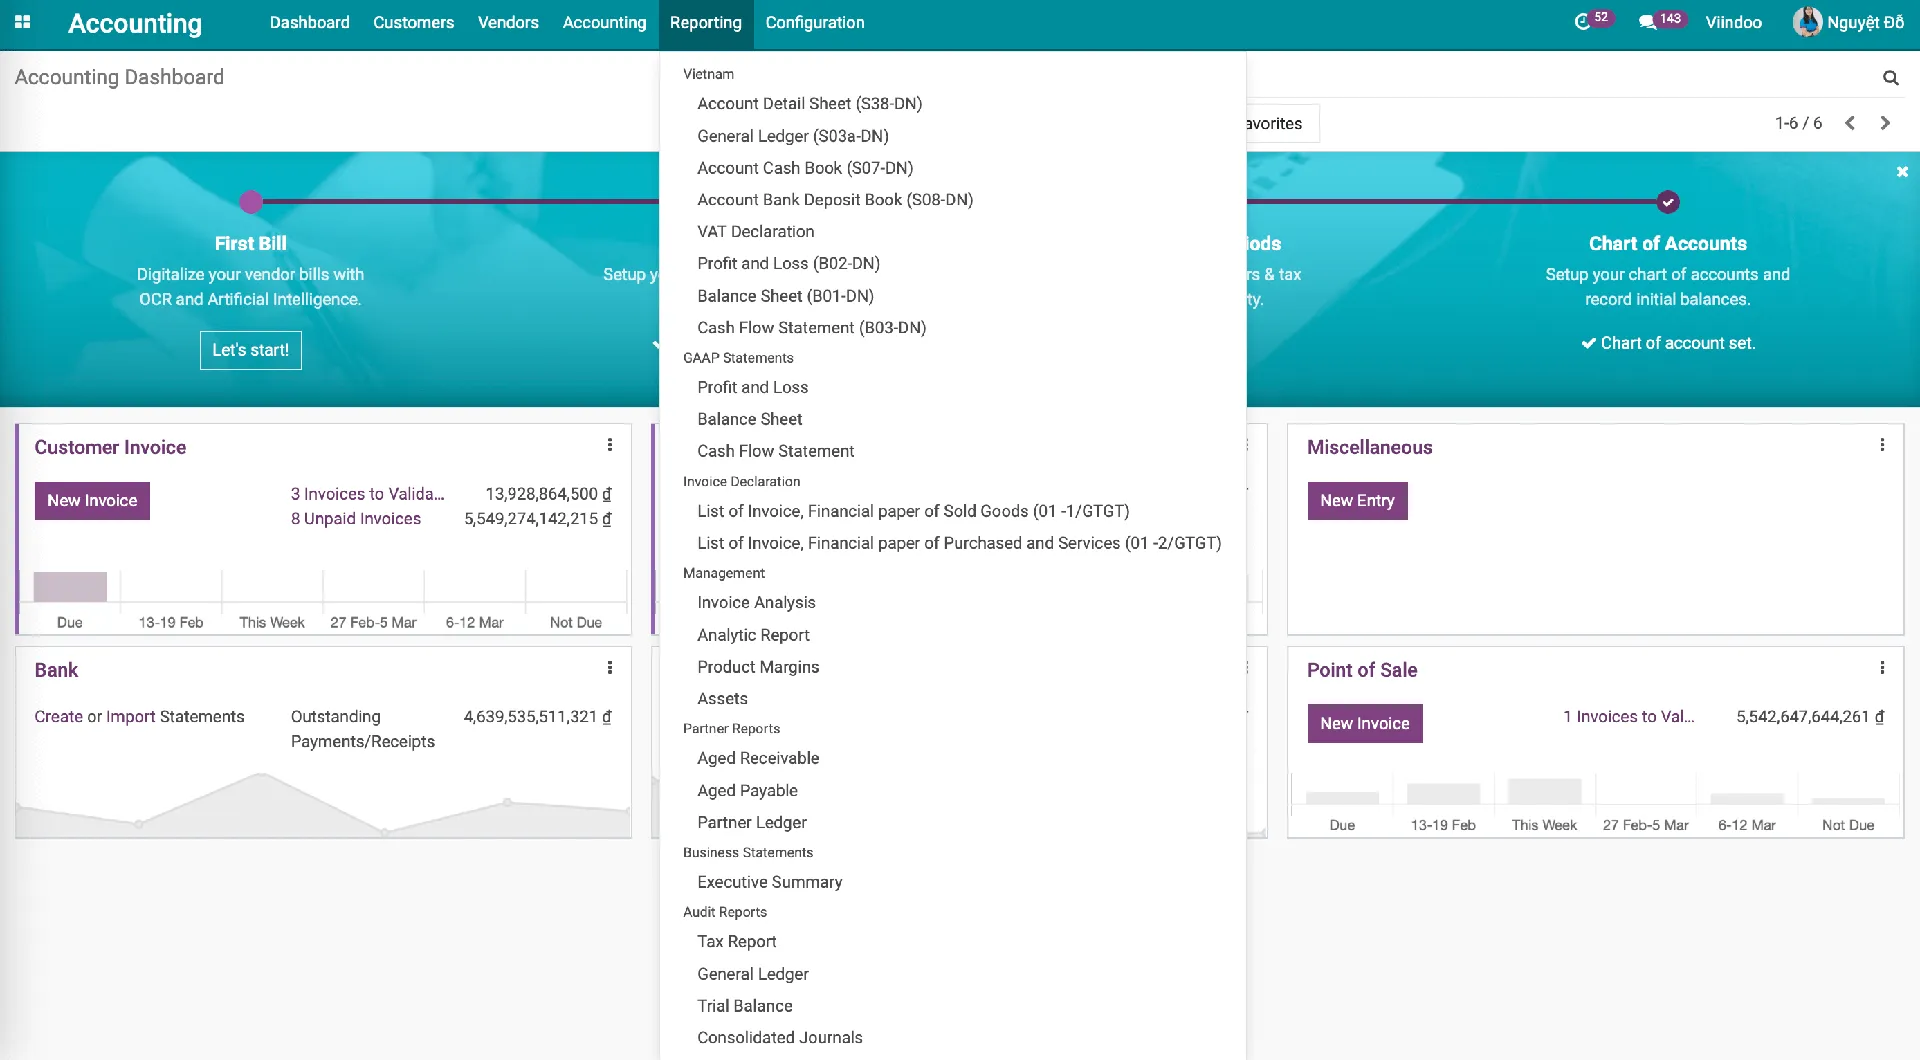
Among the countless accounting software used in businesses today, Viindoo appears to be an enterprise resource planning (ERP) software that includes accounting and finance modules. It claims to provide various financial reports, including balance sheets, income statements, and cash flow statements.

While it is possible that Viindoo's finance and accounting software may include features that make balance sheet analysis easier, the effectiveness of the software will depend on various factors such as the complexity of the business, the user's knowledge of accounting principles, and the specific features offered by the software. It is important to thoroughly research and evaluate any accounting software before making a purchasing decision, to ensure that it meets the needs of your business and financial reporting requirements.

Balance Sheet Analysis: Way to gain the Company's Financial Performance

Accounting program software can make the process of analyzing a balance sheet more efficient

Understanding the meaning of the balance sheet analysis will help businesses have a comprehensive overview of their financial situation so that achieve profitability and revenue goals in the future. Coupled with the use of excellent supporting software such as Viindoo Accounting Software, this creates a significant advantage for any business in today's market. Contact Viindoo via hotline +84 225 730 9838 to get more support from our consultant department.

More Information:

FAQs

How do you analyze a balance sheet?

A company's balance sheet can be evaluated by three broad categories of investment-quality measurements: working capital, or short-term liquidity, asset performance, and capitalization structure.

A healthy company's balance sheet typically exhibits strong liquidity with a higher current ratio and manageable debt levels reflected in a lower debt-to-equity ratio, indicating a balance between debt and equity. It also shows positive retained earnings and a growing equity section, demonstrating profitability and financial stability over time.

Balance Sheet Analysis: Way to gain the Company's Financial Performance
Viindoo Technology Joint Stock Company, Danny Ha March 22, 2023

SHARE THIS POST
Why is analyzing inventories on balance sheet important?